

Key Insights
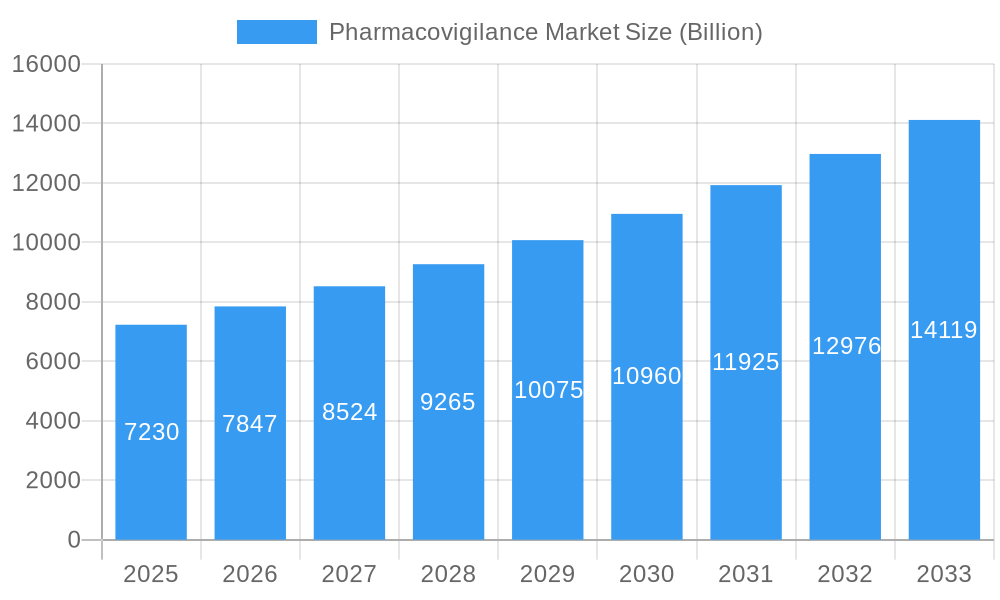
The global pharmacovigilance market, valued at $7.23 billion in 2025, is projected to experience robust growth, exhibiting a compound annual growth rate (CAGR) of 8.65% from 2025 to 2033. This expansion is fueled by several key factors. The increasing incidence of adverse drug reactions (ADRs), coupled with stricter regulatory requirements for drug safety monitoring across regions like North America and Europe, are driving demand for sophisticated pharmacovigilance solutions. Furthermore, the growing adoption of electronic health records (EHRs) and advanced data analytics capabilities enables more efficient signal detection and risk assessment, contributing significantly to market growth. The rise of contract research organizations (CROs) specializing in pharmacovigilance services also plays a crucial role, offering flexible and scalable solutions for pharmaceutical companies of all sizes. The market is segmented across various end-users (hospitals, pharmaceutical companies, etc.), clinical trial phases (preclinical to post-market), service providers (in-house vs. outsourced), and reporting types (spontaneous, intensified, targeted, cohort event monitoring, EHR mining). The diverse nature of these segments presents various opportunities for market players.
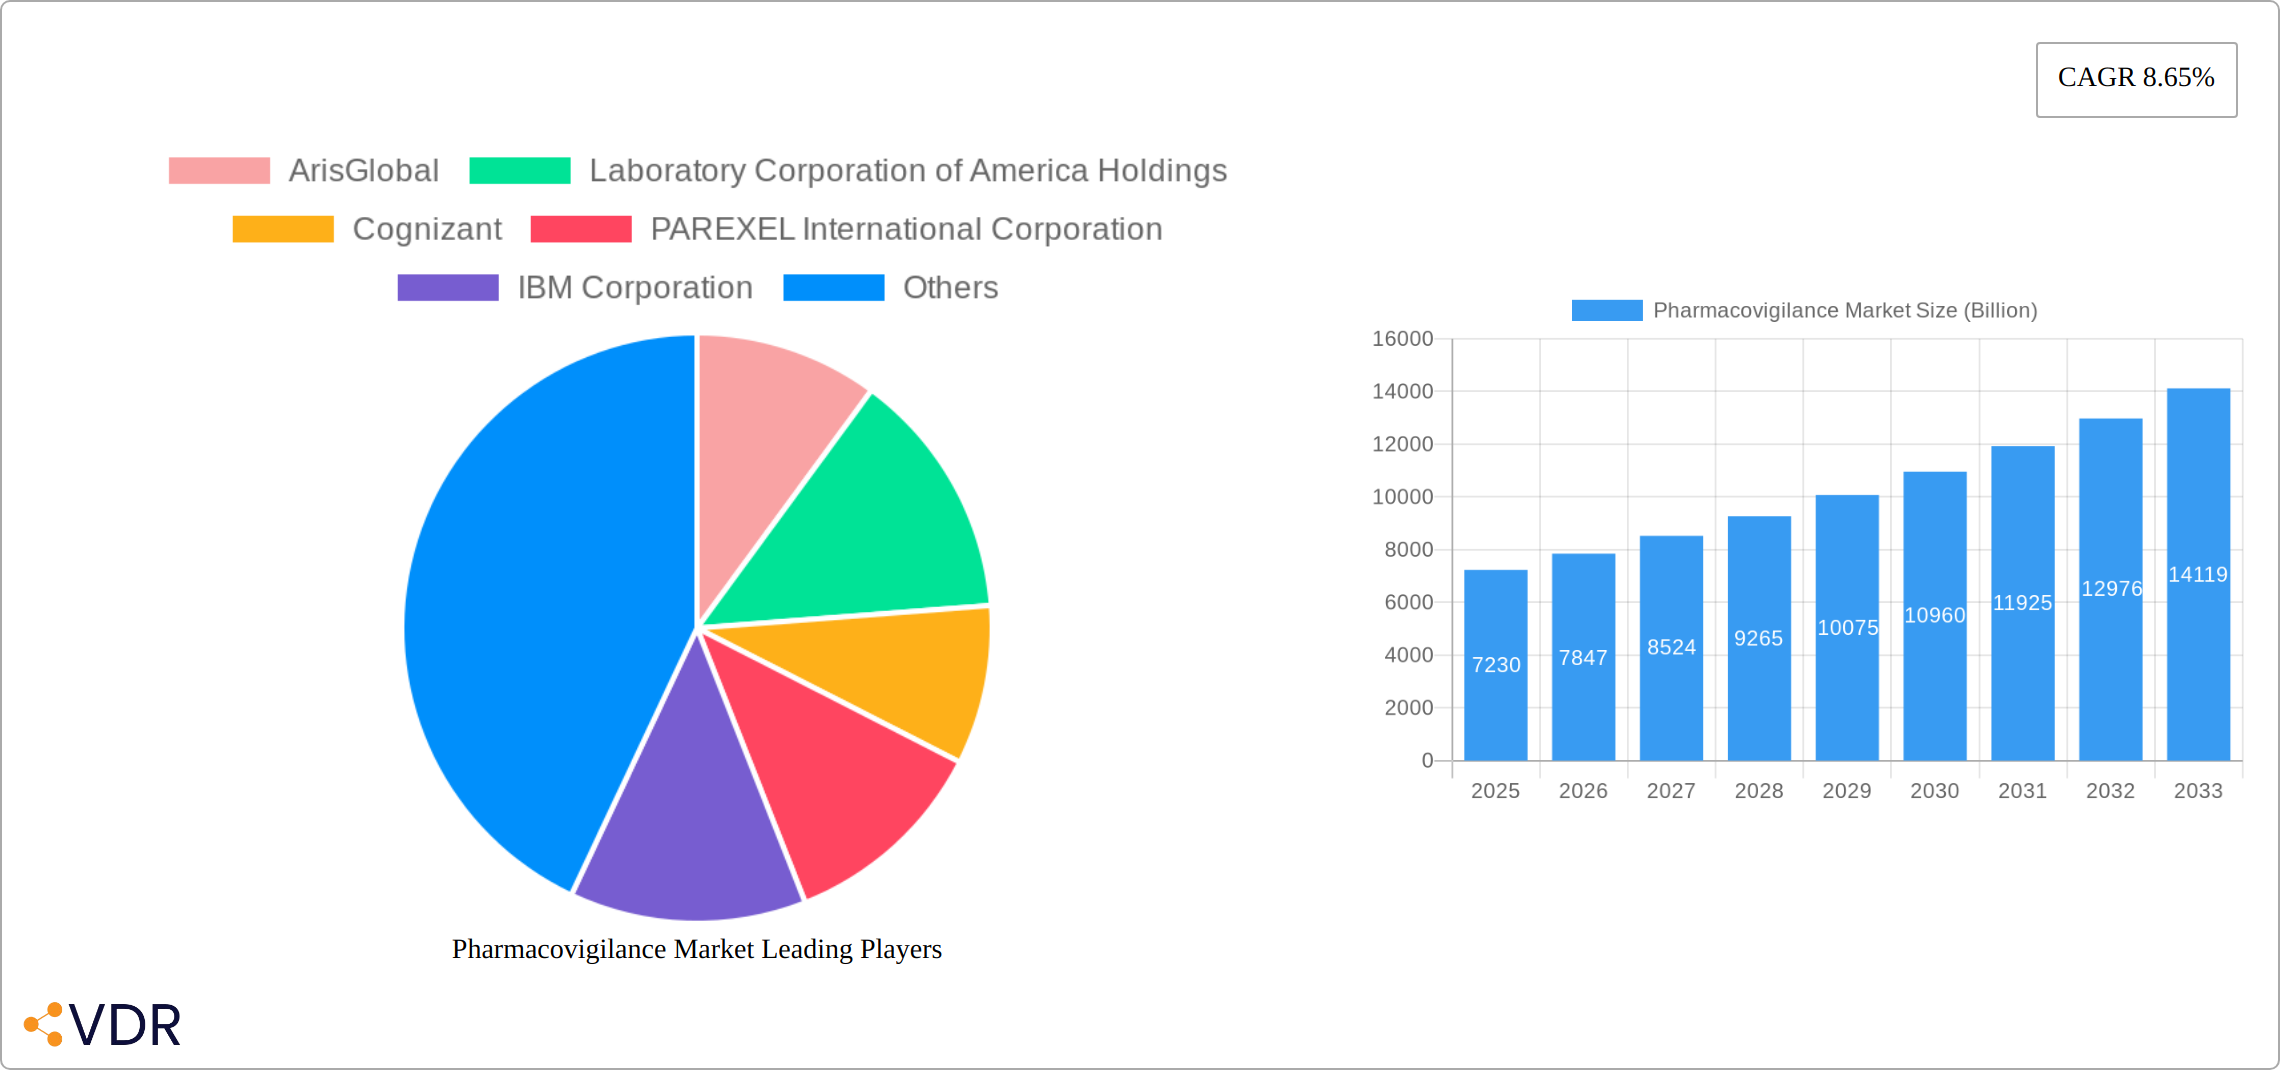
Pharmacovigilance Market Market Size (In Billion)
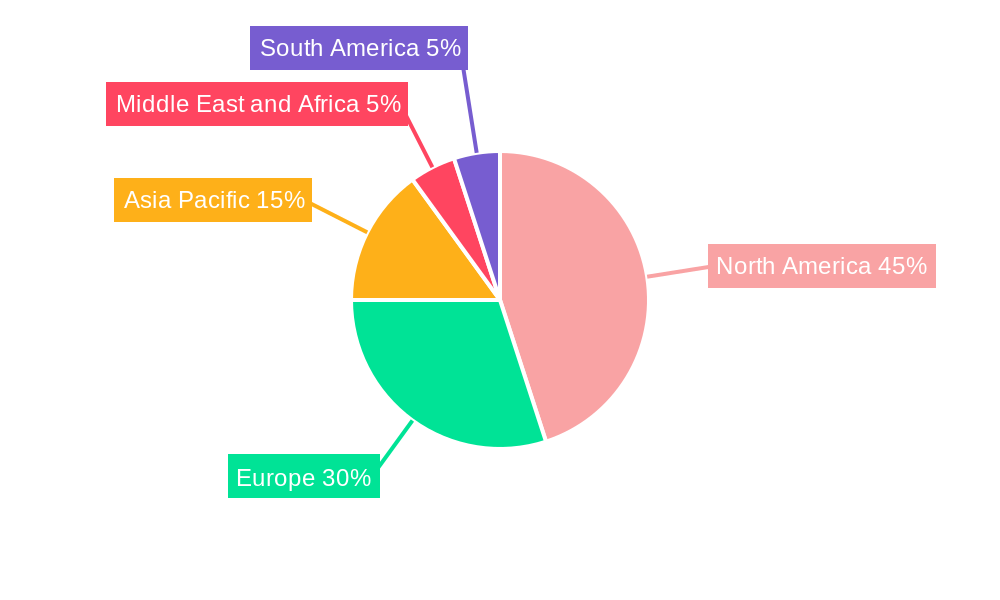
The market's geographical distribution reflects the established presence of pharmaceutical companies and robust regulatory frameworks. North America currently holds a significant market share, due to high ADR reporting rates and stringent regulatory compliance requirements. However, the Asia-Pacific region is expected to witness substantial growth in the coming years, driven by increasing healthcare spending, rising drug consumption, and the expanding pharmaceutical industry in countries like China and India. Competitive pressures within the market are intense, with established players like IQVIA, Parexel, and ArisGlobal competing with other large IT and consulting companies like IBM, Accenture, and Cognizant. The ongoing technological advancements in data analytics and artificial intelligence are expected to further reshape the competitive landscape, leading to increased innovation and the emergence of new service offerings within the pharmacovigilance market.
Pharmacovigilance Market Company Market Share
Pharmacovigilance Market: A Comprehensive Report (2019-2033)
This in-depth report provides a comprehensive analysis of the Pharmacovigilance Market, encompassing market dynamics, growth trends, regional dominance, product landscape, key players, and future outlook. With a study period spanning 2019-2033, a base year of 2025, and a forecast period of 2025-2033, this report offers invaluable insights for industry professionals, investors, and strategic decision-makers. The market is expected to reach xx Billion by 2033.
Pharmacovigilance Market Dynamics & Structure
This section analyzes the Pharmacovigilance market's structure, highlighting key dynamics influencing its growth trajectory. We delve into market concentration, examining the market share held by major players and assessing the level of competition. Technological innovation, regulatory landscapes impacting the sector, and the presence of competitive product substitutes are also explored. Further, the report investigates end-user demographics, their evolving needs and preferences, and the influence of mergers and acquisitions (M&A) activities on market consolidation.
- Market Concentration: The market is moderately concentrated, with key players holding significant shares. Further analysis reveals xx% of the market is controlled by the top 5 players.
- Technological Innovation: Advancements in AI, machine learning, and big data analytics are driving innovation in pharmacovigilance, enhancing efficiency and effectiveness.
- Regulatory Framework: Stringent regulatory requirements across different regions impact market growth. Compliance costs and the need for robust data management systems influence market dynamics.
- M&A Activity: The Pharmacovigilance market has witnessed xx M&A deals in the past five years, reflecting industry consolidation and strategic expansions.
- End-User Demographics: Pharmaceutical companies constitute the largest end-user segment, followed by hospitals and other end-users.
Pharmacovigilance Market Growth Trends & Insights
This section provides a detailed analysis of the Pharmacovigilance market's growth trajectory, leveraging proprietary data and in-depth industry expertise. We present a comprehensive understanding of market evolution, examining historical market size (2019-2024), current estimates (2025), and future projections (2025-2033). The report meticulously analyzes adoption rates across diverse segments, pinpointing key drivers and challenges impacting growth. We delve into the influence of technological advancements, such as AI and machine learning, on market trends, alongside shifts in consumer behavior and evolving regulatory landscapes. Precise quantitative insights are provided through key metrics, including CAGR and market penetration. The market is projected to experience a CAGR of [Insert Projected CAGR]% during the forecast period, driven primarily by [mention 2-3 key drivers, e.g., increasing drug approvals, growing awareness of drug safety, rising adoption of advanced technologies]. This growth is further fueled by [mention another driver, e.g., the expanding use of real-world data in pharmacovigilance].
Dominant Regions, Countries, or Segments in Pharmacovigilance Market
This section identifies the leading regions, countries, and market segments within the Pharmacovigilance market, analyzing their contributions to overall market expansion and highlighting the factors driving their prominence. We analyze key drivers within each segment, including End User (Hospitals, Pharmaceutical Companies, Contract Research Organizations (CROs), Biotech Companies, Other End Users), Clinical Trial Phase (Preclinical, Phase I, Phase II, Phase III, Phase IV), Service Provider (In-house, Contract Outsourcing, Specialized Pharmacovigilance Companies), and Type of Reporting (Spontaneous Reporting, Intensified ADR Reporting, Targeted Spontaneous Reporting, Cohort Event Monitoring, EHR Mining, Signal Detection). The analysis considers the impact of regulatory changes and evolving safety standards on segment performance.
- Dominant Region: North America continues to hold a significant market share, driven by robust regulatory frameworks, high drug approvals, and substantial investments in pharmacovigilance infrastructure. However, [mention a region showing strong growth, e.g., Asia-Pacific] is experiencing rapid growth due to [mention reasons, e.g., increasing healthcare expenditure, growing pharmaceutical industry].
- Dominant Segment (End User): Pharmaceutical companies remain the largest consumers of pharmacovigilance services due to stringent regulatory requirements and the necessity for robust safety monitoring. However, the increasing involvement of CROs and biotech companies is also driving segment growth.
- Dominant Segment (Service Provider): Contract outsourcing continues to be a dominant service provider model, driven by the demand for specialized expertise, scalability, and cost optimization. [Mention trends like growth of specialized PV companies].
- Dominant Segment (Clinical Trial Phase): Phase III and IV clinical trials continue to significantly contribute to the market due to rigorous safety monitoring requirements. The increasing adoption of decentralized clinical trials (DCTs) is also impacting this segment.
Pharmacovigilance Market Product Landscape
The Pharmacovigilance market offers a diverse range of products and services, encompassing software solutions, consulting services, and data analytics platforms. Recent innovations focus on enhancing data management, improving signal detection, and streamlining regulatory reporting. These advancements have improved efficiency, reduced costs, and enhanced overall safety monitoring. Key selling propositions include improved data accuracy, enhanced regulatory compliance, and reduced time-to-market for new drugs.
Key Drivers, Barriers & Challenges in Pharmacovigilance Market
Key Drivers:
- Increasing regulatory scrutiny and compliance requirements.
- Growing incidence of adverse drug reactions (ADRs).
- Technological advancements in data analytics and AI.
- Rising demand for efficient and cost-effective pharmacovigilance solutions.
Challenges & Restraints:
- High implementation and maintenance costs for advanced technologies.
- Data security and privacy concerns.
- Lack of standardization across different regions.
- Competition from established and emerging players.
Emerging Opportunities in Pharmacovigilance Market
The Pharmacovigilance market presents several lucrative emerging opportunities. The increasing adoption of decentralized clinical trials (DCTs) is streamlining data collection and improving patient engagement, leading to more efficient safety monitoring. The rise of real-world evidence (RWE) provides valuable post-market safety insights, allowing for proactive risk mitigation. The integration of wearable sensors and other connected health technologies enables continuous patient monitoring, enhancing the early detection of adverse events. Furthermore, expansion into emerging markets with growing healthcare infrastructure and developing specialized solutions for specific therapeutic areas, such as oncology and immunology, present significant growth potentials. The application of advanced analytics and artificial intelligence (AI) for proactive safety signal detection and risk assessment is revolutionizing pharmacovigilance practices.
Growth Accelerators in the Pharmacovigilance Market Industry
Sustained growth in the Pharmacovigilance market will be fueled by several key accelerators. Strategic partnerships between technology providers and pharmaceutical companies are fostering innovation and enhancing the scalability of pharmacovigilance solutions. Continuous investments in R&D for advanced analytics, AI-driven solutions, and machine learning algorithms will further propel market expansion by improving the efficiency and accuracy of safety signal detection. Global market expansion into developing economies with growing healthcare infrastructure and increasing regulatory scrutiny is another significant growth catalyst. The increasing focus on patient safety and regulatory compliance across the globe will continue to drive demand for sophisticated pharmacovigilance services.
Key Players Shaping the Pharmacovigilance Market Market
- ArisGlobal
- Laboratory Corporation of America Holdings
- Cognizant
- PAREXEL International Corporation
- IBM Corporation
- Wipro Ltd
- ICON PLC
- Accenture
- BioClinica
- Linical Accelovance
- IQVIA
- TAKE Solutions Ltd
- ITClinical
- Capgemini
- United BioSource Corporation
Notable Milestones in Pharmacovigilance Market Sector
- February 2022: Cognizant partnered with Medable Inc. to deliver clinical research solutions for decentralized clinical trials. This partnership expanded the reach of decentralized trial capabilities.
- February 2022: LINK Medical and Viedoc partnered to improve trial efficiency, fostering collaboration and innovation within the industry. This partnership highlighted the increasing focus on efficiency and collaboration in clinical trials.
In-Depth Pharmacovigilance Market Market Outlook
The Pharmacovigilance market is poised for significant growth, driven by technological advancements, increasing regulatory pressures, and a growing focus on patient safety. Strategic partnerships, market expansions, and the adoption of innovative solutions will shape the market's future trajectory. The market presents significant opportunities for established players and new entrants, demanding proactive strategies to capitalize on emerging trends.
Pharmacovigilance Market Segmentation
-
1. Clinical Trial Phase
- 1.1. Preclinical
- 1.2. Phase I
- 1.3. Phase II
- 1.4. Phase III
- 1.5. Phase IV
-
2. Service Provider
- 2.1. In-house
- 2.2. Contract Outsourcing
-
3. Type of Reporting
- 3.1. Spontaneous Reporting
- 3.2. Intensified ADR Reporting
- 3.3. Targeted Spontaneous Reporting
- 3.4. Cohort Event Monitoring
- 3.5. EHR Mining
-
4. End User
- 4.1. Hospitals
- 4.2. Pharmaceutical Companies
- 4.3. Other End Users
Pharmacovigilance Market Segmentation By Geography
-
1. North America
- 1.1. United States
- 1.2. Canada
- 1.3. Mexico
-
2. Europe
- 2.1. Germany
- 2.2. United Kingdom
- 2.3. France
- 2.4. Italy
- 2.5. Spain
- 2.6. Rest of Europe
-
3. Asia Pacific
- 3.1. China
- 3.2. Japan
- 3.3. India
- 3.4. Australia
- 3.5. South Korea
- 3.6. Rest of Asia Pacific
-
4. Middle East and Africa
- 4.1. GCC
- 4.2. South Africa
- 4.3. Rest of Middle East and Africa
-
5. South America
- 5.1. Brazil
- 5.2. Argentina
- 5.3. Rest of South America
Pharmacovigilance Market Regional Market Share
Geographic Coverage of Pharmacovigilance Market
Pharmacovigilance Market REPORT HIGHLIGHTS
| Aspects | Details |
|---|---|
| Study Period | 2020-2034 |
| Base Year | 2025 |
| Estimated Year | 2026 |
| Forecast Period | 2026-2034 |
| Historical Period | 2020-2025 |
| Growth Rate | CAGR of 8.65% from 2020-2034 |
| Segmentation |
|
Table of Contents
- 1. Introduction
- 1.1. Research Scope
- 1.2. Market Segmentation
- 1.3. Research Objective
- 1.4. Definitions and Assumptions
- 2. Executive Summary
- 2.1. Market Snapshot
- 3. Market Dynamics
- 3.1. Market Drivers
- 3.2. Market Restrains
- 3.3. Market Trends
- 3.4. Market Opportunities
- 4. Market Factor Analysis
- 4.1. Porters Five Forces
- 4.1.1. Bargaining Power of Suppliers
- 4.1.2. Bargaining Power of Buyers
- 4.1.3. Threat of New Entrants
- 4.1.4. Threat of Substitutes
- 4.1.5. Competitive Rivalry
- 4.2. PESTEL analysis
- 4.3. BCG Analysis
- 4.3.1. Stars (High Growth, High Market Share)
- 4.3.2. Cash Cows (Low Growth, High Market Share)
- 4.3.3. Question Mark (High Growth, Low Market Share)
- 4.3.4. Dogs (Low Growth, Low Market Share)
- 4.4. Ansoff Matrix Analysis
- 4.5. Supply Chain Analysis
- 4.6. Regulatory Landscape
- 4.7. Current Market Potential and Opportunity Assessment (TAM–SAM–SOM Framework)
- 4.8. VDR Analyst Note
- 4.1. Porters Five Forces
- 5. Market Analysis, Insights and Forecast 2021-2033
- 5.1. Market Analysis, Insights and Forecast - by Clinical Trial Phase
- 5.1.1. Preclinical
- 5.1.2. Phase I
- 5.1.3. Phase II
- 5.1.4. Phase III
- 5.1.5. Phase IV
- 5.2. Market Analysis, Insights and Forecast - by Service Provider
- 5.2.1. In-house
- 5.2.2. Contract Outsourcing
- 5.3. Market Analysis, Insights and Forecast - by Type of Reporting
- 5.3.1. Spontaneous Reporting
- 5.3.2. Intensified ADR Reporting
- 5.3.3. Targeted Spontaneous Reporting
- 5.3.4. Cohort Event Monitoring
- 5.3.5. EHR Mining
- 5.4. Market Analysis, Insights and Forecast - by End User
- 5.4.1. Hospitals
- 5.4.2. Pharmaceutical Companies
- 5.4.3. Other End Users
- 5.5. Market Analysis, Insights and Forecast - by Region
- 5.5.1. North America
- 5.5.2. Europe
- 5.5.3. Asia Pacific
- 5.5.4. Middle East and Africa
- 5.5.5. South America
- 5.1. Market Analysis, Insights and Forecast - by Clinical Trial Phase
- 6. Global Pharmacovigilance Market Analysis, Insights and Forecast, 2021-2033
- 6.1. Market Analysis, Insights and Forecast - by Clinical Trial Phase
- 6.1.1. Preclinical
- 6.1.2. Phase I
- 6.1.3. Phase II
- 6.1.4. Phase III
- 6.1.5. Phase IV
- 6.2. Market Analysis, Insights and Forecast - by Service Provider
- 6.2.1. In-house
- 6.2.2. Contract Outsourcing
- 6.3. Market Analysis, Insights and Forecast - by Type of Reporting
- 6.3.1. Spontaneous Reporting
- 6.3.2. Intensified ADR Reporting
- 6.3.3. Targeted Spontaneous Reporting
- 6.3.4. Cohort Event Monitoring
- 6.3.5. EHR Mining
- 6.4. Market Analysis, Insights and Forecast - by End User
- 6.4.1. Hospitals
- 6.4.2. Pharmaceutical Companies
- 6.4.3. Other End Users
- 6.1. Market Analysis, Insights and Forecast - by Clinical Trial Phase
- 7. North America Pharmacovigilance Market Analysis, Insights and Forecast, 2021-2033
- 7.1. Market Analysis, Insights and Forecast - by Clinical Trial Phase
- 7.1.1. Preclinical
- 7.1.2. Phase I
- 7.1.3. Phase II
- 7.1.4. Phase III
- 7.1.5. Phase IV
- 7.2. Market Analysis, Insights and Forecast - by Service Provider
- 7.2.1. In-house
- 7.2.2. Contract Outsourcing
- 7.3. Market Analysis, Insights and Forecast - by Type of Reporting
- 7.3.1. Spontaneous Reporting
- 7.3.2. Intensified ADR Reporting
- 7.3.3. Targeted Spontaneous Reporting
- 7.3.4. Cohort Event Monitoring
- 7.3.5. EHR Mining
- 7.4. Market Analysis, Insights and Forecast - by End User
- 7.4.1. Hospitals
- 7.4.2. Pharmaceutical Companies
- 7.4.3. Other End Users
- 7.1. Market Analysis, Insights and Forecast - by Clinical Trial Phase
- 8. Europe Pharmacovigilance Market Analysis, Insights and Forecast, 2021-2033
- 8.1. Market Analysis, Insights and Forecast - by Clinical Trial Phase
- 8.1.1. Preclinical
- 8.1.2. Phase I
- 8.1.3. Phase II
- 8.1.4. Phase III
- 8.1.5. Phase IV
- 8.2. Market Analysis, Insights and Forecast - by Service Provider
- 8.2.1. In-house
- 8.2.2. Contract Outsourcing
- 8.3. Market Analysis, Insights and Forecast - by Type of Reporting
- 8.3.1. Spontaneous Reporting
- 8.3.2. Intensified ADR Reporting
- 8.3.3. Targeted Spontaneous Reporting
- 8.3.4. Cohort Event Monitoring
- 8.3.5. EHR Mining
- 8.4. Market Analysis, Insights and Forecast - by End User
- 8.4.1. Hospitals
- 8.4.2. Pharmaceutical Companies
- 8.4.3. Other End Users
- 8.1. Market Analysis, Insights and Forecast - by Clinical Trial Phase
- 9. Asia Pacific Pharmacovigilance Market Analysis, Insights and Forecast, 2021-2033
- 9.1. Market Analysis, Insights and Forecast - by Clinical Trial Phase
- 9.1.1. Preclinical
- 9.1.2. Phase I
- 9.1.3. Phase II
- 9.1.4. Phase III
- 9.1.5. Phase IV
- 9.2. Market Analysis, Insights and Forecast - by Service Provider
- 9.2.1. In-house
- 9.2.2. Contract Outsourcing
- 9.3. Market Analysis, Insights and Forecast - by Type of Reporting
- 9.3.1. Spontaneous Reporting
- 9.3.2. Intensified ADR Reporting
- 9.3.3. Targeted Spontaneous Reporting
- 9.3.4. Cohort Event Monitoring
- 9.3.5. EHR Mining
- 9.4. Market Analysis, Insights and Forecast - by End User
- 9.4.1. Hospitals
- 9.4.2. Pharmaceutical Companies
- 9.4.3. Other End Users
- 9.1. Market Analysis, Insights and Forecast - by Clinical Trial Phase
- 10. Middle East and Africa Pharmacovigilance Market Analysis, Insights and Forecast, 2021-2033
- 10.1. Market Analysis, Insights and Forecast - by Clinical Trial Phase
- 10.1.1. Preclinical
- 10.1.2. Phase I
- 10.1.3. Phase II
- 10.1.4. Phase III
- 10.1.5. Phase IV
- 10.2. Market Analysis, Insights and Forecast - by Service Provider
- 10.2.1. In-house
- 10.2.2. Contract Outsourcing
- 10.3. Market Analysis, Insights and Forecast - by Type of Reporting
- 10.3.1. Spontaneous Reporting
- 10.3.2. Intensified ADR Reporting
- 10.3.3. Targeted Spontaneous Reporting
- 10.3.4. Cohort Event Monitoring
- 10.3.5. EHR Mining
- 10.4. Market Analysis, Insights and Forecast - by End User
- 10.4.1. Hospitals
- 10.4.2. Pharmaceutical Companies
- 10.4.3. Other End Users
- 10.1. Market Analysis, Insights and Forecast - by Clinical Trial Phase
- 11. South America Pharmacovigilance Market Analysis, Insights and Forecast, 2021-2033
- 11.1. Market Analysis, Insights and Forecast - by Clinical Trial Phase
- 11.1.1. Preclinical
- 11.1.2. Phase I
- 11.1.3. Phase II
- 11.1.4. Phase III
- 11.1.5. Phase IV
- 11.2. Market Analysis, Insights and Forecast - by Service Provider
- 11.2.1. In-house
- 11.2.2. Contract Outsourcing
- 11.3. Market Analysis, Insights and Forecast - by Type of Reporting
- 11.3.1. Spontaneous Reporting
- 11.3.2. Intensified ADR Reporting
- 11.3.3. Targeted Spontaneous Reporting
- 11.3.4. Cohort Event Monitoring
- 11.3.5. EHR Mining
- 11.4. Market Analysis, Insights and Forecast - by End User
- 11.4.1. Hospitals
- 11.4.2. Pharmaceutical Companies
- 11.4.3. Other End Users
- 11.1. Market Analysis, Insights and Forecast - by Clinical Trial Phase
- 12. Competitive Analysis
- 12.1. Company Profiles
- 12.1.1 ArisGlobal
- 12.1.1.1. Company Overview
- 12.1.1.2. Products
- 12.1.1.3. Company Financials
- 12.1.1.4. SWOT Analysis
- 12.1.2 Laboratory Corporation of America Holdings
- 12.1.2.1. Company Overview
- 12.1.2.2. Products
- 12.1.2.3. Company Financials
- 12.1.2.4. SWOT Analysis
- 12.1.3 Cognizant
- 12.1.3.1. Company Overview
- 12.1.3.2. Products
- 12.1.3.3. Company Financials
- 12.1.3.4. SWOT Analysis
- 12.1.4 PAREXEL International Corporation
- 12.1.4.1. Company Overview
- 12.1.4.2. Products
- 12.1.4.3. Company Financials
- 12.1.4.4. SWOT Analysis
- 12.1.5 IBM Corporation
- 12.1.5.1. Company Overview
- 12.1.5.2. Products
- 12.1.5.3. Company Financials
- 12.1.5.4. SWOT Analysis
- 12.1.6 Wipro Ltd*List Not Exhaustive
- 12.1.6.1. Company Overview
- 12.1.6.2. Products
- 12.1.6.3. Company Financials
- 12.1.6.4. SWOT Analysis
- 12.1.7 ICON PLC
- 12.1.7.1. Company Overview
- 12.1.7.2. Products
- 12.1.7.3. Company Financials
- 12.1.7.4. SWOT Analysis
- 12.1.8 Accenture
- 12.1.8.1. Company Overview
- 12.1.8.2. Products
- 12.1.8.3. Company Financials
- 12.1.8.4. SWOT Analysis
- 12.1.9 BioClinica
- 12.1.9.1. Company Overview
- 12.1.9.2. Products
- 12.1.9.3. Company Financials
- 12.1.9.4. SWOT Analysis
- 12.1.10 Linical Accelovance
- 12.1.10.1. Company Overview
- 12.1.10.2. Products
- 12.1.10.3. Company Financials
- 12.1.10.4. SWOT Analysis
- 12.1.11 IQVIA
- 12.1.11.1. Company Overview
- 12.1.11.2. Products
- 12.1.11.3. Company Financials
- 12.1.11.4. SWOT Analysis
- 12.1.12 TAKE Solutions Ltd
- 12.1.12.1. Company Overview
- 12.1.12.2. Products
- 12.1.12.3. Company Financials
- 12.1.12.4. SWOT Analysis
- 12.1.13 ITClinical
- 12.1.13.1. Company Overview
- 12.1.13.2. Products
- 12.1.13.3. Company Financials
- 12.1.13.4. SWOT Analysis
- 12.1.14 Capgemini
- 12.1.14.1. Company Overview
- 12.1.14.2. Products
- 12.1.14.3. Company Financials
- 12.1.14.4. SWOT Analysis
- 12.1.15 United BioSource Corporation
- 12.1.15.1. Company Overview
- 12.1.15.2. Products
- 12.1.15.3. Company Financials
- 12.1.15.4. SWOT Analysis
- 12.1.1 ArisGlobal
- 12.2. Market Entropy
- 12.2.1 Company's Key Areas Served
- 12.2.2 Recent Developments
- 12.3. Company Market Share Analysis 2025
- 12.3.1 Top 5 Companies Market Share Analysis
- 12.3.2 Top 3 Companies Market Share Analysis
- 12.4. List of Potential Customers
- 13. Research Methodology
List of Figures
- Figure 1: Global Pharmacovigilance Market Revenue Breakdown (Billion, %) by Region 2025 & 2033
- Figure 2: North America Pharmacovigilance Market Revenue (Billion), by Clinical Trial Phase 2025 & 2033
- Figure 3: North America Pharmacovigilance Market Revenue Share (%), by Clinical Trial Phase 2025 & 2033
- Figure 4: North America Pharmacovigilance Market Revenue (Billion), by Service Provider 2025 & 2033
- Figure 5: North America Pharmacovigilance Market Revenue Share (%), by Service Provider 2025 & 2033
- Figure 6: North America Pharmacovigilance Market Revenue (Billion), by Type of Reporting 2025 & 2033
- Figure 7: North America Pharmacovigilance Market Revenue Share (%), by Type of Reporting 2025 & 2033
- Figure 8: North America Pharmacovigilance Market Revenue (Billion), by End User 2025 & 2033
- Figure 9: North America Pharmacovigilance Market Revenue Share (%), by End User 2025 & 2033
- Figure 10: North America Pharmacovigilance Market Revenue (Billion), by Country 2025 & 2033
- Figure 11: North America Pharmacovigilance Market Revenue Share (%), by Country 2025 & 2033
- Figure 12: Europe Pharmacovigilance Market Revenue (Billion), by Clinical Trial Phase 2025 & 2033
- Figure 13: Europe Pharmacovigilance Market Revenue Share (%), by Clinical Trial Phase 2025 & 2033
- Figure 14: Europe Pharmacovigilance Market Revenue (Billion), by Service Provider 2025 & 2033
- Figure 15: Europe Pharmacovigilance Market Revenue Share (%), by Service Provider 2025 & 2033
- Figure 16: Europe Pharmacovigilance Market Revenue (Billion), by Type of Reporting 2025 & 2033
- Figure 17: Europe Pharmacovigilance Market Revenue Share (%), by Type of Reporting 2025 & 2033
- Figure 18: Europe Pharmacovigilance Market Revenue (Billion), by End User 2025 & 2033
- Figure 19: Europe Pharmacovigilance Market Revenue Share (%), by End User 2025 & 2033
- Figure 20: Europe Pharmacovigilance Market Revenue (Billion), by Country 2025 & 2033
- Figure 21: Europe Pharmacovigilance Market Revenue Share (%), by Country 2025 & 2033
- Figure 22: Asia Pacific Pharmacovigilance Market Revenue (Billion), by Clinical Trial Phase 2025 & 2033
- Figure 23: Asia Pacific Pharmacovigilance Market Revenue Share (%), by Clinical Trial Phase 2025 & 2033
- Figure 24: Asia Pacific Pharmacovigilance Market Revenue (Billion), by Service Provider 2025 & 2033
- Figure 25: Asia Pacific Pharmacovigilance Market Revenue Share (%), by Service Provider 2025 & 2033
- Figure 26: Asia Pacific Pharmacovigilance Market Revenue (Billion), by Type of Reporting 2025 & 2033
- Figure 27: Asia Pacific Pharmacovigilance Market Revenue Share (%), by Type of Reporting 2025 & 2033
- Figure 28: Asia Pacific Pharmacovigilance Market Revenue (Billion), by End User 2025 & 2033
- Figure 29: Asia Pacific Pharmacovigilance Market Revenue Share (%), by End User 2025 & 2033
- Figure 30: Asia Pacific Pharmacovigilance Market Revenue (Billion), by Country 2025 & 2033
- Figure 31: Asia Pacific Pharmacovigilance Market Revenue Share (%), by Country 2025 & 2033
- Figure 32: Middle East and Africa Pharmacovigilance Market Revenue (Billion), by Clinical Trial Phase 2025 & 2033
- Figure 33: Middle East and Africa Pharmacovigilance Market Revenue Share (%), by Clinical Trial Phase 2025 & 2033
- Figure 34: Middle East and Africa Pharmacovigilance Market Revenue (Billion), by Service Provider 2025 & 2033
- Figure 35: Middle East and Africa Pharmacovigilance Market Revenue Share (%), by Service Provider 2025 & 2033
- Figure 36: Middle East and Africa Pharmacovigilance Market Revenue (Billion), by Type of Reporting 2025 & 2033
- Figure 37: Middle East and Africa Pharmacovigilance Market Revenue Share (%), by Type of Reporting 2025 & 2033
- Figure 38: Middle East and Africa Pharmacovigilance Market Revenue (Billion), by End User 2025 & 2033
- Figure 39: Middle East and Africa Pharmacovigilance Market Revenue Share (%), by End User 2025 & 2033
- Figure 40: Middle East and Africa Pharmacovigilance Market Revenue (Billion), by Country 2025 & 2033
- Figure 41: Middle East and Africa Pharmacovigilance Market Revenue Share (%), by Country 2025 & 2033
- Figure 42: South America Pharmacovigilance Market Revenue (Billion), by Clinical Trial Phase 2025 & 2033
- Figure 43: South America Pharmacovigilance Market Revenue Share (%), by Clinical Trial Phase 2025 & 2033
- Figure 44: South America Pharmacovigilance Market Revenue (Billion), by Service Provider 2025 & 2033
- Figure 45: South America Pharmacovigilance Market Revenue Share (%), by Service Provider 2025 & 2033
- Figure 46: South America Pharmacovigilance Market Revenue (Billion), by Type of Reporting 2025 & 2033
- Figure 47: South America Pharmacovigilance Market Revenue Share (%), by Type of Reporting 2025 & 2033
- Figure 48: South America Pharmacovigilance Market Revenue (Billion), by End User 2025 & 2033
- Figure 49: South America Pharmacovigilance Market Revenue Share (%), by End User 2025 & 2033
- Figure 50: South America Pharmacovigilance Market Revenue (Billion), by Country 2025 & 2033
- Figure 51: South America Pharmacovigilance Market Revenue Share (%), by Country 2025 & 2033
List of Tables
- Table 1: Global Pharmacovigilance Market Revenue Billion Forecast, by Clinical Trial Phase 2020 & 2033
- Table 2: Global Pharmacovigilance Market Revenue Billion Forecast, by Service Provider 2020 & 2033
- Table 3: Global Pharmacovigilance Market Revenue Billion Forecast, by Type of Reporting 2020 & 2033
- Table 4: Global Pharmacovigilance Market Revenue Billion Forecast, by End User 2020 & 2033
- Table 5: Global Pharmacovigilance Market Revenue Billion Forecast, by Region 2020 & 2033
- Table 6: Global Pharmacovigilance Market Revenue Billion Forecast, by Clinical Trial Phase 2020 & 2033
- Table 7: Global Pharmacovigilance Market Revenue Billion Forecast, by Service Provider 2020 & 2033
- Table 8: Global Pharmacovigilance Market Revenue Billion Forecast, by Type of Reporting 2020 & 2033
- Table 9: Global Pharmacovigilance Market Revenue Billion Forecast, by End User 2020 & 2033
- Table 10: Global Pharmacovigilance Market Revenue Billion Forecast, by Country 2020 & 2033
- Table 11: United States Pharmacovigilance Market Revenue (Billion) Forecast, by Application 2020 & 2033
- Table 12: Canada Pharmacovigilance Market Revenue (Billion) Forecast, by Application 2020 & 2033
- Table 13: Mexico Pharmacovigilance Market Revenue (Billion) Forecast, by Application 2020 & 2033
- Table 14: Global Pharmacovigilance Market Revenue Billion Forecast, by Clinical Trial Phase 2020 & 2033
- Table 15: Global Pharmacovigilance Market Revenue Billion Forecast, by Service Provider 2020 & 2033
- Table 16: Global Pharmacovigilance Market Revenue Billion Forecast, by Type of Reporting 2020 & 2033
- Table 17: Global Pharmacovigilance Market Revenue Billion Forecast, by End User 2020 & 2033
- Table 18: Global Pharmacovigilance Market Revenue Billion Forecast, by Country 2020 & 2033
- Table 19: Germany Pharmacovigilance Market Revenue (Billion) Forecast, by Application 2020 & 2033
- Table 20: United Kingdom Pharmacovigilance Market Revenue (Billion) Forecast, by Application 2020 & 2033
- Table 21: France Pharmacovigilance Market Revenue (Billion) Forecast, by Application 2020 & 2033
- Table 22: Italy Pharmacovigilance Market Revenue (Billion) Forecast, by Application 2020 & 2033
- Table 23: Spain Pharmacovigilance Market Revenue (Billion) Forecast, by Application 2020 & 2033
- Table 24: Rest of Europe Pharmacovigilance Market Revenue (Billion) Forecast, by Application 2020 & 2033
- Table 25: Global Pharmacovigilance Market Revenue Billion Forecast, by Clinical Trial Phase 2020 & 2033
- Table 26: Global Pharmacovigilance Market Revenue Billion Forecast, by Service Provider 2020 & 2033
- Table 27: Global Pharmacovigilance Market Revenue Billion Forecast, by Type of Reporting 2020 & 2033
- Table 28: Global Pharmacovigilance Market Revenue Billion Forecast, by End User 2020 & 2033
- Table 29: Global Pharmacovigilance Market Revenue Billion Forecast, by Country 2020 & 2033
- Table 30: China Pharmacovigilance Market Revenue (Billion) Forecast, by Application 2020 & 2033
- Table 31: Japan Pharmacovigilance Market Revenue (Billion) Forecast, by Application 2020 & 2033
- Table 32: India Pharmacovigilance Market Revenue (Billion) Forecast, by Application 2020 & 2033
- Table 33: Australia Pharmacovigilance Market Revenue (Billion) Forecast, by Application 2020 & 2033
- Table 34: South Korea Pharmacovigilance Market Revenue (Billion) Forecast, by Application 2020 & 2033
- Table 35: Rest of Asia Pacific Pharmacovigilance Market Revenue (Billion) Forecast, by Application 2020 & 2033
- Table 36: Global Pharmacovigilance Market Revenue Billion Forecast, by Clinical Trial Phase 2020 & 2033
- Table 37: Global Pharmacovigilance Market Revenue Billion Forecast, by Service Provider 2020 & 2033
- Table 38: Global Pharmacovigilance Market Revenue Billion Forecast, by Type of Reporting 2020 & 2033
- Table 39: Global Pharmacovigilance Market Revenue Billion Forecast, by End User 2020 & 2033
- Table 40: Global Pharmacovigilance Market Revenue Billion Forecast, by Country 2020 & 2033
- Table 41: GCC Pharmacovigilance Market Revenue (Billion) Forecast, by Application 2020 & 2033
- Table 42: South Africa Pharmacovigilance Market Revenue (Billion) Forecast, by Application 2020 & 2033
- Table 43: Rest of Middle East and Africa Pharmacovigilance Market Revenue (Billion) Forecast, by Application 2020 & 2033
- Table 44: Global Pharmacovigilance Market Revenue Billion Forecast, by Clinical Trial Phase 2020 & 2033
- Table 45: Global Pharmacovigilance Market Revenue Billion Forecast, by Service Provider 2020 & 2033
- Table 46: Global Pharmacovigilance Market Revenue Billion Forecast, by Type of Reporting 2020 & 2033
- Table 47: Global Pharmacovigilance Market Revenue Billion Forecast, by End User 2020 & 2033
- Table 48: Global Pharmacovigilance Market Revenue Billion Forecast, by Country 2020 & 2033
- Table 49: Brazil Pharmacovigilance Market Revenue (Billion) Forecast, by Application 2020 & 2033
- Table 50: Argentina Pharmacovigilance Market Revenue (Billion) Forecast, by Application 2020 & 2033
- Table 51: Rest of South America Pharmacovigilance Market Revenue (Billion) Forecast, by Application 2020 & 2033
Frequently Asked Questions
1. What is the projected Compound Annual Growth Rate (CAGR) of the Pharmacovigilance Market?
The projected CAGR is approximately 8.65%.
2. Which companies are prominent players in the Pharmacovigilance Market?
Key companies in the market include ArisGlobal, Laboratory Corporation of America Holdings, Cognizant, PAREXEL International Corporation, IBM Corporation, Wipro Ltd*List Not Exhaustive, ICON PLC, Accenture, BioClinica, Linical Accelovance, IQVIA, TAKE Solutions Ltd, ITClinical, Capgemini, United BioSource Corporation.
3. What are the main segments of the Pharmacovigilance Market?
The market segments include Clinical Trial Phase, Service Provider, Type of Reporting, End User.
4. Can you provide details about the market size?
The market size is estimated to be USD 7.23 Billion as of 2022.
5. What are some drivers contributing to market growth?
Increasing Drug Consumption and Drug Development Rates; Growing Incidence Rates of Adverse Drug Reaction and Drug Toxicity; Increasing Trend of Outsourcing Pharmacovigilance Services.
6. What are the notable trends driving market growth?
The Pharmaceutical Companies Segment is Expected to Hold a Major Market Share.
7. Are there any restraints impacting market growth?
High Risk Associated with Data Security; Lack of Global Regulatory Harmonization and Lack of Data Standardization for Adverse Event Collection.
8. Can you provide examples of recent developments in the market?
In February 2022, Cognizant entered into a partnership with Medable Inc. to jointly deliver clinical research solutions based on Medable's software-as-a-service platform for decentralized clinical trials.
9. What pricing options are available for accessing the report?
Pricing options include single-user, multi-user, and enterprise licenses priced at USD 4750, USD 5250, and USD 8750 respectively.
10. Is the market size provided in terms of value or volume?
The market size is provided in terms of value, measured in Billion.
11. Are there any specific market keywords associated with the report?
Yes, the market keyword associated with the report is "Pharmacovigilance Market," which aids in identifying and referencing the specific market segment covered.
12. How do I determine which pricing option suits my needs best?
The pricing options vary based on user requirements and access needs. Individual users may opt for single-user licenses, while businesses requiring broader access may choose multi-user or enterprise licenses for cost-effective access to the report.
13. Are there any additional resources or data provided in the Pharmacovigilance Market report?
While the report offers comprehensive insights, it's advisable to review the specific contents or supplementary materials provided to ascertain if additional resources or data are available.
14. How can I stay updated on further developments or reports in the Pharmacovigilance Market?
To stay informed about further developments, trends, and reports in the Pharmacovigilance Market, consider subscribing to industry newsletters, following relevant companies and organizations, or regularly checking reputable industry news sources and publications.
Methodology
Step 1 - Identification of Relevant Samples Size from Population Database


Step 2 - Approaches for Defining Global Market Size (Value, Volume* & Price*)

Note*: In applicable scenarios
Step 3 - Data Sources
Primary Research
- Web Analytics
- Survey Reports
- Research Institute
- Latest Research Reports
- Opinion Leaders
Secondary Research
- Annual Reports
- White Paper
- Latest Press Release
- Industry Association
- Paid Database
- Investor Presentations

Step 4 - Data Triangulation
Involves using different sources of information in order to increase the validity of a study
These sources are likely to be stakeholders in a program - participants, other researchers, program staff, other community members, and so on.
Then we put all data in single framework & apply various statistical tools to find out the dynamic on the market.
During the analysis stage, feedback from the stakeholder groups would be compared to determine areas of agreement as well as areas of divergence