
Key Insights
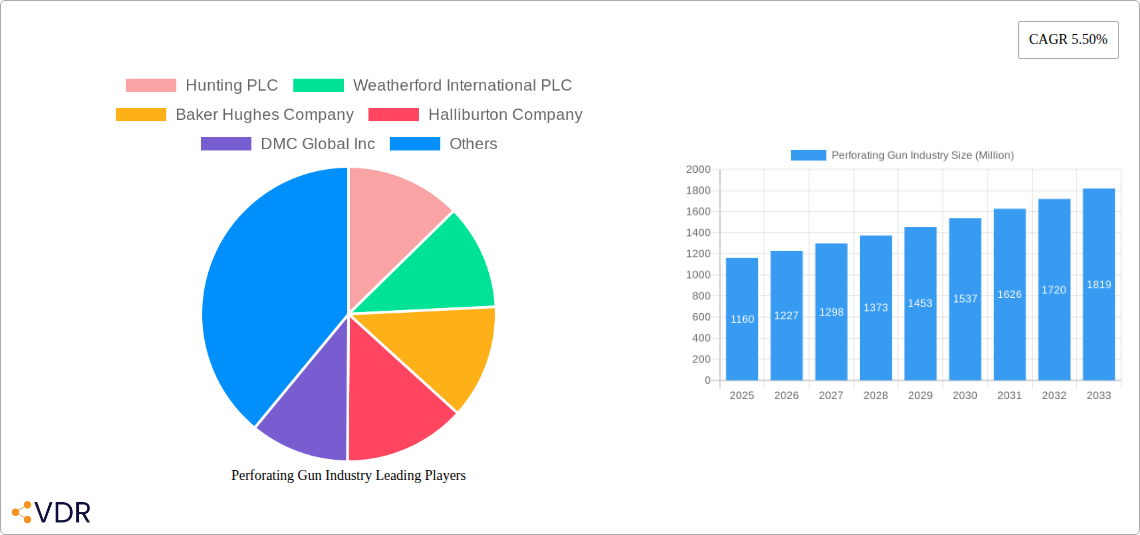
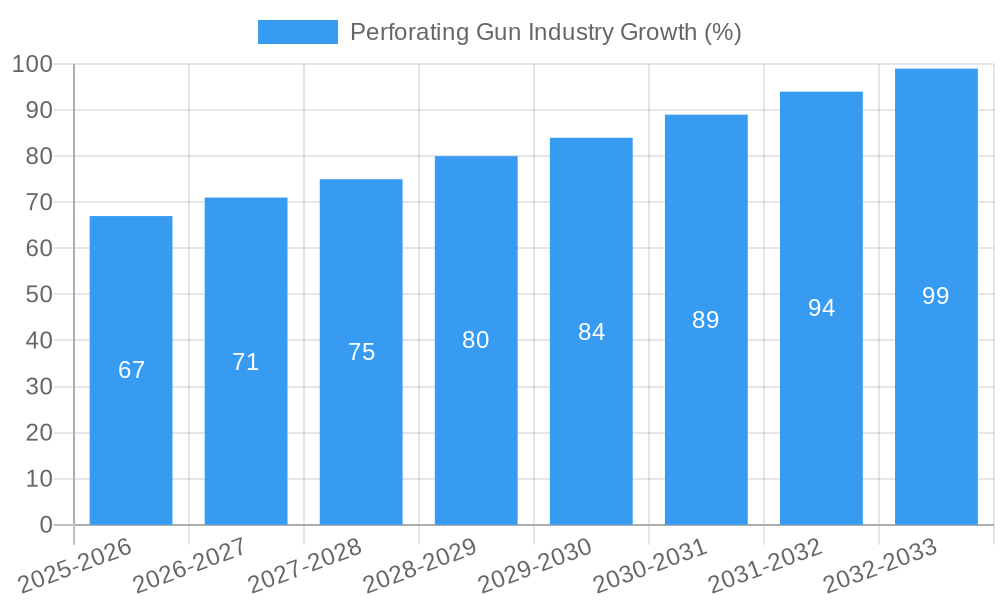
The global perforating gun market, valued at $1.16 billion in 2025, is projected to experience robust growth, driven by the increasing demand for oil and gas exploration and production. A compound annual growth rate (CAGR) of 5.50% is anticipated from 2025 to 2033, indicating a substantial market expansion. Several factors contribute to this growth. Firstly, the ongoing exploration and development of unconventional oil and gas resources, such as shale gas and tight oil, necessitate advanced perforating technologies for efficient well completion. Secondly, the continuous technological advancements in perforating gun designs, such as the development of expandable shaped charge guns offering increased penetration and accuracy, are enhancing market demand. Furthermore, the rising adoption of horizontal and deviated well drilling techniques further fuels the need for sophisticated perforating guns capable of precise placement and controlled perforation patterns in complex wellbores. However, price volatility in the oil and gas sector and stringent environmental regulations related to well completion operations pose challenges to market growth. The market is segmented by carrier type (hollow carrier, expandable shaped charge gun, others), explosive type (RDX, HMX, HNS), and well type (horizontal/deviated, vertical). Key players, including Hunting PLC, Weatherford International PLC, Baker Hughes Company, and Halliburton Company, are actively involved in developing innovative perforating gun technologies and expanding their market presence. Competition is expected to intensify as companies strive for technological differentiation and market share.
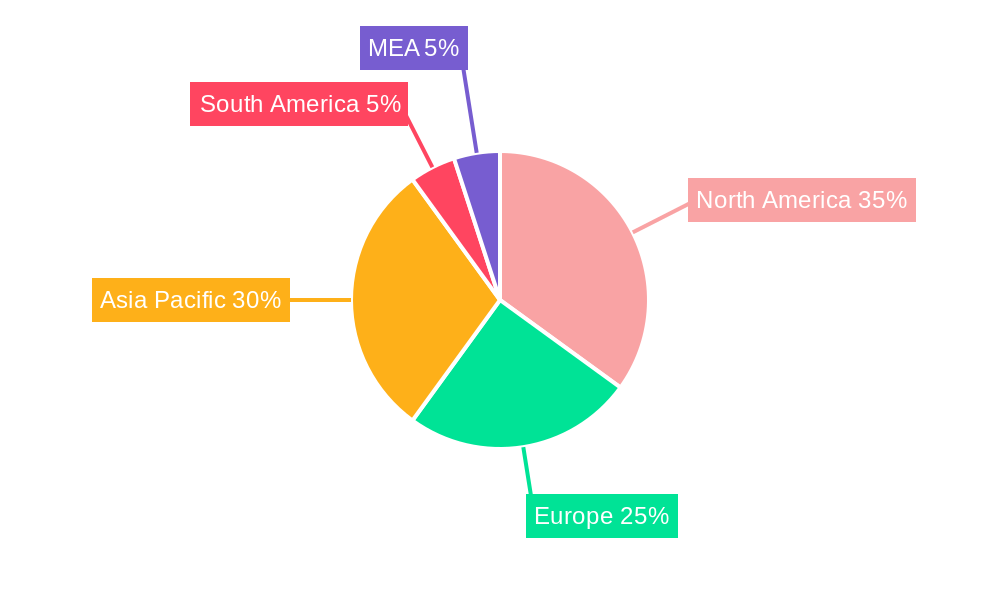
The geographical distribution of the market reveals significant regional variations. North America, driven by robust oil and gas activities in the United States and Canada, is anticipated to hold a substantial market share. However, the Asia-Pacific region, particularly China and India, is projected to witness rapid growth due to escalating energy demands and increasing investments in oil and gas infrastructure. Europe and the Middle East and Africa regions will also contribute to the overall market growth, although at a comparatively slower pace. The market's future will be shaped by factors including technological innovations, regulatory frameworks, and the overall price dynamics of the oil and gas industry. The continued investment in research and development of more efficient and environmentally friendly perforating technologies will be critical for sustaining the market's growth trajectory.
Perforating Gun Industry Market Report: 2019-2033
This comprehensive report provides an in-depth analysis of the Perforating Gun industry, encompassing market dynamics, growth trends, competitive landscape, and future outlook. The study period covers 2019-2033, with 2025 as the base and estimated year. This report is crucial for industry professionals, investors, and strategic decision-makers seeking to understand and capitalize on opportunities within this dynamic sector. The global Perforating Gun market is valued at xx Million Units in 2025 and is projected to reach xx Million Units by 2033, exhibiting a CAGR of xx% during the forecast period (2025-2033).
Perforating Gun Industry Market Dynamics & Structure
The Perforating Gun market is characterized by moderate concentration, with key players holding significant market share. Technological innovation, driven by the need for enhanced efficiency and reduced operational costs in oil and gas extraction, is a primary growth driver. Stringent regulatory frameworks governing safety and environmental impact influence market dynamics. Competitive substitutes are limited, with the primary alternatives being older, less efficient technologies. The end-user demographics are primarily oil and gas exploration and production companies, with varying needs based on well type and operational scale. M&A activity has been relatively moderate in recent years, with xx deals recorded between 2019 and 2024, representing a total value of xx Million Units.
- Market Concentration: Moderately concentrated, with the top 5 players holding approximately xx% of the market share in 2025.
- Technological Innovation: Focus on improving perforation efficiency, reducing operational time, and enhancing safety features.
- Regulatory Framework: Compliance with environmental regulations and safety standards is crucial.
- Competitive Substitutes: Limited, primarily older perforating gun technologies.
- M&A Activity: Moderate activity in recent years, with potential for increased consolidation in the future.
- Innovation Barriers: High R&D costs and stringent regulatory approvals pose challenges to new entrants.
Perforating Gun Industry Growth Trends & Insights
The Perforating Gun market has witnessed consistent growth over the historical period (2019-2024), fueled by increasing oil and gas exploration and production activities, particularly in unconventional resource development. Adoption rates have been steadily rising, driven by technological advancements leading to improved well productivity and reduced operational costs. Technological disruptions, such as the introduction of self-orienting guns and advanced explosive technologies, are reshaping the competitive landscape. Shifting consumer behavior towards improved efficiency and reduced environmental impact is also influencing market demand. The market size is expected to grow from xx Million Units in 2019 to xx Million Units in 2024.
- Market Size Evolution: Steady growth driven by rising oil and gas production.
- Adoption Rates: Increasing adoption due to improved efficiency and cost savings.
- Technological Disruptions: Introduction of self-orienting and advanced explosive technology.
- Consumer Behavior Shifts: Focus on efficiency, safety, and environmental responsibility.
Dominant Regions, Countries, or Segments in Perforating Gun Industry
North America (particularly the US) currently dominates the Perforating Gun market, driven by robust oil and gas exploration activities and a large number of well completions. The dominance is attributed to established industry infrastructure, technological advancements, and favorable government policies. However, regions like the Middle East and Asia Pacific are witnessing significant growth potential driven by investments in new oil and gas projects. Within segments, Expandable Shaped Charged Guns hold the largest market share due to their versatility and high efficiency. Horizontal and deviated wells account for the largest share of well type applications.
- North America: Largest market share due to high oil and gas production activity.
- Middle East & Asia Pacific: Significant growth potential driven by new projects.
- Expandable Shaped Charged Guns: Dominant segment due to high efficiency and versatility.
- Horizontal and Deviated Wells: Largest segment by well type.
- Key Drivers: Oil and gas exploration & production investments, government policies, and technological advancements.
Perforating Gun Industry Product Landscape
The Perforating Gun market offers a range of products categorized by carrier type (hollow carrier, expandable shaped charged gun, and other types), explosive type (RDX, HMX, HNS), and well type (horizontal/deviated, vertical). Innovations focus on improving perforation accuracy, increasing the number of perforations per shot, and enhancing overall well productivity. Key performance metrics include perforation density, penetration depth, and the efficiency of the explosive charge. Unique selling propositions often center on improved reliability, reduced operational time, and enhanced safety features. Recent advancements include self-orienting guns and those designed for specific well conditions.
Key Drivers, Barriers & Challenges in Perforating Gun Industry
Key Drivers:
- Increasing oil and gas exploration and production activities.
- Technological advancements leading to improved well productivity.
- Growing demand for efficient and safe well completion solutions.
Challenges and Restraints:
- Fluctuations in oil and gas prices impacting investment decisions.
- Stringent environmental regulations and safety standards.
- Intense competition among established players and potential new entrants. This results in a projected xx% reduction in average profit margins over the next 5 years.
- Supply chain disruptions causing material shortages and increased costs.
Emerging Opportunities in Perforating Gun Industry
- Development of more efficient and environmentally friendly explosives.
- Expansion into new markets, particularly in developing economies.
- Customization of perforating guns for specific well conditions.
- Increasing adoption of digital technologies for remote monitoring and data analysis.
Growth Accelerators in the Perforating Gun Industry
Technological breakthroughs in perforating gun design and explosive technology are key growth catalysts. Strategic partnerships between service providers and oil and gas operators will accelerate market expansion. Further expansion into unconventional resource development, particularly shale gas and tight oil reservoirs, will drive demand.
Key Players Shaping the Perforating Gun Industry Market
- Hunting PLC
- Weatherford International PLC
- Baker Hughes Company
- Halliburton Company
- DMC Global Inc
- Schlumberger Limited
- DynaEnergetics GmbH & Co KG
- NOV Inc
- Core Laboratories NV
- China Shaanxi FYPE Rigid Machinery Co Ltd
Notable Milestones in Perforating Gun Industry Sector
- July 2023: DynaEnergetics launches DS Gravity 2.0, a compact, self-orienting perforating gun.
- April 2023: VIGOR ships perforating guns to Southeast Asia for deployment in Malaysia, Indonesia, Vietnam, and Laos.
In-Depth Perforating Gun Industry Market Outlook
The Perforating Gun market is poised for continued growth, driven by technological innovation and expansion into new markets. Strategic partnerships and the development of more efficient and sustainable solutions will further accelerate market expansion. Opportunities exist for companies that can offer customized solutions, advanced digital technologies, and environmentally responsible products. The market's future potential is significant, presenting attractive opportunities for both established players and new entrants.
Perforating Gun Industry Segmentation
-
1. Carrier Type
- 1.1. Hollow Carrier
- 1.2. Expandable Shaped Charged Gun
- 1.3. Other Carrier Types
-
2. Explosive Type
- 2.1. Cyclotrimethylene Trinitramine (RDX)
- 2.2. Cyclotetramethylene Trinitramine (HMX)
- 2.3. Hexanitrosilbene (HNS)
-
3. Well Type
- 3.1. Horizontal and Deviated Well
- 3.2. Vertical Well
Perforating Gun Industry Segmentation By Geography
-
1. North America
- 1.1. United States
- 1.2. Canada
- 1.3. Rest of North America
-
2. Europe
- 2.1. Norway
- 2.2. United Kingdom
- 2.3. Russia
- 2.4. Rest of Europe
-
3. Asia Pacific
- 3.1. China
- 3.2. India
- 3.3. Indoensia
- 3.4. Malaysia
- 3.5. Rest of Asia Pacific
-
4. South America
- 4.1. Chile
- 4.2. Brazil
- 4.3. Argentina
- 4.4. Rest of South Africa
- 5. Middle East
-
6. United Arab Emirates
- 6.1. Saudi Arabia
- 6.2. South Afica
- 6.3. Egypt
- 6.4. Nigeria
- 6.5. Rest of Middle East
Perforating Gun Industry REPORT HIGHLIGHTS
| Aspects | Details |
|---|---|
| Study Period | 2019-2033 |
| Base Year | 2024 |
| Estimated Year | 2025 |
| Forecast Period | 2025-2033 |
| Historical Period | 2019-2024 |
| Growth Rate | CAGR of 5.50% from 2019-2033 |
| Segmentation |
|
Table of Contents
- 1. Introduction
- 1.1. Research Scope
- 1.2. Market Segmentation
- 1.3. Research Methodology
- 1.4. Definitions and Assumptions
- 2. Executive Summary
- 2.1. Introduction
- 3. Market Dynamics
- 3.1. Introduction
- 3.2. Market Drivers
- 3.2.1. 4.; Rise In Oil And Gas Drilling Activities And Associated Investments4.; Technological Developments In Perforating Gun Systems
- 3.3. Market Restrains
- 3.3.1. 4.; Increased Focus On Renewable Energy Technologies To Fulfill Rising Energy Demand
- 3.4. Market Trends
- 3.4.1. Horizontal and Deviated Well Segment to Dominate the Market
- 4. Market Factor Analysis
- 4.1. Porters Five Forces
- 4.2. Supply/Value Chain
- 4.3. PESTEL analysis
- 4.4. Market Entropy
- 4.5. Patent/Trademark Analysis
- 5. Global Perforating Gun Industry Analysis, Insights and Forecast, 2019-2031
- 5.1. Market Analysis, Insights and Forecast - by Carrier Type
- 5.1.1. Hollow Carrier
- 5.1.2. Expandable Shaped Charged Gun
- 5.1.3. Other Carrier Types
- 5.2. Market Analysis, Insights and Forecast - by Explosive Type
- 5.2.1. Cyclotrimethylene Trinitramine (RDX)
- 5.2.2. Cyclotetramethylene Trinitramine (HMX)
- 5.2.3. Hexanitrosilbene (HNS)
- 5.3. Market Analysis, Insights and Forecast - by Well Type
- 5.3.1. Horizontal and Deviated Well
- 5.3.2. Vertical Well
- 5.4. Market Analysis, Insights and Forecast - by Region
- 5.4.1. North America
- 5.4.2. Europe
- 5.4.3. Asia Pacific
- 5.4.4. South America
- 5.4.5. Middle East
- 5.4.6. United Arab Emirates
- 5.1. Market Analysis, Insights and Forecast - by Carrier Type
- 6. North America Perforating Gun Industry Analysis, Insights and Forecast, 2019-2031
- 6.1. Market Analysis, Insights and Forecast - by Carrier Type
- 6.1.1. Hollow Carrier
- 6.1.2. Expandable Shaped Charged Gun
- 6.1.3. Other Carrier Types
- 6.2. Market Analysis, Insights and Forecast - by Explosive Type
- 6.2.1. Cyclotrimethylene Trinitramine (RDX)
- 6.2.2. Cyclotetramethylene Trinitramine (HMX)
- 6.2.3. Hexanitrosilbene (HNS)
- 6.3. Market Analysis, Insights and Forecast - by Well Type
- 6.3.1. Horizontal and Deviated Well
- 6.3.2. Vertical Well
- 6.1. Market Analysis, Insights and Forecast - by Carrier Type
- 7. Europe Perforating Gun Industry Analysis, Insights and Forecast, 2019-2031
- 7.1. Market Analysis, Insights and Forecast - by Carrier Type
- 7.1.1. Hollow Carrier
- 7.1.2. Expandable Shaped Charged Gun
- 7.1.3. Other Carrier Types
- 7.2. Market Analysis, Insights and Forecast - by Explosive Type
- 7.2.1. Cyclotrimethylene Trinitramine (RDX)
- 7.2.2. Cyclotetramethylene Trinitramine (HMX)
- 7.2.3. Hexanitrosilbene (HNS)
- 7.3. Market Analysis, Insights and Forecast - by Well Type
- 7.3.1. Horizontal and Deviated Well
- 7.3.2. Vertical Well
- 7.1. Market Analysis, Insights and Forecast - by Carrier Type
- 8. Asia Pacific Perforating Gun Industry Analysis, Insights and Forecast, 2019-2031
- 8.1. Market Analysis, Insights and Forecast - by Carrier Type
- 8.1.1. Hollow Carrier
- 8.1.2. Expandable Shaped Charged Gun
- 8.1.3. Other Carrier Types
- 8.2. Market Analysis, Insights and Forecast - by Explosive Type
- 8.2.1. Cyclotrimethylene Trinitramine (RDX)
- 8.2.2. Cyclotetramethylene Trinitramine (HMX)
- 8.2.3. Hexanitrosilbene (HNS)
- 8.3. Market Analysis, Insights and Forecast - by Well Type
- 8.3.1. Horizontal and Deviated Well
- 8.3.2. Vertical Well
- 8.1. Market Analysis, Insights and Forecast - by Carrier Type
- 9. South America Perforating Gun Industry Analysis, Insights and Forecast, 2019-2031
- 9.1. Market Analysis, Insights and Forecast - by Carrier Type
- 9.1.1. Hollow Carrier
- 9.1.2. Expandable Shaped Charged Gun
- 9.1.3. Other Carrier Types
- 9.2. Market Analysis, Insights and Forecast - by Explosive Type
- 9.2.1. Cyclotrimethylene Trinitramine (RDX)
- 9.2.2. Cyclotetramethylene Trinitramine (HMX)
- 9.2.3. Hexanitrosilbene (HNS)
- 9.3. Market Analysis, Insights and Forecast - by Well Type
- 9.3.1. Horizontal and Deviated Well
- 9.3.2. Vertical Well
- 9.1. Market Analysis, Insights and Forecast - by Carrier Type
- 10. Middle East Perforating Gun Industry Analysis, Insights and Forecast, 2019-2031
- 10.1. Market Analysis, Insights and Forecast - by Carrier Type
- 10.1.1. Hollow Carrier
- 10.1.2. Expandable Shaped Charged Gun
- 10.1.3. Other Carrier Types
- 10.2. Market Analysis, Insights and Forecast - by Explosive Type
- 10.2.1. Cyclotrimethylene Trinitramine (RDX)
- 10.2.2. Cyclotetramethylene Trinitramine (HMX)
- 10.2.3. Hexanitrosilbene (HNS)
- 10.3. Market Analysis, Insights and Forecast - by Well Type
- 10.3.1. Horizontal and Deviated Well
- 10.3.2. Vertical Well
- 10.1. Market Analysis, Insights and Forecast - by Carrier Type
- 11. United Arab Emirates Perforating Gun Industry Analysis, Insights and Forecast, 2019-2031
- 11.1. Market Analysis, Insights and Forecast - by Carrier Type
- 11.1.1. Hollow Carrier
- 11.1.2. Expandable Shaped Charged Gun
- 11.1.3. Other Carrier Types
- 11.2. Market Analysis, Insights and Forecast - by Explosive Type
- 11.2.1. Cyclotrimethylene Trinitramine (RDX)
- 11.2.2. Cyclotetramethylene Trinitramine (HMX)
- 11.2.3. Hexanitrosilbene (HNS)
- 11.3. Market Analysis, Insights and Forecast - by Well Type
- 11.3.1. Horizontal and Deviated Well
- 11.3.2. Vertical Well
- 11.1. Market Analysis, Insights and Forecast - by Carrier Type
- 12. North America Perforating Gun Industry Analysis, Insights and Forecast, 2019-2031
- 12.1. Market Analysis, Insights and Forecast - By Country/Sub-region
- 12.1.1 United States
- 12.1.2 Canada
- 12.1.3 Mexico
- 13. Europe Perforating Gun Industry Analysis, Insights and Forecast, 2019-2031
- 13.1. Market Analysis, Insights and Forecast - By Country/Sub-region
- 13.1.1 Germany
- 13.1.2 United Kingdom
- 13.1.3 France
- 13.1.4 Spain
- 13.1.5 Italy
- 13.1.6 Spain
- 13.1.7 Belgium
- 13.1.8 Netherland
- 13.1.9 Nordics
- 13.1.10 Rest of Europe
- 14. Asia Pacific Perforating Gun Industry Analysis, Insights and Forecast, 2019-2031
- 14.1. Market Analysis, Insights and Forecast - By Country/Sub-region
- 14.1.1 China
- 14.1.2 Japan
- 14.1.3 India
- 14.1.4 South Korea
- 14.1.5 Southeast Asia
- 14.1.6 Australia
- 14.1.7 Indonesia
- 14.1.8 Phillipes
- 14.1.9 Singapore
- 14.1.10 Thailandc
- 14.1.11 Rest of Asia Pacific
- 15. South America Perforating Gun Industry Analysis, Insights and Forecast, 2019-2031
- 15.1. Market Analysis, Insights and Forecast - By Country/Sub-region
- 15.1.1 Brazil
- 15.1.2 Argentina
- 15.1.3 Peru
- 15.1.4 Chile
- 15.1.5 Colombia
- 15.1.6 Ecuador
- 15.1.7 Venezuela
- 15.1.8 Rest of South America
- 16. North America Perforating Gun Industry Analysis, Insights and Forecast, 2019-2031
- 16.1. Market Analysis, Insights and Forecast - By Country/Sub-region
- 16.1.1 United States
- 16.1.2 Canada
- 16.1.3 Mexico
- 17. MEA Perforating Gun Industry Analysis, Insights and Forecast, 2019-2031
- 17.1. Market Analysis, Insights and Forecast - By Country/Sub-region
- 17.1.1 United Arab Emirates
- 17.1.2 Saudi Arabia
- 17.1.3 South Africa
- 17.1.4 Rest of Middle East and Africa
- 18. Competitive Analysis
- 18.1. Global Market Share Analysis 2024
- 18.2. Company Profiles
- 18.2.1 Hunting PLC
- 18.2.1.1. Overview
- 18.2.1.2. Products
- 18.2.1.3. SWOT Analysis
- 18.2.1.4. Recent Developments
- 18.2.1.5. Financials (Based on Availability)
- 18.2.2 Weatherford International PLC
- 18.2.2.1. Overview
- 18.2.2.2. Products
- 18.2.2.3. SWOT Analysis
- 18.2.2.4. Recent Developments
- 18.2.2.5. Financials (Based on Availability)
- 18.2.3 Baker Hughes Company
- 18.2.3.1. Overview
- 18.2.3.2. Products
- 18.2.3.3. SWOT Analysis
- 18.2.3.4. Recent Developments
- 18.2.3.5. Financials (Based on Availability)
- 18.2.4 Halliburton Company
- 18.2.4.1. Overview
- 18.2.4.2. Products
- 18.2.4.3. SWOT Analysis
- 18.2.4.4. Recent Developments
- 18.2.4.5. Financials (Based on Availability)
- 18.2.5 DMC Global Inc
- 18.2.5.1. Overview
- 18.2.5.2. Products
- 18.2.5.3. SWOT Analysis
- 18.2.5.4. Recent Developments
- 18.2.5.5. Financials (Based on Availability)
- 18.2.6 Schlumberger Limited
- 18.2.6.1. Overview
- 18.2.6.2. Products
- 18.2.6.3. SWOT Analysis
- 18.2.6.4. Recent Developments
- 18.2.6.5. Financials (Based on Availability)
- 18.2.7 DynaEnergetics GmbH & Co KG
- 18.2.7.1. Overview
- 18.2.7.2. Products
- 18.2.7.3. SWOT Analysis
- 18.2.7.4. Recent Developments
- 18.2.7.5. Financials (Based on Availability)
- 18.2.8 NOV Inc
- 18.2.8.1. Overview
- 18.2.8.2. Products
- 18.2.8.3. SWOT Analysis
- 18.2.8.4. Recent Developments
- 18.2.8.5. Financials (Based on Availability)
- 18.2.9 Core Laboratories NV*List Not Exhaustive 6 4 Market Ranking/Share (%) Analysi
- 18.2.9.1. Overview
- 18.2.9.2. Products
- 18.2.9.3. SWOT Analysis
- 18.2.9.4. Recent Developments
- 18.2.9.5. Financials (Based on Availability)
- 18.2.10 China Shaanxi FYPE Rigid Machinery Co Ltd
- 18.2.10.1. Overview
- 18.2.10.2. Products
- 18.2.10.3. SWOT Analysis
- 18.2.10.4. Recent Developments
- 18.2.10.5. Financials (Based on Availability)
- 18.2.1 Hunting PLC
List of Figures
- Figure 1: Global Perforating Gun Industry Revenue Breakdown (Million, %) by Region 2024 & 2032
- Figure 2: Global Perforating Gun Industry Volume Breakdown (K Unit, %) by Region 2024 & 2032
- Figure 3: North America Perforating Gun Industry Revenue (Million), by Country 2024 & 2032
- Figure 4: North America Perforating Gun Industry Volume (K Unit), by Country 2024 & 2032
- Figure 5: North America Perforating Gun Industry Revenue Share (%), by Country 2024 & 2032
- Figure 6: North America Perforating Gun Industry Volume Share (%), by Country 2024 & 2032
- Figure 7: Europe Perforating Gun Industry Revenue (Million), by Country 2024 & 2032
- Figure 8: Europe Perforating Gun Industry Volume (K Unit), by Country 2024 & 2032
- Figure 9: Europe Perforating Gun Industry Revenue Share (%), by Country 2024 & 2032
- Figure 10: Europe Perforating Gun Industry Volume Share (%), by Country 2024 & 2032
- Figure 11: Asia Pacific Perforating Gun Industry Revenue (Million), by Country 2024 & 2032
- Figure 12: Asia Pacific Perforating Gun Industry Volume (K Unit), by Country 2024 & 2032
- Figure 13: Asia Pacific Perforating Gun Industry Revenue Share (%), by Country 2024 & 2032
- Figure 14: Asia Pacific Perforating Gun Industry Volume Share (%), by Country 2024 & 2032
- Figure 15: South America Perforating Gun Industry Revenue (Million), by Country 2024 & 2032
- Figure 16: South America Perforating Gun Industry Volume (K Unit), by Country 2024 & 2032
- Figure 17: South America Perforating Gun Industry Revenue Share (%), by Country 2024 & 2032
- Figure 18: South America Perforating Gun Industry Volume Share (%), by Country 2024 & 2032
- Figure 19: North America Perforating Gun Industry Revenue (Million), by Country 2024 & 2032
- Figure 20: North America Perforating Gun Industry Volume (K Unit), by Country 2024 & 2032
- Figure 21: North America Perforating Gun Industry Revenue Share (%), by Country 2024 & 2032
- Figure 22: North America Perforating Gun Industry Volume Share (%), by Country 2024 & 2032
- Figure 23: MEA Perforating Gun Industry Revenue (Million), by Country 2024 & 2032
- Figure 24: MEA Perforating Gun Industry Volume (K Unit), by Country 2024 & 2032
- Figure 25: MEA Perforating Gun Industry Revenue Share (%), by Country 2024 & 2032
- Figure 26: MEA Perforating Gun Industry Volume Share (%), by Country 2024 & 2032
- Figure 27: North America Perforating Gun Industry Revenue (Million), by Carrier Type 2024 & 2032
- Figure 28: North America Perforating Gun Industry Volume (K Unit), by Carrier Type 2024 & 2032
- Figure 29: North America Perforating Gun Industry Revenue Share (%), by Carrier Type 2024 & 2032
- Figure 30: North America Perforating Gun Industry Volume Share (%), by Carrier Type 2024 & 2032
- Figure 31: North America Perforating Gun Industry Revenue (Million), by Explosive Type 2024 & 2032
- Figure 32: North America Perforating Gun Industry Volume (K Unit), by Explosive Type 2024 & 2032
- Figure 33: North America Perforating Gun Industry Revenue Share (%), by Explosive Type 2024 & 2032
- Figure 34: North America Perforating Gun Industry Volume Share (%), by Explosive Type 2024 & 2032
- Figure 35: North America Perforating Gun Industry Revenue (Million), by Well Type 2024 & 2032
- Figure 36: North America Perforating Gun Industry Volume (K Unit), by Well Type 2024 & 2032
- Figure 37: North America Perforating Gun Industry Revenue Share (%), by Well Type 2024 & 2032
- Figure 38: North America Perforating Gun Industry Volume Share (%), by Well Type 2024 & 2032
- Figure 39: North America Perforating Gun Industry Revenue (Million), by Country 2024 & 2032
- Figure 40: North America Perforating Gun Industry Volume (K Unit), by Country 2024 & 2032
- Figure 41: North America Perforating Gun Industry Revenue Share (%), by Country 2024 & 2032
- Figure 42: North America Perforating Gun Industry Volume Share (%), by Country 2024 & 2032
- Figure 43: Europe Perforating Gun Industry Revenue (Million), by Carrier Type 2024 & 2032
- Figure 44: Europe Perforating Gun Industry Volume (K Unit), by Carrier Type 2024 & 2032
- Figure 45: Europe Perforating Gun Industry Revenue Share (%), by Carrier Type 2024 & 2032
- Figure 46: Europe Perforating Gun Industry Volume Share (%), by Carrier Type 2024 & 2032
- Figure 47: Europe Perforating Gun Industry Revenue (Million), by Explosive Type 2024 & 2032
- Figure 48: Europe Perforating Gun Industry Volume (K Unit), by Explosive Type 2024 & 2032
- Figure 49: Europe Perforating Gun Industry Revenue Share (%), by Explosive Type 2024 & 2032
- Figure 50: Europe Perforating Gun Industry Volume Share (%), by Explosive Type 2024 & 2032
- Figure 51: Europe Perforating Gun Industry Revenue (Million), by Well Type 2024 & 2032
- Figure 52: Europe Perforating Gun Industry Volume (K Unit), by Well Type 2024 & 2032
- Figure 53: Europe Perforating Gun Industry Revenue Share (%), by Well Type 2024 & 2032
- Figure 54: Europe Perforating Gun Industry Volume Share (%), by Well Type 2024 & 2032
- Figure 55: Europe Perforating Gun Industry Revenue (Million), by Country 2024 & 2032
- Figure 56: Europe Perforating Gun Industry Volume (K Unit), by Country 2024 & 2032
- Figure 57: Europe Perforating Gun Industry Revenue Share (%), by Country 2024 & 2032
- Figure 58: Europe Perforating Gun Industry Volume Share (%), by Country 2024 & 2032
- Figure 59: Asia Pacific Perforating Gun Industry Revenue (Million), by Carrier Type 2024 & 2032
- Figure 60: Asia Pacific Perforating Gun Industry Volume (K Unit), by Carrier Type 2024 & 2032
- Figure 61: Asia Pacific Perforating Gun Industry Revenue Share (%), by Carrier Type 2024 & 2032
- Figure 62: Asia Pacific Perforating Gun Industry Volume Share (%), by Carrier Type 2024 & 2032
- Figure 63: Asia Pacific Perforating Gun Industry Revenue (Million), by Explosive Type 2024 & 2032
- Figure 64: Asia Pacific Perforating Gun Industry Volume (K Unit), by Explosive Type 2024 & 2032
- Figure 65: Asia Pacific Perforating Gun Industry Revenue Share (%), by Explosive Type 2024 & 2032
- Figure 66: Asia Pacific Perforating Gun Industry Volume Share (%), by Explosive Type 2024 & 2032
- Figure 67: Asia Pacific Perforating Gun Industry Revenue (Million), by Well Type 2024 & 2032
- Figure 68: Asia Pacific Perforating Gun Industry Volume (K Unit), by Well Type 2024 & 2032
- Figure 69: Asia Pacific Perforating Gun Industry Revenue Share (%), by Well Type 2024 & 2032
- Figure 70: Asia Pacific Perforating Gun Industry Volume Share (%), by Well Type 2024 & 2032
- Figure 71: Asia Pacific Perforating Gun Industry Revenue (Million), by Country 2024 & 2032
- Figure 72: Asia Pacific Perforating Gun Industry Volume (K Unit), by Country 2024 & 2032
- Figure 73: Asia Pacific Perforating Gun Industry Revenue Share (%), by Country 2024 & 2032
- Figure 74: Asia Pacific Perforating Gun Industry Volume Share (%), by Country 2024 & 2032
- Figure 75: South America Perforating Gun Industry Revenue (Million), by Carrier Type 2024 & 2032
- Figure 76: South America Perforating Gun Industry Volume (K Unit), by Carrier Type 2024 & 2032
- Figure 77: South America Perforating Gun Industry Revenue Share (%), by Carrier Type 2024 & 2032
- Figure 78: South America Perforating Gun Industry Volume Share (%), by Carrier Type 2024 & 2032
- Figure 79: South America Perforating Gun Industry Revenue (Million), by Explosive Type 2024 & 2032
- Figure 80: South America Perforating Gun Industry Volume (K Unit), by Explosive Type 2024 & 2032
- Figure 81: South America Perforating Gun Industry Revenue Share (%), by Explosive Type 2024 & 2032
- Figure 82: South America Perforating Gun Industry Volume Share (%), by Explosive Type 2024 & 2032
- Figure 83: South America Perforating Gun Industry Revenue (Million), by Well Type 2024 & 2032
- Figure 84: South America Perforating Gun Industry Volume (K Unit), by Well Type 2024 & 2032
- Figure 85: South America Perforating Gun Industry Revenue Share (%), by Well Type 2024 & 2032
- Figure 86: South America Perforating Gun Industry Volume Share (%), by Well Type 2024 & 2032
- Figure 87: South America Perforating Gun Industry Revenue (Million), by Country 2024 & 2032
- Figure 88: South America Perforating Gun Industry Volume (K Unit), by Country 2024 & 2032
- Figure 89: South America Perforating Gun Industry Revenue Share (%), by Country 2024 & 2032
- Figure 90: South America Perforating Gun Industry Volume Share (%), by Country 2024 & 2032
- Figure 91: Middle East Perforating Gun Industry Revenue (Million), by Carrier Type 2024 & 2032
- Figure 92: Middle East Perforating Gun Industry Volume (K Unit), by Carrier Type 2024 & 2032
- Figure 93: Middle East Perforating Gun Industry Revenue Share (%), by Carrier Type 2024 & 2032
- Figure 94: Middle East Perforating Gun Industry Volume Share (%), by Carrier Type 2024 & 2032
- Figure 95: Middle East Perforating Gun Industry Revenue (Million), by Explosive Type 2024 & 2032
- Figure 96: Middle East Perforating Gun Industry Volume (K Unit), by Explosive Type 2024 & 2032
- Figure 97: Middle East Perforating Gun Industry Revenue Share (%), by Explosive Type 2024 & 2032
- Figure 98: Middle East Perforating Gun Industry Volume Share (%), by Explosive Type 2024 & 2032
- Figure 99: Middle East Perforating Gun Industry Revenue (Million), by Well Type 2024 & 2032
- Figure 100: Middle East Perforating Gun Industry Volume (K Unit), by Well Type 2024 & 2032
- Figure 101: Middle East Perforating Gun Industry Revenue Share (%), by Well Type 2024 & 2032
- Figure 102: Middle East Perforating Gun Industry Volume Share (%), by Well Type 2024 & 2032
- Figure 103: Middle East Perforating Gun Industry Revenue (Million), by Country 2024 & 2032
- Figure 104: Middle East Perforating Gun Industry Volume (K Unit), by Country 2024 & 2032
- Figure 105: Middle East Perforating Gun Industry Revenue Share (%), by Country 2024 & 2032
- Figure 106: Middle East Perforating Gun Industry Volume Share (%), by Country 2024 & 2032
- Figure 107: United Arab Emirates Perforating Gun Industry Revenue (Million), by Carrier Type 2024 & 2032
- Figure 108: United Arab Emirates Perforating Gun Industry Volume (K Unit), by Carrier Type 2024 & 2032
- Figure 109: United Arab Emirates Perforating Gun Industry Revenue Share (%), by Carrier Type 2024 & 2032
- Figure 110: United Arab Emirates Perforating Gun Industry Volume Share (%), by Carrier Type 2024 & 2032
- Figure 111: United Arab Emirates Perforating Gun Industry Revenue (Million), by Explosive Type 2024 & 2032
- Figure 112: United Arab Emirates Perforating Gun Industry Volume (K Unit), by Explosive Type 2024 & 2032
- Figure 113: United Arab Emirates Perforating Gun Industry Revenue Share (%), by Explosive Type 2024 & 2032
- Figure 114: United Arab Emirates Perforating Gun Industry Volume Share (%), by Explosive Type 2024 & 2032
- Figure 115: United Arab Emirates Perforating Gun Industry Revenue (Million), by Well Type 2024 & 2032
- Figure 116: United Arab Emirates Perforating Gun Industry Volume (K Unit), by Well Type 2024 & 2032
- Figure 117: United Arab Emirates Perforating Gun Industry Revenue Share (%), by Well Type 2024 & 2032
- Figure 118: United Arab Emirates Perforating Gun Industry Volume Share (%), by Well Type 2024 & 2032
- Figure 119: United Arab Emirates Perforating Gun Industry Revenue (Million), by Country 2024 & 2032
- Figure 120: United Arab Emirates Perforating Gun Industry Volume (K Unit), by Country 2024 & 2032
- Figure 121: United Arab Emirates Perforating Gun Industry Revenue Share (%), by Country 2024 & 2032
- Figure 122: United Arab Emirates Perforating Gun Industry Volume Share (%), by Country 2024 & 2032
List of Tables
- Table 1: Global Perforating Gun Industry Revenue Million Forecast, by Region 2019 & 2032
- Table 2: Global Perforating Gun Industry Volume K Unit Forecast, by Region 2019 & 2032
- Table 3: Global Perforating Gun Industry Revenue Million Forecast, by Carrier Type 2019 & 2032
- Table 4: Global Perforating Gun Industry Volume K Unit Forecast, by Carrier Type 2019 & 2032
- Table 5: Global Perforating Gun Industry Revenue Million Forecast, by Explosive Type 2019 & 2032
- Table 6: Global Perforating Gun Industry Volume K Unit Forecast, by Explosive Type 2019 & 2032
- Table 7: Global Perforating Gun Industry Revenue Million Forecast, by Well Type 2019 & 2032
- Table 8: Global Perforating Gun Industry Volume K Unit Forecast, by Well Type 2019 & 2032
- Table 9: Global Perforating Gun Industry Revenue Million Forecast, by Region 2019 & 2032
- Table 10: Global Perforating Gun Industry Volume K Unit Forecast, by Region 2019 & 2032
- Table 11: Global Perforating Gun Industry Revenue Million Forecast, by Country 2019 & 2032
- Table 12: Global Perforating Gun Industry Volume K Unit Forecast, by Country 2019 & 2032
- Table 13: United States Perforating Gun Industry Revenue (Million) Forecast, by Application 2019 & 2032
- Table 14: United States Perforating Gun Industry Volume (K Unit) Forecast, by Application 2019 & 2032
- Table 15: Canada Perforating Gun Industry Revenue (Million) Forecast, by Application 2019 & 2032
- Table 16: Canada Perforating Gun Industry Volume (K Unit) Forecast, by Application 2019 & 2032
- Table 17: Mexico Perforating Gun Industry Revenue (Million) Forecast, by Application 2019 & 2032
- Table 18: Mexico Perforating Gun Industry Volume (K Unit) Forecast, by Application 2019 & 2032
- Table 19: Global Perforating Gun Industry Revenue Million Forecast, by Country 2019 & 2032
- Table 20: Global Perforating Gun Industry Volume K Unit Forecast, by Country 2019 & 2032
- Table 21: Germany Perforating Gun Industry Revenue (Million) Forecast, by Application 2019 & 2032
- Table 22: Germany Perforating Gun Industry Volume (K Unit) Forecast, by Application 2019 & 2032
- Table 23: United Kingdom Perforating Gun Industry Revenue (Million) Forecast, by Application 2019 & 2032
- Table 24: United Kingdom Perforating Gun Industry Volume (K Unit) Forecast, by Application 2019 & 2032
- Table 25: France Perforating Gun Industry Revenue (Million) Forecast, by Application 2019 & 2032
- Table 26: France Perforating Gun Industry Volume (K Unit) Forecast, by Application 2019 & 2032
- Table 27: Spain Perforating Gun Industry Revenue (Million) Forecast, by Application 2019 & 2032
- Table 28: Spain Perforating Gun Industry Volume (K Unit) Forecast, by Application 2019 & 2032
- Table 29: Italy Perforating Gun Industry Revenue (Million) Forecast, by Application 2019 & 2032
- Table 30: Italy Perforating Gun Industry Volume (K Unit) Forecast, by Application 2019 & 2032
- Table 31: Spain Perforating Gun Industry Revenue (Million) Forecast, by Application 2019 & 2032
- Table 32: Spain Perforating Gun Industry Volume (K Unit) Forecast, by Application 2019 & 2032
- Table 33: Belgium Perforating Gun Industry Revenue (Million) Forecast, by Application 2019 & 2032
- Table 34: Belgium Perforating Gun Industry Volume (K Unit) Forecast, by Application 2019 & 2032
- Table 35: Netherland Perforating Gun Industry Revenue (Million) Forecast, by Application 2019 & 2032
- Table 36: Netherland Perforating Gun Industry Volume (K Unit) Forecast, by Application 2019 & 2032
- Table 37: Nordics Perforating Gun Industry Revenue (Million) Forecast, by Application 2019 & 2032
- Table 38: Nordics Perforating Gun Industry Volume (K Unit) Forecast, by Application 2019 & 2032
- Table 39: Rest of Europe Perforating Gun Industry Revenue (Million) Forecast, by Application 2019 & 2032
- Table 40: Rest of Europe Perforating Gun Industry Volume (K Unit) Forecast, by Application 2019 & 2032
- Table 41: Global Perforating Gun Industry Revenue Million Forecast, by Country 2019 & 2032
- Table 42: Global Perforating Gun Industry Volume K Unit Forecast, by Country 2019 & 2032
- Table 43: China Perforating Gun Industry Revenue (Million) Forecast, by Application 2019 & 2032
- Table 44: China Perforating Gun Industry Volume (K Unit) Forecast, by Application 2019 & 2032
- Table 45: Japan Perforating Gun Industry Revenue (Million) Forecast, by Application 2019 & 2032
- Table 46: Japan Perforating Gun Industry Volume (K Unit) Forecast, by Application 2019 & 2032
- Table 47: India Perforating Gun Industry Revenue (Million) Forecast, by Application 2019 & 2032
- Table 48: India Perforating Gun Industry Volume (K Unit) Forecast, by Application 2019 & 2032
- Table 49: South Korea Perforating Gun Industry Revenue (Million) Forecast, by Application 2019 & 2032
- Table 50: South Korea Perforating Gun Industry Volume (K Unit) Forecast, by Application 2019 & 2032
- Table 51: Southeast Asia Perforating Gun Industry Revenue (Million) Forecast, by Application 2019 & 2032
- Table 52: Southeast Asia Perforating Gun Industry Volume (K Unit) Forecast, by Application 2019 & 2032
- Table 53: Australia Perforating Gun Industry Revenue (Million) Forecast, by Application 2019 & 2032
- Table 54: Australia Perforating Gun Industry Volume (K Unit) Forecast, by Application 2019 & 2032
- Table 55: Indonesia Perforating Gun Industry Revenue (Million) Forecast, by Application 2019 & 2032
- Table 56: Indonesia Perforating Gun Industry Volume (K Unit) Forecast, by Application 2019 & 2032
- Table 57: Phillipes Perforating Gun Industry Revenue (Million) Forecast, by Application 2019 & 2032
- Table 58: Phillipes Perforating Gun Industry Volume (K Unit) Forecast, by Application 2019 & 2032
- Table 59: Singapore Perforating Gun Industry Revenue (Million) Forecast, by Application 2019 & 2032
- Table 60: Singapore Perforating Gun Industry Volume (K Unit) Forecast, by Application 2019 & 2032
- Table 61: Thailandc Perforating Gun Industry Revenue (Million) Forecast, by Application 2019 & 2032
- Table 62: Thailandc Perforating Gun Industry Volume (K Unit) Forecast, by Application 2019 & 2032
- Table 63: Rest of Asia Pacific Perforating Gun Industry Revenue (Million) Forecast, by Application 2019 & 2032
- Table 64: Rest of Asia Pacific Perforating Gun Industry Volume (K Unit) Forecast, by Application 2019 & 2032
- Table 65: Global Perforating Gun Industry Revenue Million Forecast, by Country 2019 & 2032
- Table 66: Global Perforating Gun Industry Volume K Unit Forecast, by Country 2019 & 2032
- Table 67: Brazil Perforating Gun Industry Revenue (Million) Forecast, by Application 2019 & 2032
- Table 68: Brazil Perforating Gun Industry Volume (K Unit) Forecast, by Application 2019 & 2032
- Table 69: Argentina Perforating Gun Industry Revenue (Million) Forecast, by Application 2019 & 2032
- Table 70: Argentina Perforating Gun Industry Volume (K Unit) Forecast, by Application 2019 & 2032
- Table 71: Peru Perforating Gun Industry Revenue (Million) Forecast, by Application 2019 & 2032
- Table 72: Peru Perforating Gun Industry Volume (K Unit) Forecast, by Application 2019 & 2032
- Table 73: Chile Perforating Gun Industry Revenue (Million) Forecast, by Application 2019 & 2032
- Table 74: Chile Perforating Gun Industry Volume (K Unit) Forecast, by Application 2019 & 2032
- Table 75: Colombia Perforating Gun Industry Revenue (Million) Forecast, by Application 2019 & 2032
- Table 76: Colombia Perforating Gun Industry Volume (K Unit) Forecast, by Application 2019 & 2032
- Table 77: Ecuador Perforating Gun Industry Revenue (Million) Forecast, by Application 2019 & 2032
- Table 78: Ecuador Perforating Gun Industry Volume (K Unit) Forecast, by Application 2019 & 2032
- Table 79: Venezuela Perforating Gun Industry Revenue (Million) Forecast, by Application 2019 & 2032
- Table 80: Venezuela Perforating Gun Industry Volume (K Unit) Forecast, by Application 2019 & 2032
- Table 81: Rest of South America Perforating Gun Industry Revenue (Million) Forecast, by Application 2019 & 2032
- Table 82: Rest of South America Perforating Gun Industry Volume (K Unit) Forecast, by Application 2019 & 2032
- Table 83: Global Perforating Gun Industry Revenue Million Forecast, by Country 2019 & 2032
- Table 84: Global Perforating Gun Industry Volume K Unit Forecast, by Country 2019 & 2032
- Table 85: United States Perforating Gun Industry Revenue (Million) Forecast, by Application 2019 & 2032
- Table 86: United States Perforating Gun Industry Volume (K Unit) Forecast, by Application 2019 & 2032
- Table 87: Canada Perforating Gun Industry Revenue (Million) Forecast, by Application 2019 & 2032
- Table 88: Canada Perforating Gun Industry Volume (K Unit) Forecast, by Application 2019 & 2032
- Table 89: Mexico Perforating Gun Industry Revenue (Million) Forecast, by Application 2019 & 2032
- Table 90: Mexico Perforating Gun Industry Volume (K Unit) Forecast, by Application 2019 & 2032
- Table 91: Global Perforating Gun Industry Revenue Million Forecast, by Country 2019 & 2032
- Table 92: Global Perforating Gun Industry Volume K Unit Forecast, by Country 2019 & 2032
- Table 93: United Arab Emirates Perforating Gun Industry Revenue (Million) Forecast, by Application 2019 & 2032
- Table 94: United Arab Emirates Perforating Gun Industry Volume (K Unit) Forecast, by Application 2019 & 2032
- Table 95: Saudi Arabia Perforating Gun Industry Revenue (Million) Forecast, by Application 2019 & 2032
- Table 96: Saudi Arabia Perforating Gun Industry Volume (K Unit) Forecast, by Application 2019 & 2032
- Table 97: South Africa Perforating Gun Industry Revenue (Million) Forecast, by Application 2019 & 2032
- Table 98: South Africa Perforating Gun Industry Volume (K Unit) Forecast, by Application 2019 & 2032
- Table 99: Rest of Middle East and Africa Perforating Gun Industry Revenue (Million) Forecast, by Application 2019 & 2032
- Table 100: Rest of Middle East and Africa Perforating Gun Industry Volume (K Unit) Forecast, by Application 2019 & 2032
- Table 101: Global Perforating Gun Industry Revenue Million Forecast, by Carrier Type 2019 & 2032
- Table 102: Global Perforating Gun Industry Volume K Unit Forecast, by Carrier Type 2019 & 2032
- Table 103: Global Perforating Gun Industry Revenue Million Forecast, by Explosive Type 2019 & 2032
- Table 104: Global Perforating Gun Industry Volume K Unit Forecast, by Explosive Type 2019 & 2032
- Table 105: Global Perforating Gun Industry Revenue Million Forecast, by Well Type 2019 & 2032
- Table 106: Global Perforating Gun Industry Volume K Unit Forecast, by Well Type 2019 & 2032
- Table 107: Global Perforating Gun Industry Revenue Million Forecast, by Country 2019 & 2032
- Table 108: Global Perforating Gun Industry Volume K Unit Forecast, by Country 2019 & 2032
- Table 109: United States Perforating Gun Industry Revenue (Million) Forecast, by Application 2019 & 2032
- Table 110: United States Perforating Gun Industry Volume (K Unit) Forecast, by Application 2019 & 2032
- Table 111: Canada Perforating Gun Industry Revenue (Million) Forecast, by Application 2019 & 2032
- Table 112: Canada Perforating Gun Industry Volume (K Unit) Forecast, by Application 2019 & 2032
- Table 113: Rest of North America Perforating Gun Industry Revenue (Million) Forecast, by Application 2019 & 2032
- Table 114: Rest of North America Perforating Gun Industry Volume (K Unit) Forecast, by Application 2019 & 2032
- Table 115: Global Perforating Gun Industry Revenue Million Forecast, by Carrier Type 2019 & 2032
- Table 116: Global Perforating Gun Industry Volume K Unit Forecast, by Carrier Type 2019 & 2032
- Table 117: Global Perforating Gun Industry Revenue Million Forecast, by Explosive Type 2019 & 2032
- Table 118: Global Perforating Gun Industry Volume K Unit Forecast, by Explosive Type 2019 & 2032
- Table 119: Global Perforating Gun Industry Revenue Million Forecast, by Well Type 2019 & 2032
- Table 120: Global Perforating Gun Industry Volume K Unit Forecast, by Well Type 2019 & 2032
- Table 121: Global Perforating Gun Industry Revenue Million Forecast, by Country 2019 & 2032
- Table 122: Global Perforating Gun Industry Volume K Unit Forecast, by Country 2019 & 2032
- Table 123: Norway Perforating Gun Industry Revenue (Million) Forecast, by Application 2019 & 2032
- Table 124: Norway Perforating Gun Industry Volume (K Unit) Forecast, by Application 2019 & 2032
- Table 125: United Kingdom Perforating Gun Industry Revenue (Million) Forecast, by Application 2019 & 2032
- Table 126: United Kingdom Perforating Gun Industry Volume (K Unit) Forecast, by Application 2019 & 2032
- Table 127: Russia Perforating Gun Industry Revenue (Million) Forecast, by Application 2019 & 2032
- Table 128: Russia Perforating Gun Industry Volume (K Unit) Forecast, by Application 2019 & 2032
- Table 129: Rest of Europe Perforating Gun Industry Revenue (Million) Forecast, by Application 2019 & 2032
- Table 130: Rest of Europe Perforating Gun Industry Volume (K Unit) Forecast, by Application 2019 & 2032
- Table 131: Global Perforating Gun Industry Revenue Million Forecast, by Carrier Type 2019 & 2032
- Table 132: Global Perforating Gun Industry Volume K Unit Forecast, by Carrier Type 2019 & 2032
- Table 133: Global Perforating Gun Industry Revenue Million Forecast, by Explosive Type 2019 & 2032
- Table 134: Global Perforating Gun Industry Volume K Unit Forecast, by Explosive Type 2019 & 2032
- Table 135: Global Perforating Gun Industry Revenue Million Forecast, by Well Type 2019 & 2032
- Table 136: Global Perforating Gun Industry Volume K Unit Forecast, by Well Type 2019 & 2032
- Table 137: Global Perforating Gun Industry Revenue Million Forecast, by Country 2019 & 2032
- Table 138: Global Perforating Gun Industry Volume K Unit Forecast, by Country 2019 & 2032
- Table 139: China Perforating Gun Industry Revenue (Million) Forecast, by Application 2019 & 2032
- Table 140: China Perforating Gun Industry Volume (K Unit) Forecast, by Application 2019 & 2032
- Table 141: India Perforating Gun Industry Revenue (Million) Forecast, by Application 2019 & 2032
- Table 142: India Perforating Gun Industry Volume (K Unit) Forecast, by Application 2019 & 2032
- Table 143: Indoensia Perforating Gun Industry Revenue (Million) Forecast, by Application 2019 & 2032
- Table 144: Indoensia Perforating Gun Industry Volume (K Unit) Forecast, by Application 2019 & 2032
- Table 145: Malaysia Perforating Gun Industry Revenue (Million) Forecast, by Application 2019 & 2032
- Table 146: Malaysia Perforating Gun Industry Volume (K Unit) Forecast, by Application 2019 & 2032
- Table 147: Rest of Asia Pacific Perforating Gun Industry Revenue (Million) Forecast, by Application 2019 & 2032
- Table 148: Rest of Asia Pacific Perforating Gun Industry Volume (K Unit) Forecast, by Application 2019 & 2032
- Table 149: Global Perforating Gun Industry Revenue Million Forecast, by Carrier Type 2019 & 2032
- Table 150: Global Perforating Gun Industry Volume K Unit Forecast, by Carrier Type 2019 & 2032
- Table 151: Global Perforating Gun Industry Revenue Million Forecast, by Explosive Type 2019 & 2032
- Table 152: Global Perforating Gun Industry Volume K Unit Forecast, by Explosive Type 2019 & 2032
- Table 153: Global Perforating Gun Industry Revenue Million Forecast, by Well Type 2019 & 2032
- Table 154: Global Perforating Gun Industry Volume K Unit Forecast, by Well Type 2019 & 2032
- Table 155: Global Perforating Gun Industry Revenue Million Forecast, by Country 2019 & 2032
- Table 156: Global Perforating Gun Industry Volume K Unit Forecast, by Country 2019 & 2032
- Table 157: Chile Perforating Gun Industry Revenue (Million) Forecast, by Application 2019 & 2032
- Table 158: Chile Perforating Gun Industry Volume (K Unit) Forecast, by Application 2019 & 2032
- Table 159: Brazil Perforating Gun Industry Revenue (Million) Forecast, by Application 2019 & 2032
- Table 160: Brazil Perforating Gun Industry Volume (K Unit) Forecast, by Application 2019 & 2032
- Table 161: Argentina Perforating Gun Industry Revenue (Million) Forecast, by Application 2019 & 2032
- Table 162: Argentina Perforating Gun Industry Volume (K Unit) Forecast, by Application 2019 & 2032
- Table 163: Rest of South Africa Perforating Gun Industry Revenue (Million) Forecast, by Application 2019 & 2032
- Table 164: Rest of South Africa Perforating Gun Industry Volume (K Unit) Forecast, by Application 2019 & 2032
- Table 165: Global Perforating Gun Industry Revenue Million Forecast, by Carrier Type 2019 & 2032
- Table 166: Global Perforating Gun Industry Volume K Unit Forecast, by Carrier Type 2019 & 2032
- Table 167: Global Perforating Gun Industry Revenue Million Forecast, by Explosive Type 2019 & 2032
- Table 168: Global Perforating Gun Industry Volume K Unit Forecast, by Explosive Type 2019 & 2032
- Table 169: Global Perforating Gun Industry Revenue Million Forecast, by Well Type 2019 & 2032
- Table 170: Global Perforating Gun Industry Volume K Unit Forecast, by Well Type 2019 & 2032
- Table 171: Global Perforating Gun Industry Revenue Million Forecast, by Country 2019 & 2032
- Table 172: Global Perforating Gun Industry Volume K Unit Forecast, by Country 2019 & 2032
- Table 173: Global Perforating Gun Industry Revenue Million Forecast, by Carrier Type 2019 & 2032
- Table 174: Global Perforating Gun Industry Volume K Unit Forecast, by Carrier Type 2019 & 2032
- Table 175: Global Perforating Gun Industry Revenue Million Forecast, by Explosive Type 2019 & 2032
- Table 176: Global Perforating Gun Industry Volume K Unit Forecast, by Explosive Type 2019 & 2032
- Table 177: Global Perforating Gun Industry Revenue Million Forecast, by Well Type 2019 & 2032
- Table 178: Global Perforating Gun Industry Volume K Unit Forecast, by Well Type 2019 & 2032
- Table 179: Global Perforating Gun Industry Revenue Million Forecast, by Country 2019 & 2032
- Table 180: Global Perforating Gun Industry Volume K Unit Forecast, by Country 2019 & 2032
- Table 181: Saudi Arabia Perforating Gun Industry Revenue (Million) Forecast, by Application 2019 & 2032
- Table 182: Saudi Arabia Perforating Gun Industry Volume (K Unit) Forecast, by Application 2019 & 2032
- Table 183: South Afica Perforating Gun Industry Revenue (Million) Forecast, by Application 2019 & 2032
- Table 184: South Afica Perforating Gun Industry Volume (K Unit) Forecast, by Application 2019 & 2032
- Table 185: Egypt Perforating Gun Industry Revenue (Million) Forecast, by Application 2019 & 2032
- Table 186: Egypt Perforating Gun Industry Volume (K Unit) Forecast, by Application 2019 & 2032
- Table 187: Nigeria Perforating Gun Industry Revenue (Million) Forecast, by Application 2019 & 2032
- Table 188: Nigeria Perforating Gun Industry Volume (K Unit) Forecast, by Application 2019 & 2032
- Table 189: Rest of Middle East Perforating Gun Industry Revenue (Million) Forecast, by Application 2019 & 2032
- Table 190: Rest of Middle East Perforating Gun Industry Volume (K Unit) Forecast, by Application 2019 & 2032
Frequently Asked Questions
1. What is the projected Compound Annual Growth Rate (CAGR) of the Perforating Gun Industry?
The projected CAGR is approximately 5.50%.
2. Which companies are prominent players in the Perforating Gun Industry?
Key companies in the market include Hunting PLC, Weatherford International PLC, Baker Hughes Company, Halliburton Company, DMC Global Inc, Schlumberger Limited, DynaEnergetics GmbH & Co KG, NOV Inc, Core Laboratories NV*List Not Exhaustive 6 4 Market Ranking/Share (%) Analysi, China Shaanxi FYPE Rigid Machinery Co Ltd.
3. What are the main segments of the Perforating Gun Industry?
The market segments include Carrier Type, Explosive Type, Well Type.
4. Can you provide details about the market size?
The market size is estimated to be USD 1.16 Million as of 2022.
5. What are some drivers contributing to market growth?
4.; Rise In Oil And Gas Drilling Activities And Associated Investments4.; Technological Developments In Perforating Gun Systems.
6. What are the notable trends driving market growth?
Horizontal and Deviated Well Segment to Dominate the Market.
7. Are there any restraints impacting market growth?
4.; Increased Focus On Renewable Energy Technologies To Fulfill Rising Energy Demand.
8. Can you provide examples of recent developments in the market?
In July 2023, DynaEnergetics unveiled DS Gravity 2.0, marking a breakthrough as the most compact, self-orienting perforating gun in the oil and gas sector. This length-optimized system is crafted to enhance perforation efficiency, save time, and contribute to the profitability of wells. Its patented design leverages gravity for internal component orientation, eliminating the necessity for orienting subs, swivels, and eccentric weight bars. As the second generation of the DS Gravity system, it boasts the shortest gun body in the market, allowing customers to augment the total gun count in their perforating strings.
9. What pricing options are available for accessing the report?
Pricing options include single-user, multi-user, and enterprise licenses priced at USD 4750, USD 5250, and USD 8750 respectively.
10. Is the market size provided in terms of value or volume?
The market size is provided in terms of value, measured in Million and volume, measured in K Unit.
11. Are there any specific market keywords associated with the report?
Yes, the market keyword associated with the report is "Perforating Gun Industry," which aids in identifying and referencing the specific market segment covered.
12. How do I determine which pricing option suits my needs best?
The pricing options vary based on user requirements and access needs. Individual users may opt for single-user licenses, while businesses requiring broader access may choose multi-user or enterprise licenses for cost-effective access to the report.
13. Are there any additional resources or data provided in the Perforating Gun Industry report?
While the report offers comprehensive insights, it's advisable to review the specific contents or supplementary materials provided to ascertain if additional resources or data are available.
14. How can I stay updated on further developments or reports in the Perforating Gun Industry?
To stay informed about further developments, trends, and reports in the Perforating Gun Industry, consider subscribing to industry newsletters, following relevant companies and organizations, or regularly checking reputable industry news sources and publications.
Methodology
Step 1 - Identification of Relevant Samples Size from Population Database


Step 2 - Approaches for Defining Global Market Size (Value, Volume* & Price*)

Note*: In applicable scenarios
Step 3 - Data Sources
Primary Research
- Web Analytics
- Survey Reports
- Research Institute
- Latest Research Reports
- Opinion Leaders
Secondary Research
- Annual Reports
- White Paper
- Latest Press Release
- Industry Association
- Paid Database
- Investor Presentations

Step 4 - Data Triangulation
Involves using different sources of information in order to increase the validity of a study
These sources are likely to be stakeholders in a program - participants, other researchers, program staff, other community members, and so on.
Then we put all data in single framework & apply various statistical tools to find out the dynamic on the market.
During the analysis stage, feedback from the stakeholder groups would be compared to determine areas of agreement as well as areas of divergence


