
Key Insights
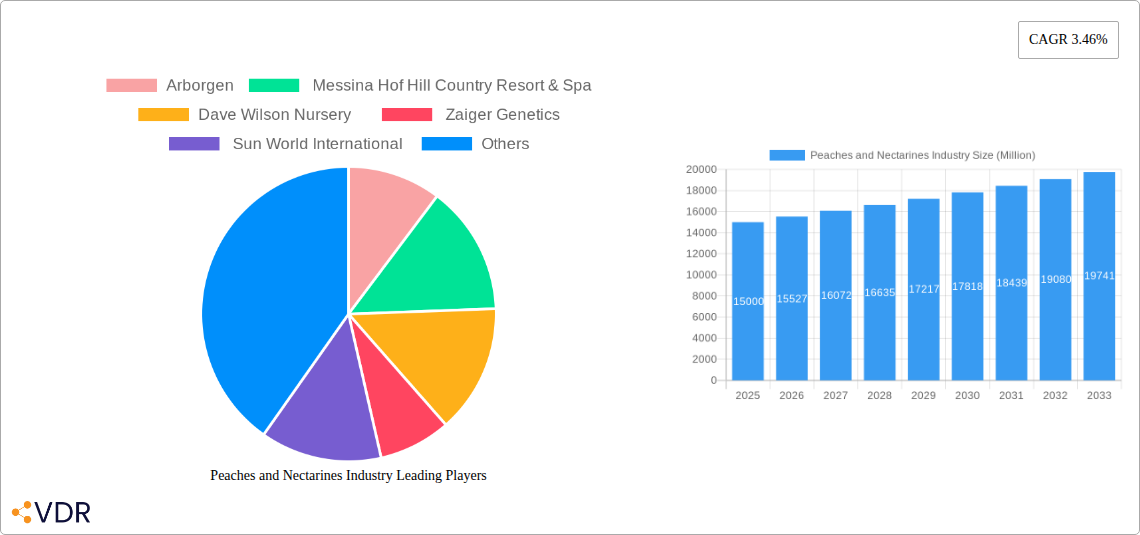
The global peaches and nectarines market, valued at approximately $15 billion in 2025, is projected to experience steady growth, with a compound annual growth rate (CAGR) of 3.46% from 2025 to 2033. This growth is fueled by several key drivers. Rising consumer demand for fresh, healthy produce and increased awareness of the nutritional benefits of peaches and nectarines are significant contributors. The growing popularity of these fruits in processed foods, such as jams, preserves, and juices, further expands the market. Innovative product development, including new varieties with enhanced flavor profiles and extended shelf life, also plays a crucial role. Furthermore, the expansion of e-commerce platforms and online grocery delivery services provides convenient access for consumers, driving market growth within the retail and online distribution channels. However, challenges remain, including seasonal fluctuations in supply, susceptibility to pests and diseases affecting crop yields, and price volatility influenced by factors like weather patterns and global trade dynamics.
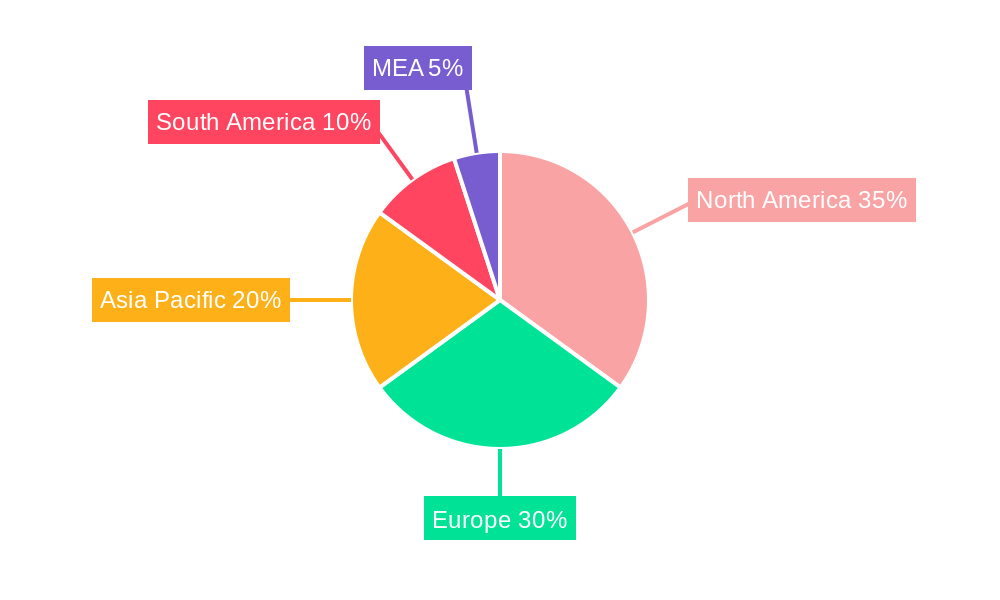
The market segmentation reveals a dominance of the retail channel, reflecting the high demand for fresh peaches and nectarines. The food processing segment also plays a vital role, converting a significant portion of the harvest into value-added products. The online segment, although smaller currently, exhibits significant potential for future expansion as online shopping habits continue to evolve. Geographically, North America and Europe currently hold significant market shares, owing to established cultivation practices and high consumption levels. However, growing disposable incomes and changing dietary preferences in regions like Asia-Pacific are expected to fuel substantial growth in these markets in the coming years. Major players in the industry, such as Arborgen, Messina Hof, Dave Wilson Nursery, Zaiger Genetics, and Sun World International, are actively involved in research and development, seeking to improve crop yields, introduce new varieties, and enhance distribution networks to capitalize on emerging market opportunities. Strategic partnerships and collaborations are also observed amongst players within the supply chain for improved efficiency and market access.
Peaches and Nectarines Industry Market Report: 2019-2033
This comprehensive report provides a detailed analysis of the global peaches and nectarines industry, covering market dynamics, growth trends, regional insights, product landscape, and key players. With a study period spanning 2019-2033, a base year of 2025, and a forecast period of 2025-2033, this report is an essential resource for industry professionals, investors, and stakeholders seeking to understand the current state and future trajectory of this dynamic market. The report segments the market by product type (peaches and nectarines) and distribution channel (retail, food processing, online), offering granular insights into each segment's performance and potential. The total market size is projected to reach xx Million units by 2033.
Peaches and Nectarines Industry Market Dynamics & Structure
The peaches and nectarines industry is characterized by a moderately fragmented market structure, with several large players and numerous smaller regional producers. Market concentration is relatively low, although leading companies such as Sun World International hold significant market share. Technological innovation, particularly in areas like disease-resistant cultivars and improved harvesting techniques, is a key driver of growth. Regulatory frameworks, including those concerning pesticide use and food safety, significantly influence industry practices. Competitive substitutes, such as other stone fruits and berries, exert pressure on pricing and market share. End-user demographics, particularly growing health consciousness and demand for convenience, shape consumer preferences. M&A activity within the industry has been moderate over the past few years, with a total of xx deals recorded during the historical period (2019-2024).
- Market Concentration: Low to moderate, with top 5 players holding approximately xx% of market share in 2025.
- Technological Innovation: Focus on disease-resistant varieties, improved shelf life, and efficient harvesting technologies.
- Regulatory Framework: Stringent food safety regulations and pesticide restrictions influence production practices.
- Competitive Substitutes: Other stone fruits (plums, cherries), berries, and other fresh produce compete for consumer spending.
- End-User Demographics: Growing demand for healthy, convenient snack options fuels market growth.
- M&A Trends: Moderate M&A activity, with xx deals recorded between 2019 and 2024, primarily focused on consolidating production and distribution networks. xx% of these deals involved international acquisitions.
Peaches and Nectarines Industry Growth Trends & Insights
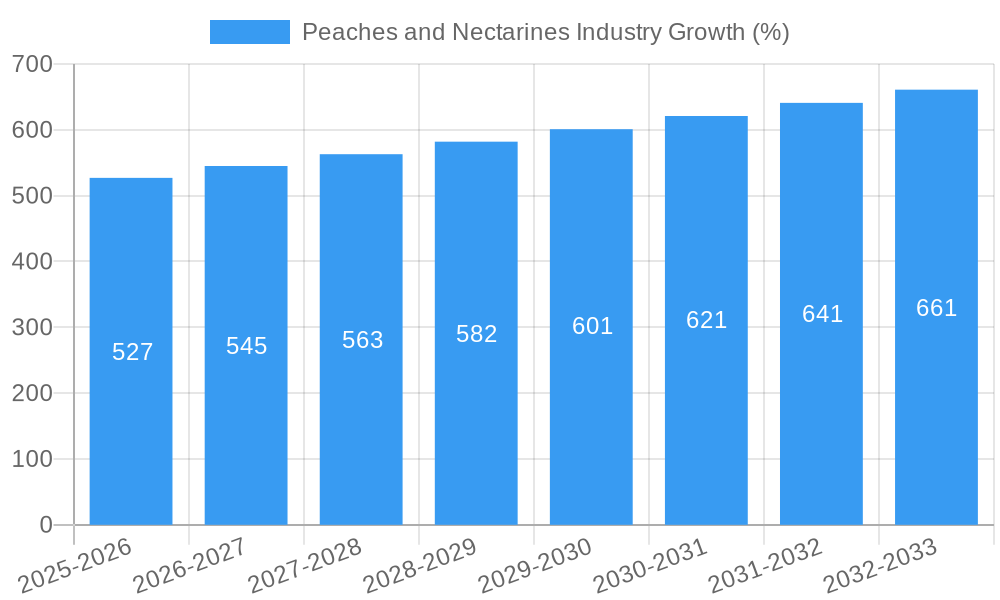
The global peaches and nectarines market experienced consistent growth during the historical period (2019-2024), driven by factors such as rising disposable incomes, increasing health awareness, and changing consumer preferences toward fresh and natural food products. Market size grew from xx Million units in 2019 to xx Million units in 2024, representing a CAGR of xx%. Technological advancements in cultivation and post-harvest handling have contributed to improved yield and product quality. Consumer behavior shifts towards healthier snack options and increased online grocery shopping have boosted demand. Technological disruptions, such as precision agriculture and automated harvesting systems, are expected to enhance efficiency and sustainability in the coming years. The market penetration rate for peaches and nectarines is projected to reach xx% by 2033.
Dominant Regions, Countries, or Segments in Peaches and Nectarines Industry
The dominant regions for peaches and nectarines production and consumption are concentrated in North America, Europe, and parts of Asia. Within these regions, specific countries like the United States, China, Spain, and Italy emerge as key players. The retail distribution channel remains the largest segment, accounting for xx% of total sales in 2025, driven by high consumer preference for fresh produce. The food processing segment is also significant, utilizing peaches and nectarines in canned goods, juices, and other value-added products. Online sales are rapidly growing, with an estimated xx% market share in 2025, due to increased e-commerce adoption and convenience.
- Key Drivers: Favorable climatic conditions in certain regions, established infrastructure supporting agriculture and distribution, strong consumer demand, and government support for agricultural development.
- Dominance Factors: High production volumes, favorable export markets, strong domestic consumption, and established processing infrastructure. For example, California's agricultural prowess makes the US a key player.
- Growth Potential: Emerging markets in Asia and Africa represent significant growth opportunities, but they may require investments in infrastructure and technology.
Peaches and Nectarines Industry Product Landscape
The peaches and nectarines product landscape is characterized by a wide variety of cultivars, each possessing unique flavor profiles, colors, and shelf life characteristics. Ongoing innovation is focused on developing disease-resistant varieties, improving fruit size and yield, and enhancing flavor profiles to cater to specific consumer preferences. Technological advancements such as controlled atmosphere storage and improved packaging techniques are crucial for extending shelf life and reducing post-harvest losses. Unique selling propositions often highlight specific flavor profiles (e.g., sweet, tart), color, or size.
Key Drivers, Barriers & Challenges in Peaches and Nectarines Industry
Key Drivers:
- Increasing consumer demand for healthy snacks.
- Growing popularity of processed peach and nectarine products.
- Technological advancements in farming and packaging.
Challenges & Restraints:
- Fluctuations in weather patterns affecting yields.
- Increased competition from other fruits.
- Rising labor and transportation costs.
- Supply chain disruptions leading to xx% increase in prices during 2023.
Emerging Opportunities in Peaches and Nectarines Industry
- Expansion into new markets in developing economies.
- Development of value-added products, such as organic peaches and nectarines, and unique flavor combinations.
- Exploring novel applications in functional foods and nutraceuticals.
Growth Accelerators in the Peaches and Nectarines Industry Industry
Technological breakthroughs in genetics and precision agriculture will continue to improve yields and reduce production costs, stimulating market expansion. Strategic partnerships between growers, processors, and retailers will optimize supply chains and enhance distribution efficiency. Aggressive marketing campaigns highlighting the nutritional benefits and versatility of peaches and nectarines will increase demand. Market expansion into new geographies will also contribute to long-term growth.
Key Players Shaping the Peaches and Nectarines Industry Market
- Arborgen
- Messina Hof Hill Country Resort & Spa
- Dave Wilson Nursery
- Zaiger Genetics
- Sun World International
Notable Milestones in Peaches and Nectarines Industry Sector
- 2020: Launch of a new disease-resistant peach cultivar by Zaiger Genetics.
- 2021: Acquisition of a major peach processing facility by a large food company.
- 2022: Introduction of sustainable packaging solutions by a leading retailer.
- 2023: Significant increase in online sales due to pandemic-driven changes in consumer behavior.
In-Depth Peaches and Nectarines Industry Market Outlook
The peaches and nectarines industry is poised for sustained growth over the forecast period (2025-2033), driven by a confluence of factors including technological innovations, evolving consumer preferences, and expanding global markets. Strategic investments in research and development, sustainable agricultural practices, and efficient distribution networks will be crucial for capturing future opportunities. The market is expected to expand significantly, particularly in emerging economies, presenting attractive opportunities for both established players and new entrants.
Peaches and Nectarines Industry Segmentation
- 1. Production Analysis
- 2. Consumption Analysis
- 3. Import Market Analysis (Value & Volume)
- 4. Export Market Analysis (Value & Volume)
- 5. Price Trend Analysis
Peaches and Nectarines Industry Segmentation By Geography
-
1. North America
- 1.1. United States
-
2. Europe
- 2.1. Italy
-
3. Asia Pacific
- 3.1. China
-
4. South America
- 4.1. Chile
-
5. Africa
- 5.1. Egypt
Peaches and Nectarines Industry REPORT HIGHLIGHTS
| Aspects | Details |
|---|---|
| Study Period | 2019-2033 |
| Base Year | 2024 |
| Estimated Year | 2025 |
| Forecast Period | 2025-2033 |
| Historical Period | 2019-2024 |
| Growth Rate | CAGR of 3.46% from 2019-2033 |
| Segmentation |
|
Table of Contents
- 1. Introduction
- 1.1. Research Scope
- 1.2. Market Segmentation
- 1.3. Research Methodology
- 1.4. Definitions and Assumptions
- 2. Executive Summary
- 2.1. Introduction
- 3. Market Dynamics
- 3.1. Introduction
- 3.2. Market Drivers
- 3.2.1. ; Awareness About Health Benefits Associated With Pecan Consumption; Wide Application of Pecan
- 3.3. Market Restrains
- 3.3.1. ; Volatility in the Prices; Adverse Weather Conditions Affecting Yield
- 3.4. Market Trends
- 3.4.1. China is Leading the Market in Terms of Production
- 4. Market Factor Analysis
- 4.1. Porters Five Forces
- 4.2. Supply/Value Chain
- 4.3. PESTEL analysis
- 4.4. Market Entropy
- 4.5. Patent/Trademark Analysis
- 5. Global Peaches and Nectarines Industry Analysis, Insights and Forecast, 2019-2031
- 5.1. Market Analysis, Insights and Forecast - by Production Analysis
- 5.2. Market Analysis, Insights and Forecast - by Consumption Analysis
- 5.3. Market Analysis, Insights and Forecast - by Import Market Analysis (Value & Volume)
- 5.4. Market Analysis, Insights and Forecast - by Export Market Analysis (Value & Volume)
- 5.5. Market Analysis, Insights and Forecast - by Price Trend Analysis
- 5.6. Market Analysis, Insights and Forecast - by Region
- 5.6.1. North America
- 5.6.2. Europe
- 5.6.3. Asia Pacific
- 5.6.4. South America
- 5.6.5. Africa
- 5.1. Market Analysis, Insights and Forecast - by Production Analysis
- 6. North America Peaches and Nectarines Industry Analysis, Insights and Forecast, 2019-2031
- 6.1. Market Analysis, Insights and Forecast - by Production Analysis
- 6.2. Market Analysis, Insights and Forecast - by Consumption Analysis
- 6.3. Market Analysis, Insights and Forecast - by Import Market Analysis (Value & Volume)
- 6.4. Market Analysis, Insights and Forecast - by Export Market Analysis (Value & Volume)
- 6.5. Market Analysis, Insights and Forecast - by Price Trend Analysis
- 6.1. Market Analysis, Insights and Forecast - by Production Analysis
- 7. Europe Peaches and Nectarines Industry Analysis, Insights and Forecast, 2019-2031
- 7.1. Market Analysis, Insights and Forecast - by Production Analysis
- 7.2. Market Analysis, Insights and Forecast - by Consumption Analysis
- 7.3. Market Analysis, Insights and Forecast - by Import Market Analysis (Value & Volume)
- 7.4. Market Analysis, Insights and Forecast - by Export Market Analysis (Value & Volume)
- 7.5. Market Analysis, Insights and Forecast - by Price Trend Analysis
- 7.1. Market Analysis, Insights and Forecast - by Production Analysis
- 8. Asia Pacific Peaches and Nectarines Industry Analysis, Insights and Forecast, 2019-2031
- 8.1. Market Analysis, Insights and Forecast - by Production Analysis
- 8.2. Market Analysis, Insights and Forecast - by Consumption Analysis
- 8.3. Market Analysis, Insights and Forecast - by Import Market Analysis (Value & Volume)
- 8.4. Market Analysis, Insights and Forecast - by Export Market Analysis (Value & Volume)
- 8.5. Market Analysis, Insights and Forecast - by Price Trend Analysis
- 8.1. Market Analysis, Insights and Forecast - by Production Analysis
- 9. South America Peaches and Nectarines Industry Analysis, Insights and Forecast, 2019-2031
- 9.1. Market Analysis, Insights and Forecast - by Production Analysis
- 9.2. Market Analysis, Insights and Forecast - by Consumption Analysis
- 9.3. Market Analysis, Insights and Forecast - by Import Market Analysis (Value & Volume)
- 9.4. Market Analysis, Insights and Forecast - by Export Market Analysis (Value & Volume)
- 9.5. Market Analysis, Insights and Forecast - by Price Trend Analysis
- 9.1. Market Analysis, Insights and Forecast - by Production Analysis
- 10. Africa Peaches and Nectarines Industry Analysis, Insights and Forecast, 2019-2031
- 10.1. Market Analysis, Insights and Forecast - by Production Analysis
- 10.2. Market Analysis, Insights and Forecast - by Consumption Analysis
- 10.3. Market Analysis, Insights and Forecast - by Import Market Analysis (Value & Volume)
- 10.4. Market Analysis, Insights and Forecast - by Export Market Analysis (Value & Volume)
- 10.5. Market Analysis, Insights and Forecast - by Price Trend Analysis
- 10.1. Market Analysis, Insights and Forecast - by Production Analysis
- 11. Europe Peaches and Nectarines Industry Analysis, Insights and Forecast, 2019-2031
- 11.1. Market Analysis, Insights and Forecast - By Country/Sub-region
- 11.1.1 Germany
- 11.1.2 France
- 11.1.3 Italy
- 11.1.4 United Kingdom
- 11.1.5 Netherlands
- 11.1.6 Rest of Europe
- 12. North America Peaches and Nectarines Industry Analysis, Insights and Forecast, 2019-2031
- 12.1. Market Analysis, Insights and Forecast - By Country/Sub-region
- 12.1.1 United States
- 12.1.2 Canada
- 12.1.3 Mexico
- 13. South America Peaches and Nectarines Industry Analysis, Insights and Forecast, 2019-2031
- 13.1. Market Analysis, Insights and Forecast - By Country/Sub-region
- 13.1.1 Brazil
- 13.1.2 Argentina
- 13.1.3 Rest of South America
- 14. Asia Pacific Peaches and Nectarines Industry Analysis, Insights and Forecast, 2019-2031
- 14.1. Market Analysis, Insights and Forecast - By Country/Sub-region
- 14.1.1 China
- 14.1.2 Japan
- 14.1.3 India
- 14.1.4 South Korea
- 14.1.5 Taiwan
- 14.1.6 Australia
- 14.1.7 Rest of Asia-Pacific
- 15. MEA Peaches and Nectarines Industry Analysis, Insights and Forecast, 2019-2031
- 15.1. Market Analysis, Insights and Forecast - By Country/Sub-region
- 15.1.1 Middle East
- 15.1.2 Africa
- 16. Competitive Analysis
- 16.1. Global Market Share Analysis 2024
- 16.2. Company Profiles
- 16.2.1 Arborgen
- 16.2.1.1. Overview
- 16.2.1.2. Products
- 16.2.1.3. SWOT Analysis
- 16.2.1.4. Recent Developments
- 16.2.1.5. Financials (Based on Availability)
- 16.2.2 Messina Hof Hill Country Resort & Spa
- 16.2.2.1. Overview
- 16.2.2.2. Products
- 16.2.2.3. SWOT Analysis
- 16.2.2.4. Recent Developments
- 16.2.2.5. Financials (Based on Availability)
- 16.2.3 Dave Wilson Nursery
- 16.2.3.1. Overview
- 16.2.3.2. Products
- 16.2.3.3. SWOT Analysis
- 16.2.3.4. Recent Developments
- 16.2.3.5. Financials (Based on Availability)
- 16.2.4 Zaiger Genetics
- 16.2.4.1. Overview
- 16.2.4.2. Products
- 16.2.4.3. SWOT Analysis
- 16.2.4.4. Recent Developments
- 16.2.4.5. Financials (Based on Availability)
- 16.2.5 Sun World International
- 16.2.5.1. Overview
- 16.2.5.2. Products
- 16.2.5.3. SWOT Analysis
- 16.2.5.4. Recent Developments
- 16.2.5.5. Financials (Based on Availability)
- 16.2.1 Arborgen
List of Figures
- Figure 1: Global Peaches and Nectarines Industry Revenue Breakdown (Million, %) by Region 2024 & 2032
- Figure 2: Europe Peaches and Nectarines Industry Revenue (Million), by Country 2024 & 2032
- Figure 3: Europe Peaches and Nectarines Industry Revenue Share (%), by Country 2024 & 2032
- Figure 4: North America Peaches and Nectarines Industry Revenue (Million), by Country 2024 & 2032
- Figure 5: North America Peaches and Nectarines Industry Revenue Share (%), by Country 2024 & 2032
- Figure 6: South America Peaches and Nectarines Industry Revenue (Million), by Country 2024 & 2032
- Figure 7: South America Peaches and Nectarines Industry Revenue Share (%), by Country 2024 & 2032
- Figure 8: Asia Pacific Peaches and Nectarines Industry Revenue (Million), by Country 2024 & 2032
- Figure 9: Asia Pacific Peaches and Nectarines Industry Revenue Share (%), by Country 2024 & 2032
- Figure 10: MEA Peaches and Nectarines Industry Revenue (Million), by Country 2024 & 2032
- Figure 11: MEA Peaches and Nectarines Industry Revenue Share (%), by Country 2024 & 2032
- Figure 12: North America Peaches and Nectarines Industry Revenue (Million), by Production Analysis 2024 & 2032
- Figure 13: North America Peaches and Nectarines Industry Revenue Share (%), by Production Analysis 2024 & 2032
- Figure 14: North America Peaches and Nectarines Industry Revenue (Million), by Consumption Analysis 2024 & 2032
- Figure 15: North America Peaches and Nectarines Industry Revenue Share (%), by Consumption Analysis 2024 & 2032
- Figure 16: North America Peaches and Nectarines Industry Revenue (Million), by Import Market Analysis (Value & Volume) 2024 & 2032
- Figure 17: North America Peaches and Nectarines Industry Revenue Share (%), by Import Market Analysis (Value & Volume) 2024 & 2032
- Figure 18: North America Peaches and Nectarines Industry Revenue (Million), by Export Market Analysis (Value & Volume) 2024 & 2032
- Figure 19: North America Peaches and Nectarines Industry Revenue Share (%), by Export Market Analysis (Value & Volume) 2024 & 2032
- Figure 20: North America Peaches and Nectarines Industry Revenue (Million), by Price Trend Analysis 2024 & 2032
- Figure 21: North America Peaches and Nectarines Industry Revenue Share (%), by Price Trend Analysis 2024 & 2032
- Figure 22: North America Peaches and Nectarines Industry Revenue (Million), by Country 2024 & 2032
- Figure 23: North America Peaches and Nectarines Industry Revenue Share (%), by Country 2024 & 2032
- Figure 24: Europe Peaches and Nectarines Industry Revenue (Million), by Production Analysis 2024 & 2032
- Figure 25: Europe Peaches and Nectarines Industry Revenue Share (%), by Production Analysis 2024 & 2032
- Figure 26: Europe Peaches and Nectarines Industry Revenue (Million), by Consumption Analysis 2024 & 2032
- Figure 27: Europe Peaches and Nectarines Industry Revenue Share (%), by Consumption Analysis 2024 & 2032
- Figure 28: Europe Peaches and Nectarines Industry Revenue (Million), by Import Market Analysis (Value & Volume) 2024 & 2032
- Figure 29: Europe Peaches and Nectarines Industry Revenue Share (%), by Import Market Analysis (Value & Volume) 2024 & 2032
- Figure 30: Europe Peaches and Nectarines Industry Revenue (Million), by Export Market Analysis (Value & Volume) 2024 & 2032
- Figure 31: Europe Peaches and Nectarines Industry Revenue Share (%), by Export Market Analysis (Value & Volume) 2024 & 2032
- Figure 32: Europe Peaches and Nectarines Industry Revenue (Million), by Price Trend Analysis 2024 & 2032
- Figure 33: Europe Peaches and Nectarines Industry Revenue Share (%), by Price Trend Analysis 2024 & 2032
- Figure 34: Europe Peaches and Nectarines Industry Revenue (Million), by Country 2024 & 2032
- Figure 35: Europe Peaches and Nectarines Industry Revenue Share (%), by Country 2024 & 2032
- Figure 36: Asia Pacific Peaches and Nectarines Industry Revenue (Million), by Production Analysis 2024 & 2032
- Figure 37: Asia Pacific Peaches and Nectarines Industry Revenue Share (%), by Production Analysis 2024 & 2032
- Figure 38: Asia Pacific Peaches and Nectarines Industry Revenue (Million), by Consumption Analysis 2024 & 2032
- Figure 39: Asia Pacific Peaches and Nectarines Industry Revenue Share (%), by Consumption Analysis 2024 & 2032
- Figure 40: Asia Pacific Peaches and Nectarines Industry Revenue (Million), by Import Market Analysis (Value & Volume) 2024 & 2032
- Figure 41: Asia Pacific Peaches and Nectarines Industry Revenue Share (%), by Import Market Analysis (Value & Volume) 2024 & 2032
- Figure 42: Asia Pacific Peaches and Nectarines Industry Revenue (Million), by Export Market Analysis (Value & Volume) 2024 & 2032
- Figure 43: Asia Pacific Peaches and Nectarines Industry Revenue Share (%), by Export Market Analysis (Value & Volume) 2024 & 2032
- Figure 44: Asia Pacific Peaches and Nectarines Industry Revenue (Million), by Price Trend Analysis 2024 & 2032
- Figure 45: Asia Pacific Peaches and Nectarines Industry Revenue Share (%), by Price Trend Analysis 2024 & 2032
- Figure 46: Asia Pacific Peaches and Nectarines Industry Revenue (Million), by Country 2024 & 2032
- Figure 47: Asia Pacific Peaches and Nectarines Industry Revenue Share (%), by Country 2024 & 2032
- Figure 48: South America Peaches and Nectarines Industry Revenue (Million), by Production Analysis 2024 & 2032
- Figure 49: South America Peaches and Nectarines Industry Revenue Share (%), by Production Analysis 2024 & 2032
- Figure 50: South America Peaches and Nectarines Industry Revenue (Million), by Consumption Analysis 2024 & 2032
- Figure 51: South America Peaches and Nectarines Industry Revenue Share (%), by Consumption Analysis 2024 & 2032
- Figure 52: South America Peaches and Nectarines Industry Revenue (Million), by Import Market Analysis (Value & Volume) 2024 & 2032
- Figure 53: South America Peaches and Nectarines Industry Revenue Share (%), by Import Market Analysis (Value & Volume) 2024 & 2032
- Figure 54: South America Peaches and Nectarines Industry Revenue (Million), by Export Market Analysis (Value & Volume) 2024 & 2032
- Figure 55: South America Peaches and Nectarines Industry Revenue Share (%), by Export Market Analysis (Value & Volume) 2024 & 2032
- Figure 56: South America Peaches and Nectarines Industry Revenue (Million), by Price Trend Analysis 2024 & 2032
- Figure 57: South America Peaches and Nectarines Industry Revenue Share (%), by Price Trend Analysis 2024 & 2032
- Figure 58: South America Peaches and Nectarines Industry Revenue (Million), by Country 2024 & 2032
- Figure 59: South America Peaches and Nectarines Industry Revenue Share (%), by Country 2024 & 2032
- Figure 60: Africa Peaches and Nectarines Industry Revenue (Million), by Production Analysis 2024 & 2032
- Figure 61: Africa Peaches and Nectarines Industry Revenue Share (%), by Production Analysis 2024 & 2032
- Figure 62: Africa Peaches and Nectarines Industry Revenue (Million), by Consumption Analysis 2024 & 2032
- Figure 63: Africa Peaches and Nectarines Industry Revenue Share (%), by Consumption Analysis 2024 & 2032
- Figure 64: Africa Peaches and Nectarines Industry Revenue (Million), by Import Market Analysis (Value & Volume) 2024 & 2032
- Figure 65: Africa Peaches and Nectarines Industry Revenue Share (%), by Import Market Analysis (Value & Volume) 2024 & 2032
- Figure 66: Africa Peaches and Nectarines Industry Revenue (Million), by Export Market Analysis (Value & Volume) 2024 & 2032
- Figure 67: Africa Peaches and Nectarines Industry Revenue Share (%), by Export Market Analysis (Value & Volume) 2024 & 2032
- Figure 68: Africa Peaches and Nectarines Industry Revenue (Million), by Price Trend Analysis 2024 & 2032
- Figure 69: Africa Peaches and Nectarines Industry Revenue Share (%), by Price Trend Analysis 2024 & 2032
- Figure 70: Africa Peaches and Nectarines Industry Revenue (Million), by Country 2024 & 2032
- Figure 71: Africa Peaches and Nectarines Industry Revenue Share (%), by Country 2024 & 2032
List of Tables
- Table 1: Global Peaches and Nectarines Industry Revenue Million Forecast, by Region 2019 & 2032
- Table 2: Global Peaches and Nectarines Industry Revenue Million Forecast, by Production Analysis 2019 & 2032
- Table 3: Global Peaches and Nectarines Industry Revenue Million Forecast, by Consumption Analysis 2019 & 2032
- Table 4: Global Peaches and Nectarines Industry Revenue Million Forecast, by Import Market Analysis (Value & Volume) 2019 & 2032
- Table 5: Global Peaches and Nectarines Industry Revenue Million Forecast, by Export Market Analysis (Value & Volume) 2019 & 2032
- Table 6: Global Peaches and Nectarines Industry Revenue Million Forecast, by Price Trend Analysis 2019 & 2032
- Table 7: Global Peaches and Nectarines Industry Revenue Million Forecast, by Region 2019 & 2032
- Table 8: Global Peaches and Nectarines Industry Revenue Million Forecast, by Country 2019 & 2032
- Table 9: Germany Peaches and Nectarines Industry Revenue (Million) Forecast, by Application 2019 & 2032
- Table 10: France Peaches and Nectarines Industry Revenue (Million) Forecast, by Application 2019 & 2032
- Table 11: Italy Peaches and Nectarines Industry Revenue (Million) Forecast, by Application 2019 & 2032
- Table 12: United Kingdom Peaches and Nectarines Industry Revenue (Million) Forecast, by Application 2019 & 2032
- Table 13: Netherlands Peaches and Nectarines Industry Revenue (Million) Forecast, by Application 2019 & 2032
- Table 14: Rest of Europe Peaches and Nectarines Industry Revenue (Million) Forecast, by Application 2019 & 2032
- Table 15: Global Peaches and Nectarines Industry Revenue Million Forecast, by Country 2019 & 2032
- Table 16: United States Peaches and Nectarines Industry Revenue (Million) Forecast, by Application 2019 & 2032
- Table 17: Canada Peaches and Nectarines Industry Revenue (Million) Forecast, by Application 2019 & 2032
- Table 18: Mexico Peaches and Nectarines Industry Revenue (Million) Forecast, by Application 2019 & 2032
- Table 19: Global Peaches and Nectarines Industry Revenue Million Forecast, by Country 2019 & 2032
- Table 20: Brazil Peaches and Nectarines Industry Revenue (Million) Forecast, by Application 2019 & 2032
- Table 21: Argentina Peaches and Nectarines Industry Revenue (Million) Forecast, by Application 2019 & 2032
- Table 22: Rest of South America Peaches and Nectarines Industry Revenue (Million) Forecast, by Application 2019 & 2032
- Table 23: Global Peaches and Nectarines Industry Revenue Million Forecast, by Country 2019 & 2032
- Table 24: China Peaches and Nectarines Industry Revenue (Million) Forecast, by Application 2019 & 2032
- Table 25: Japan Peaches and Nectarines Industry Revenue (Million) Forecast, by Application 2019 & 2032
- Table 26: India Peaches and Nectarines Industry Revenue (Million) Forecast, by Application 2019 & 2032
- Table 27: South Korea Peaches and Nectarines Industry Revenue (Million) Forecast, by Application 2019 & 2032
- Table 28: Taiwan Peaches and Nectarines Industry Revenue (Million) Forecast, by Application 2019 & 2032
- Table 29: Australia Peaches and Nectarines Industry Revenue (Million) Forecast, by Application 2019 & 2032
- Table 30: Rest of Asia-Pacific Peaches and Nectarines Industry Revenue (Million) Forecast, by Application 2019 & 2032
- Table 31: Global Peaches and Nectarines Industry Revenue Million Forecast, by Country 2019 & 2032
- Table 32: Middle East Peaches and Nectarines Industry Revenue (Million) Forecast, by Application 2019 & 2032
- Table 33: Africa Peaches and Nectarines Industry Revenue (Million) Forecast, by Application 2019 & 2032
- Table 34: Global Peaches and Nectarines Industry Revenue Million Forecast, by Production Analysis 2019 & 2032
- Table 35: Global Peaches and Nectarines Industry Revenue Million Forecast, by Consumption Analysis 2019 & 2032
- Table 36: Global Peaches and Nectarines Industry Revenue Million Forecast, by Import Market Analysis (Value & Volume) 2019 & 2032
- Table 37: Global Peaches and Nectarines Industry Revenue Million Forecast, by Export Market Analysis (Value & Volume) 2019 & 2032
- Table 38: Global Peaches and Nectarines Industry Revenue Million Forecast, by Price Trend Analysis 2019 & 2032
- Table 39: Global Peaches and Nectarines Industry Revenue Million Forecast, by Country 2019 & 2032
- Table 40: United States Peaches and Nectarines Industry Revenue (Million) Forecast, by Application 2019 & 2032
- Table 41: Global Peaches and Nectarines Industry Revenue Million Forecast, by Production Analysis 2019 & 2032
- Table 42: Global Peaches and Nectarines Industry Revenue Million Forecast, by Consumption Analysis 2019 & 2032
- Table 43: Global Peaches and Nectarines Industry Revenue Million Forecast, by Import Market Analysis (Value & Volume) 2019 & 2032
- Table 44: Global Peaches and Nectarines Industry Revenue Million Forecast, by Export Market Analysis (Value & Volume) 2019 & 2032
- Table 45: Global Peaches and Nectarines Industry Revenue Million Forecast, by Price Trend Analysis 2019 & 2032
- Table 46: Global Peaches and Nectarines Industry Revenue Million Forecast, by Country 2019 & 2032
- Table 47: Italy Peaches and Nectarines Industry Revenue (Million) Forecast, by Application 2019 & 2032
- Table 48: Global Peaches and Nectarines Industry Revenue Million Forecast, by Production Analysis 2019 & 2032
- Table 49: Global Peaches and Nectarines Industry Revenue Million Forecast, by Consumption Analysis 2019 & 2032
- Table 50: Global Peaches and Nectarines Industry Revenue Million Forecast, by Import Market Analysis (Value & Volume) 2019 & 2032
- Table 51: Global Peaches and Nectarines Industry Revenue Million Forecast, by Export Market Analysis (Value & Volume) 2019 & 2032
- Table 52: Global Peaches and Nectarines Industry Revenue Million Forecast, by Price Trend Analysis 2019 & 2032
- Table 53: Global Peaches and Nectarines Industry Revenue Million Forecast, by Country 2019 & 2032
- Table 54: China Peaches and Nectarines Industry Revenue (Million) Forecast, by Application 2019 & 2032
- Table 55: Global Peaches and Nectarines Industry Revenue Million Forecast, by Production Analysis 2019 & 2032
- Table 56: Global Peaches and Nectarines Industry Revenue Million Forecast, by Consumption Analysis 2019 & 2032
- Table 57: Global Peaches and Nectarines Industry Revenue Million Forecast, by Import Market Analysis (Value & Volume) 2019 & 2032
- Table 58: Global Peaches and Nectarines Industry Revenue Million Forecast, by Export Market Analysis (Value & Volume) 2019 & 2032
- Table 59: Global Peaches and Nectarines Industry Revenue Million Forecast, by Price Trend Analysis 2019 & 2032
- Table 60: Global Peaches and Nectarines Industry Revenue Million Forecast, by Country 2019 & 2032
- Table 61: Chile Peaches and Nectarines Industry Revenue (Million) Forecast, by Application 2019 & 2032
- Table 62: Global Peaches and Nectarines Industry Revenue Million Forecast, by Production Analysis 2019 & 2032
- Table 63: Global Peaches and Nectarines Industry Revenue Million Forecast, by Consumption Analysis 2019 & 2032
- Table 64: Global Peaches and Nectarines Industry Revenue Million Forecast, by Import Market Analysis (Value & Volume) 2019 & 2032
- Table 65: Global Peaches and Nectarines Industry Revenue Million Forecast, by Export Market Analysis (Value & Volume) 2019 & 2032
- Table 66: Global Peaches and Nectarines Industry Revenue Million Forecast, by Price Trend Analysis 2019 & 2032
- Table 67: Global Peaches and Nectarines Industry Revenue Million Forecast, by Country 2019 & 2032
- Table 68: Egypt Peaches and Nectarines Industry Revenue (Million) Forecast, by Application 2019 & 2032
Frequently Asked Questions
1. What is the projected Compound Annual Growth Rate (CAGR) of the Peaches and Nectarines Industry?
The projected CAGR is approximately 3.46%.
2. Which companies are prominent players in the Peaches and Nectarines Industry?
Key companies in the market include Arborgen, Messina Hof Hill Country Resort & Spa, Dave Wilson Nursery , Zaiger Genetics, Sun World International .
3. What are the main segments of the Peaches and Nectarines Industry?
The market segments include Production Analysis, Consumption Analysis, Import Market Analysis (Value & Volume), Export Market Analysis (Value & Volume), Price Trend Analysis.
4. Can you provide details about the market size?
The market size is estimated to be USD XXX Million as of 2022.
5. What are some drivers contributing to market growth?
; Awareness About Health Benefits Associated With Pecan Consumption; Wide Application of Pecan.
6. What are the notable trends driving market growth?
China is Leading the Market in Terms of Production.
7. Are there any restraints impacting market growth?
; Volatility in the Prices; Adverse Weather Conditions Affecting Yield.
8. Can you provide examples of recent developments in the market?
N/A
9. What pricing options are available for accessing the report?
Pricing options include single-user, multi-user, and enterprise licenses priced at USD 4750, USD 5250, and USD 8750 respectively.
10. Is the market size provided in terms of value or volume?
The market size is provided in terms of value, measured in Million.
11. Are there any specific market keywords associated with the report?
Yes, the market keyword associated with the report is "Peaches and Nectarines Industry," which aids in identifying and referencing the specific market segment covered.
12. How do I determine which pricing option suits my needs best?
The pricing options vary based on user requirements and access needs. Individual users may opt for single-user licenses, while businesses requiring broader access may choose multi-user or enterprise licenses for cost-effective access to the report.
13. Are there any additional resources or data provided in the Peaches and Nectarines Industry report?
While the report offers comprehensive insights, it's advisable to review the specific contents or supplementary materials provided to ascertain if additional resources or data are available.
14. How can I stay updated on further developments or reports in the Peaches and Nectarines Industry?
To stay informed about further developments, trends, and reports in the Peaches and Nectarines Industry, consider subscribing to industry newsletters, following relevant companies and organizations, or regularly checking reputable industry news sources and publications.
Methodology
Step 1 - Identification of Relevant Samples Size from Population Database


Step 2 - Approaches for Defining Global Market Size (Value, Volume* & Price*)

Note*: In applicable scenarios
Step 3 - Data Sources
Primary Research
- Web Analytics
- Survey Reports
- Research Institute
- Latest Research Reports
- Opinion Leaders
Secondary Research
- Annual Reports
- White Paper
- Latest Press Release
- Industry Association
- Paid Database
- Investor Presentations

Step 4 - Data Triangulation
Involves using different sources of information in order to increase the validity of a study
These sources are likely to be stakeholders in a program - participants, other researchers, program staff, other community members, and so on.
Then we put all data in single framework & apply various statistical tools to find out the dynamic on the market.
During the analysis stage, feedback from the stakeholder groups would be compared to determine areas of agreement as well as areas of divergence


