
Key Insights
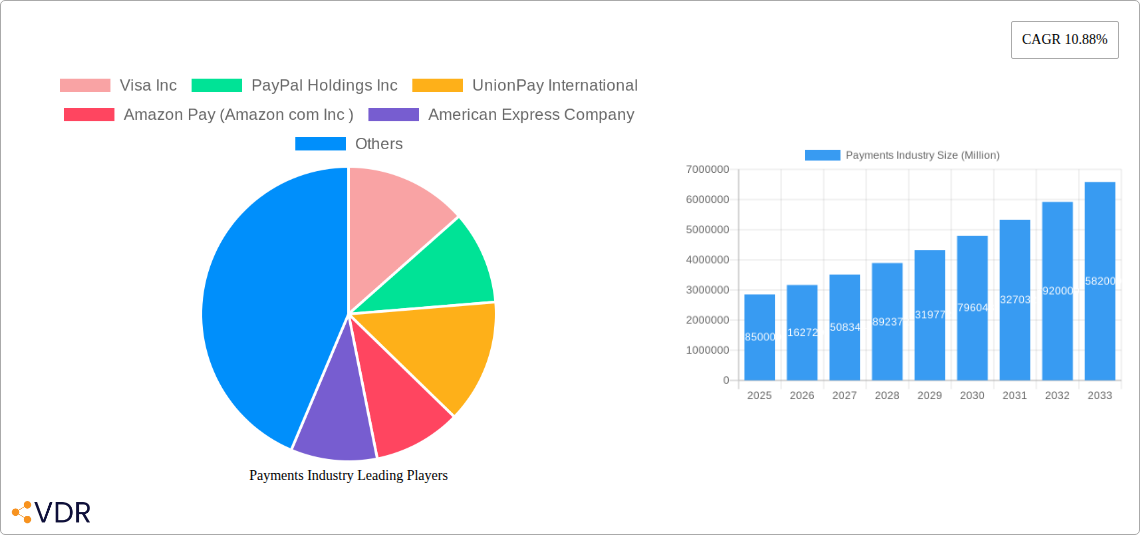
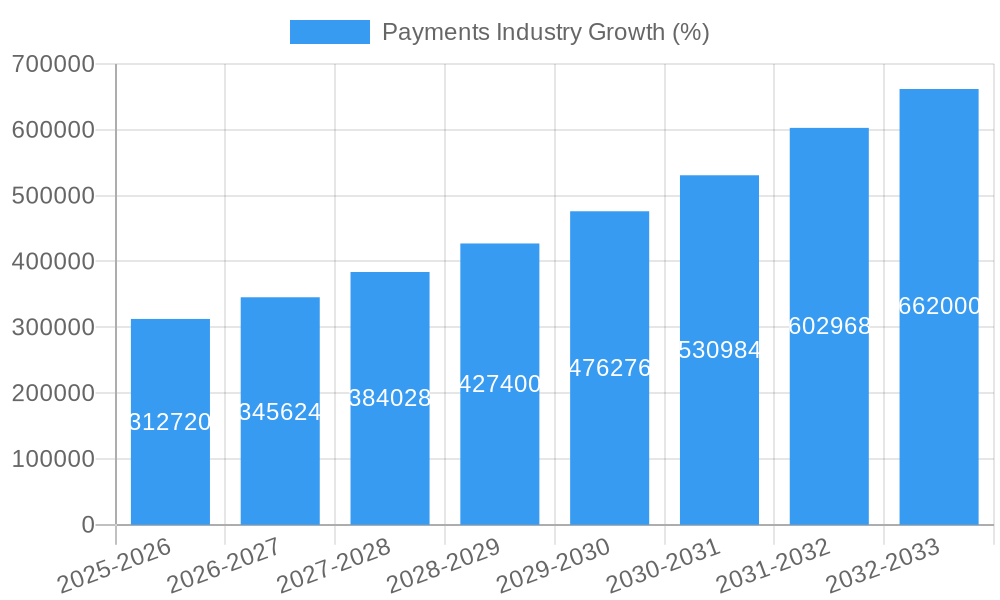
The global payments industry, currently valued at $2.85 trillion in 2025, is experiencing robust growth, projected to expand at a compound annual growth rate (CAGR) of 10.88% from 2025 to 2033. This expansion is driven by several key factors. The increasing adoption of e-commerce and digital transactions fuels demand for secure and efficient online payment solutions. Furthermore, the rise of mobile payment technologies, coupled with the growing penetration of smartphones and internet connectivity globally, particularly in emerging markets, is significantly boosting the industry's trajectory. Innovation in areas such as contactless payments, biometric authentication, and embedded finance is further accelerating growth. The industry's segmentation reflects this diverse landscape; retail, entertainment, and healthcare sectors are significant contributors, with online sales rapidly gaining market share compared to traditional point-of-sale transactions. Competition is fierce, with major players like Visa, Mastercard, PayPal, and emerging fintech companies vying for market dominance through strategic partnerships, technological advancements, and expansion into new geographical markets.
The restraints on growth include concerns surrounding data security and fraud prevention, regulatory hurdles in different jurisdictions impacting cross-border payments, and the need for greater financial inclusion in under-served populations. However, the overall positive trajectory suggests that the payments industry will continue its strong performance in the coming years. The projected growth necessitates continuous innovation and adaptation to evolving consumer preferences and technological advancements. The industry's future success hinges on its ability to offer secure, convenient, and accessible payment solutions that cater to the diversifying needs of a globalized and increasingly digital world. The continued expansion into emerging markets will be crucial for maintaining the projected CAGR.
Payments Industry Market Report: 2019-2033
This comprehensive report provides an in-depth analysis of the global payments industry, encompassing market dynamics, growth trends, dominant segments, and key players. With a study period spanning 2019-2033, a base year of 2025, and an estimated year of 2025, this report offers invaluable insights for businesses, investors, and industry professionals seeking to navigate this rapidly evolving landscape. The report covers parent markets (e.g., Fintech) and child markets (e.g., mobile payments) for a more comprehensive understanding. Market values are presented in millions of units.
Payments Industry Market Dynamics & Structure
The global payments industry is characterized by high concentration amongst major players, intense competition, and rapid technological innovation. Market consolidation through mergers and acquisitions (M&A) is a significant trend, alongside evolving regulatory landscapes and the emergence of new payment technologies. The industry is witnessing a shift towards digital payments, driven by increasing smartphone penetration and evolving consumer preferences. Competition is fierce, with existing players facing challenges from new entrants disrupting traditional business models.
- Market Concentration: The top 5 players (Visa, Mastercard, PayPal, Alipay, and UnionPay) hold approximately xx% of the global market share in 2025.
- Technological Innovation: The adoption of technologies like blockchain, AI, and biometric authentication is transforming payment processing.
- Regulatory Framework: Stringent regulations regarding data privacy, security, and cross-border payments pose significant challenges and opportunities.
- Competitive Product Substitutes: The rise of cryptocurrencies and alternative payment methods presents a competitive challenge to traditional players.
- End-User Demographics: The increasing adoption of digital payments among younger generations is driving market growth.
- M&A Trends: The number of M&A deals in the payments industry has increased by xx% from 2020 to 2024, suggesting consolidation and expansion strategies by major players.
Payments Industry Growth Trends & Insights
The global payments industry is experiencing robust growth, driven by factors such as increasing e-commerce adoption, rising smartphone penetration, and the expansion of digital financial services. The market size is projected to reach xx million in 2025, exhibiting a Compound Annual Growth Rate (CAGR) of xx% during the forecast period (2025-2033). This growth is fueled by technological disruptions, such as the adoption of mobile wallets and contactless payments, which are reshaping consumer behavior and payment preferences. The increasing adoption of Buy Now Pay Later (BNPL) schemes and embedded finance solutions further contribute to market expansion. Market penetration of digital payments is expected to reach xx% by 2033.
Dominant Regions, Countries, or Segments in Payments Industry
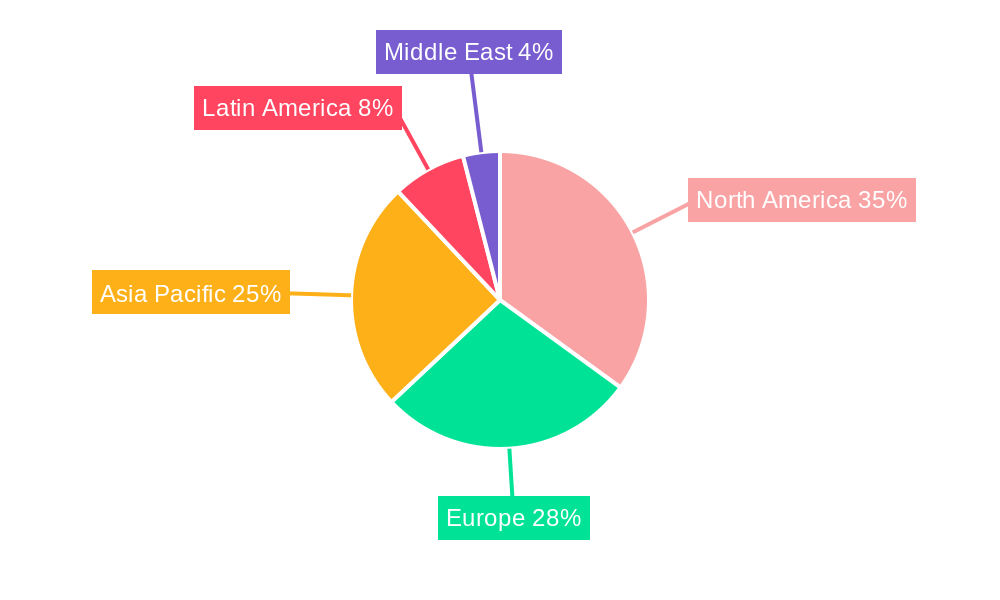
North America and Asia-Pacific are currently the dominant regions in the global payments industry, holding a combined market share of approximately xx% in 2025. Within these regions, countries like the US, China, and India are major growth drivers due to high e-commerce penetration and increasing adoption of digital financial services.
By Mode of Payment:
- Point of Sale (POS): The POS segment continues to be a significant contributor to market growth, with contactless payments gaining traction.
- Online Sale: The online sales segment is experiencing rapid growth, driven by the increasing popularity of e-commerce.
By End-user Industry:
- Retail: The retail sector is a major driver, with a projected market value of xx million in 2025.
- Entertainment: The entertainment industry exhibits significant growth potential with increasing online streaming and digital ticket sales.
- Healthcare: The healthcare sector demonstrates strong growth prospects driven by increasing telehealth adoption and digital health payments.
- Hospitality: The hospitality sector's growth is driven by the rising adoption of mobile payments and online booking platforms.
Payments Industry Product Landscape
The payments industry landscape is characterized by a wide array of products, including credit and debit cards, mobile wallets, online payment gateways, and digital payment platforms. Innovation focuses on enhancing security features, improving user experience, and expanding functionalities. The adoption of biometric authentication, tokenization, and AI-powered fraud detection systems is driving product innovation and differentiation.
Key Drivers, Barriers & Challenges in Payments Industry
Key Drivers:
- The widespread adoption of smartphones and mobile internet penetration.
- Increasing e-commerce transactions and online shopping.
- Government initiatives and policies promoting digital financial inclusion.
Key Challenges:
- Security concerns and the risk of cyberattacks remain major obstacles to growth.
- Regulatory compliance and cross-border payment complexities impede market expansion.
- Intense competition and the emergence of new payment technologies create pressure on margins.
Emerging Opportunities in Payments Industry
- The growth of embedded finance solutions within various platforms.
- Expansion of payment solutions into underserved markets and developing economies.
- Increasing demand for open banking and API-based payment solutions.
Growth Accelerators in the Payments Industry
Technological advancements, such as the adoption of blockchain and AI, are key catalysts driving long-term industry growth. Strategic partnerships and collaborations among payment processors, financial institutions, and technology companies are crucial for expanding market reach. Market expansion into emerging economies with high growth potential further accelerates overall industry growth.
Key Players Shaping the Payments Industry Market
- Visa Inc
- PayPal Holdings Inc
- UnionPay International
- Amazon Pay (Amazon com Inc)
- American Express Company
- Mastercard Inc
- AliPay (Alibaba Group)
- Apple Pay (Apple Inc)
- Adyen
- Google Pay (Google LLC)
Notable Milestones in Payments Industry Sector
- October 2023: Square Capital LLC launched Tap to Pay on iPhone in Australia.
- July 2023: Grow Finance partnered with Pismo to issue Mastercard credit cards for Australian small businesses.
- April 2023: Stripe launched unified commerce solutions for Australia.
In-Depth Payments Industry Market Outlook
The payments industry is poised for continued strong growth, driven by ongoing technological advancements, expanding digital adoption, and increased demand for seamless and secure payment solutions. Strategic partnerships, expansion into new markets, and the development of innovative payment products will shape future market dynamics. The potential for growth remains significant, particularly in emerging markets and new payment technology areas like embedded finance.
Payments Industry Segmentation
-
1. Mode of Payment
-
1.1. Point of Sale
- 1.1.1. Card Pay
- 1.1.2. Digital Wallet (includes Mobile Wallets)
- 1.1.3. Cash
- 1.1.4. Other Points of Sale
-
1.2. Online Sale
- 1.2.1. Other On
-
1.1. Point of Sale
-
2. End-user Industry
- 2.1. Retail
- 2.2. Entertainment
- 2.3. Healthcare
- 2.4. Hospitality
- 2.5. Other End-user Industries
Payments Industry Segmentation By Geography
- 1. North America
- 2. Europe
- 3. Asia Pacific
- 4. Latin America
- 5. Middle East
Payments Industry REPORT HIGHLIGHTS
| Aspects | Details |
|---|---|
| Study Period | 2019-2033 |
| Base Year | 2024 |
| Estimated Year | 2025 |
| Forecast Period | 2025-2033 |
| Historical Period | 2019-2024 |
| Growth Rate | CAGR of 10.88% from 2019-2033 |
| Segmentation |
|
Table of Contents
- 1. Introduction
- 1.1. Research Scope
- 1.2. Market Segmentation
- 1.3. Research Methodology
- 1.4. Definitions and Assumptions
- 2. Executive Summary
- 2.1. Introduction
- 3. Market Dynamics
- 3.1. Introduction
- 3.2. Market Drivers
- 3.2.1. E-commerce Supported by the Rise of M-commerce is Expected to Drive the Market; Enablement Programs by Key Retailers and Government Encouraging Digitization of the Market; Growth of Real-time Payments in Various Countries
- 3.3. Market Restrains
- 3.3.1. High Implementation and Maintenance Cost
- 3.4. Market Trends
- 3.4.1. The Payments have been Sharing wide Traction Owing to Rising Retail Sector
- 4. Market Factor Analysis
- 4.1. Porters Five Forces
- 4.2. Supply/Value Chain
- 4.3. PESTEL analysis
- 4.4. Market Entropy
- 4.5. Patent/Trademark Analysis
- 5. Global Payments Industry Analysis, Insights and Forecast, 2019-2031
- 5.1. Market Analysis, Insights and Forecast - by Mode of Payment
- 5.1.1. Point of Sale
- 5.1.1.1. Card Pay
- 5.1.1.2. Digital Wallet (includes Mobile Wallets)
- 5.1.1.3. Cash
- 5.1.1.4. Other Points of Sale
- 5.1.2. Online Sale
- 5.1.2.1. Other On
- 5.1.1. Point of Sale
- 5.2. Market Analysis, Insights and Forecast - by End-user Industry
- 5.2.1. Retail
- 5.2.2. Entertainment
- 5.2.3. Healthcare
- 5.2.4. Hospitality
- 5.2.5. Other End-user Industries
- 5.3. Market Analysis, Insights and Forecast - by Region
- 5.3.1. North America
- 5.3.2. Europe
- 5.3.3. Asia Pacific
- 5.3.4. Latin America
- 5.3.5. Middle East
- 5.1. Market Analysis, Insights and Forecast - by Mode of Payment
- 6. North America Payments Industry Analysis, Insights and Forecast, 2019-2031
- 6.1. Market Analysis, Insights and Forecast - by Mode of Payment
- 6.1.1. Point of Sale
- 6.1.1.1. Card Pay
- 6.1.1.2. Digital Wallet (includes Mobile Wallets)
- 6.1.1.3. Cash
- 6.1.1.4. Other Points of Sale
- 6.1.2. Online Sale
- 6.1.2.1. Other On
- 6.1.1. Point of Sale
- 6.2. Market Analysis, Insights and Forecast - by End-user Industry
- 6.2.1. Retail
- 6.2.2. Entertainment
- 6.2.3. Healthcare
- 6.2.4. Hospitality
- 6.2.5. Other End-user Industries
- 6.1. Market Analysis, Insights and Forecast - by Mode of Payment
- 7. Europe Payments Industry Analysis, Insights and Forecast, 2019-2031
- 7.1. Market Analysis, Insights and Forecast - by Mode of Payment
- 7.1.1. Point of Sale
- 7.1.1.1. Card Pay
- 7.1.1.2. Digital Wallet (includes Mobile Wallets)
- 7.1.1.3. Cash
- 7.1.1.4. Other Points of Sale
- 7.1.2. Online Sale
- 7.1.2.1. Other On
- 7.1.1. Point of Sale
- 7.2. Market Analysis, Insights and Forecast - by End-user Industry
- 7.2.1. Retail
- 7.2.2. Entertainment
- 7.2.3. Healthcare
- 7.2.4. Hospitality
- 7.2.5. Other End-user Industries
- 7.1. Market Analysis, Insights and Forecast - by Mode of Payment
- 8. Asia Pacific Payments Industry Analysis, Insights and Forecast, 2019-2031
- 8.1. Market Analysis, Insights and Forecast - by Mode of Payment
- 8.1.1. Point of Sale
- 8.1.1.1. Card Pay
- 8.1.1.2. Digital Wallet (includes Mobile Wallets)
- 8.1.1.3. Cash
- 8.1.1.4. Other Points of Sale
- 8.1.2. Online Sale
- 8.1.2.1. Other On
- 8.1.1. Point of Sale
- 8.2. Market Analysis, Insights and Forecast - by End-user Industry
- 8.2.1. Retail
- 8.2.2. Entertainment
- 8.2.3. Healthcare
- 8.2.4. Hospitality
- 8.2.5. Other End-user Industries
- 8.1. Market Analysis, Insights and Forecast - by Mode of Payment
- 9. Latin America Payments Industry Analysis, Insights and Forecast, 2019-2031
- 9.1. Market Analysis, Insights and Forecast - by Mode of Payment
- 9.1.1. Point of Sale
- 9.1.1.1. Card Pay
- 9.1.1.2. Digital Wallet (includes Mobile Wallets)
- 9.1.1.3. Cash
- 9.1.1.4. Other Points of Sale
- 9.1.2. Online Sale
- 9.1.2.1. Other On
- 9.1.1. Point of Sale
- 9.2. Market Analysis, Insights and Forecast - by End-user Industry
- 9.2.1. Retail
- 9.2.2. Entertainment
- 9.2.3. Healthcare
- 9.2.4. Hospitality
- 9.2.5. Other End-user Industries
- 9.1. Market Analysis, Insights and Forecast - by Mode of Payment
- 10. Middle East Payments Industry Analysis, Insights and Forecast, 2019-2031
- 10.1. Market Analysis, Insights and Forecast - by Mode of Payment
- 10.1.1. Point of Sale
- 10.1.1.1. Card Pay
- 10.1.1.2. Digital Wallet (includes Mobile Wallets)
- 10.1.1.3. Cash
- 10.1.1.4. Other Points of Sale
- 10.1.2. Online Sale
- 10.1.2.1. Other On
- 10.1.1. Point of Sale
- 10.2. Market Analysis, Insights and Forecast - by End-user Industry
- 10.2.1. Retail
- 10.2.2. Entertainment
- 10.2.3. Healthcare
- 10.2.4. Hospitality
- 10.2.5. Other End-user Industries
- 10.1. Market Analysis, Insights and Forecast - by Mode of Payment
- 11. North America Payments Industry Analysis, Insights and Forecast, 2019-2031
- 11.1. Market Analysis, Insights and Forecast - By Country/Sub-region
- 11.1.1.
- 12. Europe Payments Industry Analysis, Insights and Forecast, 2019-2031
- 12.1. Market Analysis, Insights and Forecast - By Country/Sub-region
- 12.1.1.
- 13. Asia Pacific Payments Industry Analysis, Insights and Forecast, 2019-2031
- 13.1. Market Analysis, Insights and Forecast - By Country/Sub-region
- 13.1.1.
- 14. Latin America Payments Industry Analysis, Insights and Forecast, 2019-2031
- 14.1. Market Analysis, Insights and Forecast - By Country/Sub-region
- 14.1.1.
- 15. Middle East Payments Industry Analysis, Insights and Forecast, 2019-2031
- 15.1. Market Analysis, Insights and Forecast - By Country/Sub-region
- 15.1.1.
- 16. Competitive Analysis
- 16.1. Global Market Share Analysis 2024
- 16.2. Company Profiles
- 16.2.1 Visa Inc
- 16.2.1.1. Overview
- 16.2.1.2. Products
- 16.2.1.3. SWOT Analysis
- 16.2.1.4. Recent Developments
- 16.2.1.5. Financials (Based on Availability)
- 16.2.2 PayPal Holdings Inc
- 16.2.2.1. Overview
- 16.2.2.2. Products
- 16.2.2.3. SWOT Analysis
- 16.2.2.4. Recent Developments
- 16.2.2.5. Financials (Based on Availability)
- 16.2.3 UnionPay International
- 16.2.3.1. Overview
- 16.2.3.2. Products
- 16.2.3.3. SWOT Analysis
- 16.2.3.4. Recent Developments
- 16.2.3.5. Financials (Based on Availability)
- 16.2.4 Amazon Pay (Amazon com Inc )
- 16.2.4.1. Overview
- 16.2.4.2. Products
- 16.2.4.3. SWOT Analysis
- 16.2.4.4. Recent Developments
- 16.2.4.5. Financials (Based on Availability)
- 16.2.5 American Express Company
- 16.2.5.1. Overview
- 16.2.5.2. Products
- 16.2.5.3. SWOT Analysis
- 16.2.5.4. Recent Developments
- 16.2.5.5. Financials (Based on Availability)
- 16.2.6 Mastercard Inc
- 16.2.6.1. Overview
- 16.2.6.2. Products
- 16.2.6.3. SWOT Analysis
- 16.2.6.4. Recent Developments
- 16.2.6.5. Financials (Based on Availability)
- 16.2.7 AliPay (Alibaba Group)
- 16.2.7.1. Overview
- 16.2.7.2. Products
- 16.2.7.3. SWOT Analysis
- 16.2.7.4. Recent Developments
- 16.2.7.5. Financials (Based on Availability)
- 16.2.8 Apple Pay (Apple Inc )
- 16.2.8.1. Overview
- 16.2.8.2. Products
- 16.2.8.3. SWOT Analysis
- 16.2.8.4. Recent Developments
- 16.2.8.5. Financials (Based on Availability)
- 16.2.9 Adyen*List Not Exhaustive
- 16.2.9.1. Overview
- 16.2.9.2. Products
- 16.2.9.3. SWOT Analysis
- 16.2.9.4. Recent Developments
- 16.2.9.5. Financials (Based on Availability)
- 16.2.10 Google Pay (Google LLC)
- 16.2.10.1. Overview
- 16.2.10.2. Products
- 16.2.10.3. SWOT Analysis
- 16.2.10.4. Recent Developments
- 16.2.10.5. Financials (Based on Availability)
- 16.2.1 Visa Inc
List of Figures
- Figure 1: Global Payments Industry Revenue Breakdown (Million, %) by Region 2024 & 2032
- Figure 2: North America Payments Industry Revenue (Million), by Country 2024 & 2032
- Figure 3: North America Payments Industry Revenue Share (%), by Country 2024 & 2032
- Figure 4: Europe Payments Industry Revenue (Million), by Country 2024 & 2032
- Figure 5: Europe Payments Industry Revenue Share (%), by Country 2024 & 2032
- Figure 6: Asia Pacific Payments Industry Revenue (Million), by Country 2024 & 2032
- Figure 7: Asia Pacific Payments Industry Revenue Share (%), by Country 2024 & 2032
- Figure 8: Latin America Payments Industry Revenue (Million), by Country 2024 & 2032
- Figure 9: Latin America Payments Industry Revenue Share (%), by Country 2024 & 2032
- Figure 10: Middle East Payments Industry Revenue (Million), by Country 2024 & 2032
- Figure 11: Middle East Payments Industry Revenue Share (%), by Country 2024 & 2032
- Figure 12: North America Payments Industry Revenue (Million), by Mode of Payment 2024 & 2032
- Figure 13: North America Payments Industry Revenue Share (%), by Mode of Payment 2024 & 2032
- Figure 14: North America Payments Industry Revenue (Million), by End-user Industry 2024 & 2032
- Figure 15: North America Payments Industry Revenue Share (%), by End-user Industry 2024 & 2032
- Figure 16: North America Payments Industry Revenue (Million), by Country 2024 & 2032
- Figure 17: North America Payments Industry Revenue Share (%), by Country 2024 & 2032
- Figure 18: Europe Payments Industry Revenue (Million), by Mode of Payment 2024 & 2032
- Figure 19: Europe Payments Industry Revenue Share (%), by Mode of Payment 2024 & 2032
- Figure 20: Europe Payments Industry Revenue (Million), by End-user Industry 2024 & 2032
- Figure 21: Europe Payments Industry Revenue Share (%), by End-user Industry 2024 & 2032
- Figure 22: Europe Payments Industry Revenue (Million), by Country 2024 & 2032
- Figure 23: Europe Payments Industry Revenue Share (%), by Country 2024 & 2032
- Figure 24: Asia Pacific Payments Industry Revenue (Million), by Mode of Payment 2024 & 2032
- Figure 25: Asia Pacific Payments Industry Revenue Share (%), by Mode of Payment 2024 & 2032
- Figure 26: Asia Pacific Payments Industry Revenue (Million), by End-user Industry 2024 & 2032
- Figure 27: Asia Pacific Payments Industry Revenue Share (%), by End-user Industry 2024 & 2032
- Figure 28: Asia Pacific Payments Industry Revenue (Million), by Country 2024 & 2032
- Figure 29: Asia Pacific Payments Industry Revenue Share (%), by Country 2024 & 2032
- Figure 30: Latin America Payments Industry Revenue (Million), by Mode of Payment 2024 & 2032
- Figure 31: Latin America Payments Industry Revenue Share (%), by Mode of Payment 2024 & 2032
- Figure 32: Latin America Payments Industry Revenue (Million), by End-user Industry 2024 & 2032
- Figure 33: Latin America Payments Industry Revenue Share (%), by End-user Industry 2024 & 2032
- Figure 34: Latin America Payments Industry Revenue (Million), by Country 2024 & 2032
- Figure 35: Latin America Payments Industry Revenue Share (%), by Country 2024 & 2032
- Figure 36: Middle East Payments Industry Revenue (Million), by Mode of Payment 2024 & 2032
- Figure 37: Middle East Payments Industry Revenue Share (%), by Mode of Payment 2024 & 2032
- Figure 38: Middle East Payments Industry Revenue (Million), by End-user Industry 2024 & 2032
- Figure 39: Middle East Payments Industry Revenue Share (%), by End-user Industry 2024 & 2032
- Figure 40: Middle East Payments Industry Revenue (Million), by Country 2024 & 2032
- Figure 41: Middle East Payments Industry Revenue Share (%), by Country 2024 & 2032
List of Tables
- Table 1: Global Payments Industry Revenue Million Forecast, by Region 2019 & 2032
- Table 2: Global Payments Industry Revenue Million Forecast, by Mode of Payment 2019 & 2032
- Table 3: Global Payments Industry Revenue Million Forecast, by End-user Industry 2019 & 2032
- Table 4: Global Payments Industry Revenue Million Forecast, by Region 2019 & 2032
- Table 5: Global Payments Industry Revenue Million Forecast, by Country 2019 & 2032
- Table 6: Payments Industry Revenue (Million) Forecast, by Application 2019 & 2032
- Table 7: Global Payments Industry Revenue Million Forecast, by Country 2019 & 2032
- Table 8: Payments Industry Revenue (Million) Forecast, by Application 2019 & 2032
- Table 9: Global Payments Industry Revenue Million Forecast, by Country 2019 & 2032
- Table 10: Payments Industry Revenue (Million) Forecast, by Application 2019 & 2032
- Table 11: Global Payments Industry Revenue Million Forecast, by Country 2019 & 2032
- Table 12: Payments Industry Revenue (Million) Forecast, by Application 2019 & 2032
- Table 13: Global Payments Industry Revenue Million Forecast, by Country 2019 & 2032
- Table 14: Payments Industry Revenue (Million) Forecast, by Application 2019 & 2032
- Table 15: Global Payments Industry Revenue Million Forecast, by Mode of Payment 2019 & 2032
- Table 16: Global Payments Industry Revenue Million Forecast, by End-user Industry 2019 & 2032
- Table 17: Global Payments Industry Revenue Million Forecast, by Country 2019 & 2032
- Table 18: Global Payments Industry Revenue Million Forecast, by Mode of Payment 2019 & 2032
- Table 19: Global Payments Industry Revenue Million Forecast, by End-user Industry 2019 & 2032
- Table 20: Global Payments Industry Revenue Million Forecast, by Country 2019 & 2032
- Table 21: Global Payments Industry Revenue Million Forecast, by Mode of Payment 2019 & 2032
- Table 22: Global Payments Industry Revenue Million Forecast, by End-user Industry 2019 & 2032
- Table 23: Global Payments Industry Revenue Million Forecast, by Country 2019 & 2032
- Table 24: Global Payments Industry Revenue Million Forecast, by Mode of Payment 2019 & 2032
- Table 25: Global Payments Industry Revenue Million Forecast, by End-user Industry 2019 & 2032
- Table 26: Global Payments Industry Revenue Million Forecast, by Country 2019 & 2032
- Table 27: Global Payments Industry Revenue Million Forecast, by Mode of Payment 2019 & 2032
- Table 28: Global Payments Industry Revenue Million Forecast, by End-user Industry 2019 & 2032
- Table 29: Global Payments Industry Revenue Million Forecast, by Country 2019 & 2032
Frequently Asked Questions
1. What is the projected Compound Annual Growth Rate (CAGR) of the Payments Industry?
The projected CAGR is approximately 10.88%.
2. Which companies are prominent players in the Payments Industry?
Key companies in the market include Visa Inc, PayPal Holdings Inc, UnionPay International, Amazon Pay (Amazon com Inc ), American Express Company, Mastercard Inc, AliPay (Alibaba Group), Apple Pay (Apple Inc ), Adyen*List Not Exhaustive, Google Pay (Google LLC).
3. What are the main segments of the Payments Industry?
The market segments include Mode of Payment, End-user Industry.
4. Can you provide details about the market size?
The market size is estimated to be USD 2.85 Million as of 2022.
5. What are some drivers contributing to market growth?
E-commerce Supported by the Rise of M-commerce is Expected to Drive the Market; Enablement Programs by Key Retailers and Government Encouraging Digitization of the Market; Growth of Real-time Payments in Various Countries.
6. What are the notable trends driving market growth?
The Payments have been Sharing wide Traction Owing to Rising Retail Sector.
7. Are there any restraints impacting market growth?
High Implementation and Maintenance Cost.
8. Can you provide examples of recent developments in the market?
October 2023 - Square Capital LLC announced the debut of Tap to Pay on iPhone in Australia, where Square would make the technology available to its sellers. Tap to Pay on iPhone is available in the Square Point of Sale, Square for Retail, and Square Appointments iOS apps. It allows vendors of all sizes to accept contactless payments directly from their iPhones, with no additional hardware required or expense.
9. What pricing options are available for accessing the report?
Pricing options include single-user, multi-user, and enterprise licenses priced at USD 4750, USD 5250, and USD 8750 respectively.
10. Is the market size provided in terms of value or volume?
The market size is provided in terms of value, measured in Million.
11. Are there any specific market keywords associated with the report?
Yes, the market keyword associated with the report is "Payments Industry," which aids in identifying and referencing the specific market segment covered.
12. How do I determine which pricing option suits my needs best?
The pricing options vary based on user requirements and access needs. Individual users may opt for single-user licenses, while businesses requiring broader access may choose multi-user or enterprise licenses for cost-effective access to the report.
13. Are there any additional resources or data provided in the Payments Industry report?
While the report offers comprehensive insights, it's advisable to review the specific contents or supplementary materials provided to ascertain if additional resources or data are available.
14. How can I stay updated on further developments or reports in the Payments Industry?
To stay informed about further developments, trends, and reports in the Payments Industry, consider subscribing to industry newsletters, following relevant companies and organizations, or regularly checking reputable industry news sources and publications.
Methodology
Step 1 - Identification of Relevant Samples Size from Population Database


Step 2 - Approaches for Defining Global Market Size (Value, Volume* & Price*)

Note*: In applicable scenarios
Step 3 - Data Sources
Primary Research
- Web Analytics
- Survey Reports
- Research Institute
- Latest Research Reports
- Opinion Leaders
Secondary Research
- Annual Reports
- White Paper
- Latest Press Release
- Industry Association
- Paid Database
- Investor Presentations

Step 4 - Data Triangulation
Involves using different sources of information in order to increase the validity of a study
These sources are likely to be stakeholders in a program - participants, other researchers, program staff, other community members, and so on.
Then we put all data in single framework & apply various statistical tools to find out the dynamic on the market.
During the analysis stage, feedback from the stakeholder groups would be compared to determine areas of agreement as well as areas of divergence


