
Key Insights
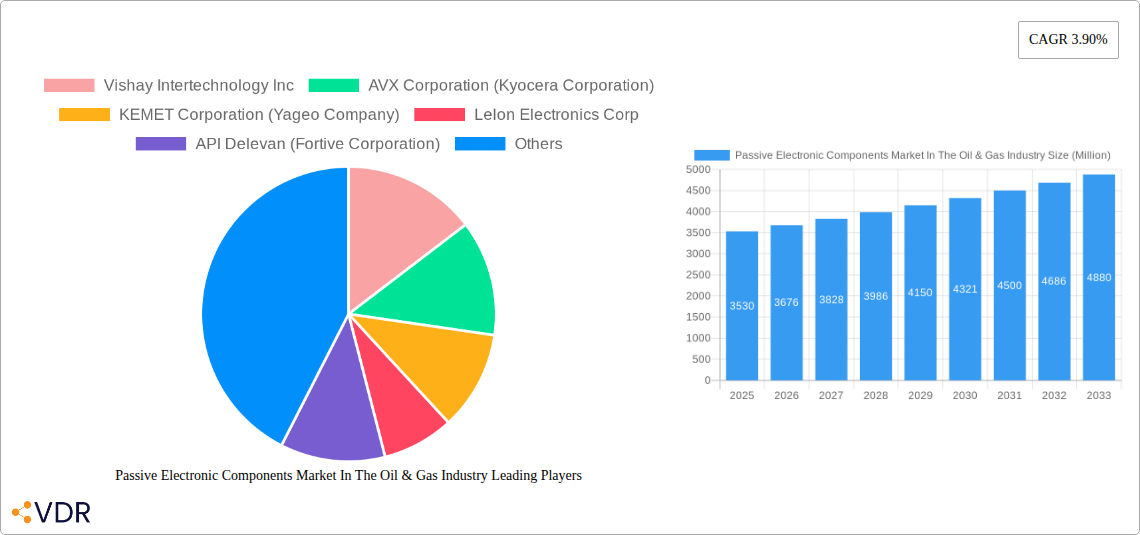
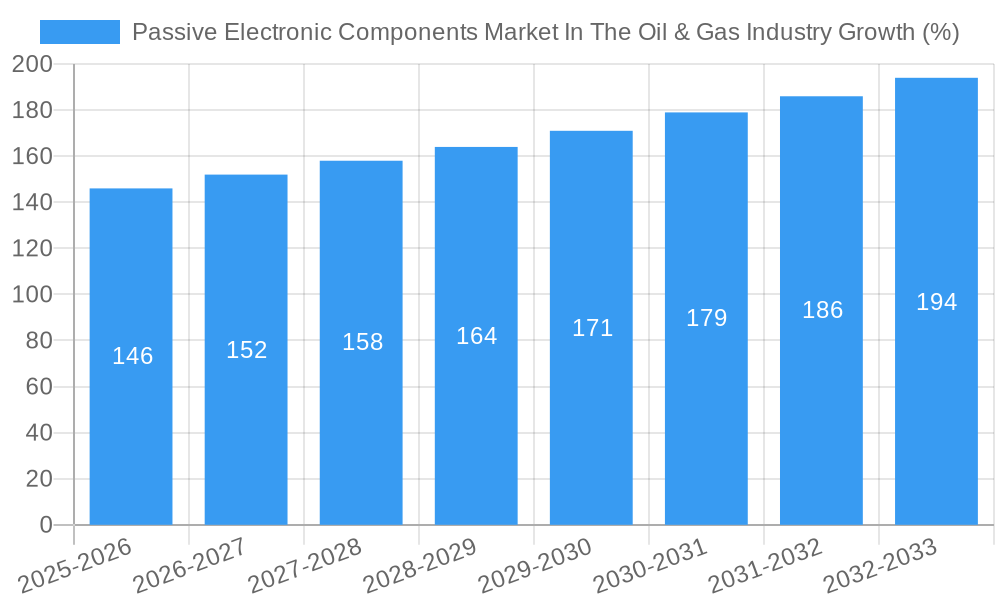
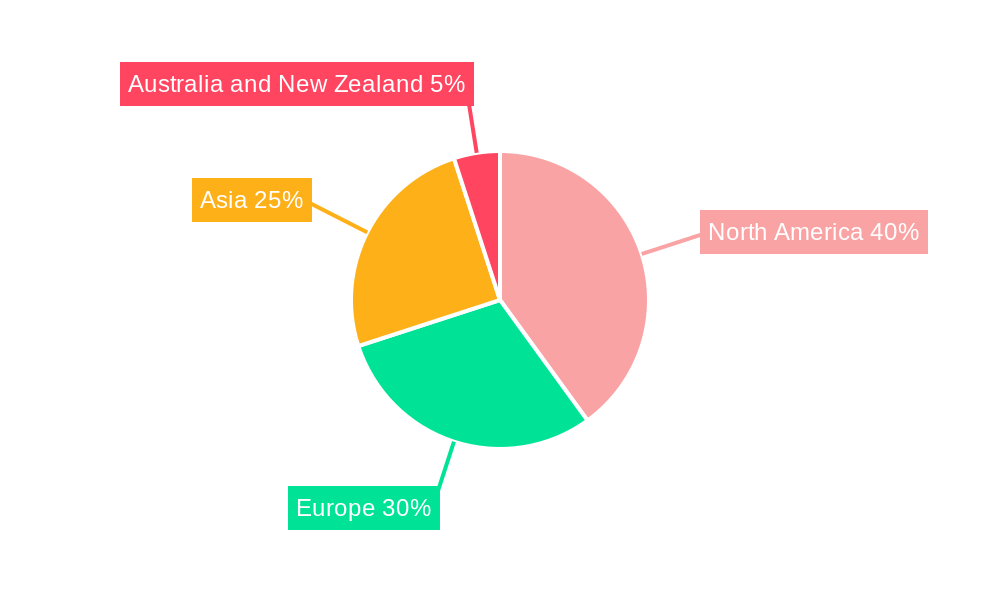
The Passive Electronic Components (PEC) market within the Oil & Gas industry is experiencing steady growth, projected at a Compound Annual Growth Rate (CAGR) of 3.90% from 2025 to 2033. The 2025 market size is estimated at $3.53 billion, indicating a substantial demand for capacitors, inductors, and resistors in oil and gas operations. This growth is fueled by several key drivers, including the increasing adoption of automation and advanced technologies in exploration, production, and refining processes. The demand for reliable and durable PECs is high due to the harsh operating conditions and safety-critical nature of oil and gas infrastructure. Furthermore, the ongoing expansion of offshore drilling and the increasing need for efficient energy production are significant contributors to market expansion. Technological advancements leading to smaller, more efficient, and robust components are further boosting market growth. However, factors such as price fluctuations in raw materials and the cyclical nature of the oil and gas industry pose potential restraints to market expansion. Segmentation analysis reveals that capacitors hold the largest market share due to their widespread use in power electronics and control systems within oil and gas facilities. Key players like Vishay Intertechnology, AVX Corporation, and KEMET Corporation are driving innovation and competition, leading to a diverse and competitive market landscape. Geographic analysis suggests strong market presence in North America and Europe, driven by established oil and gas infrastructure and stringent safety regulations. Asia, however, is expected to exhibit significant growth in the coming years due to ongoing infrastructure development and increasing energy demand in the region.
The forecast period of 2025-2033 presents lucrative opportunities for PEC manufacturers to capitalize on the expanding market. Strategic partnerships with oil and gas companies, investments in research and development to meet the demanding operational requirements, and a focus on providing customized solutions tailored to specific applications are vital for success. The increasing demand for energy-efficient solutions will drive further innovation in PEC technology. While challenges remain, the long-term outlook for the PEC market within the oil and gas industry remains positive, driven by the sustained need for reliable and efficient electronic components within this critical sector. The market's robustness is underpinned by the fundamental role of PECs in enabling advanced technologies, enhancing safety, and optimizing energy production.
Passive Electronic Components Market in the Oil & Gas Industry: A Comprehensive Report (2019-2033)
This comprehensive report provides an in-depth analysis of the Passive Electronic Components market within the Oil & Gas industry, offering crucial insights for strategic decision-making. The study covers the period 2019-2033, with a base year of 2025 and a forecast period spanning 2025-2033. The report meticulously examines market dynamics, growth trends, regional performance, key players, and emerging opportunities, empowering stakeholders to navigate this dynamic sector effectively. The market is segmented by type: Capacitor, Inductor, and Resistor. The total market size is predicted to reach xx Million units by 2033.
Passive Electronic Components Market in the Oil & Gas Industry Market Dynamics & Structure
The Passive Electronic Components market in the Oil & Gas sector is characterized by moderate concentration, with several key players holding significant market share. Technological innovation, driven by the need for enhanced efficiency and safety in oil and gas operations, is a primary growth driver. Stringent regulatory frameworks regarding safety and environmental compliance further shape market dynamics. The market witnesses ongoing M&A activity, with larger players consolidating their position through acquisitions of smaller companies specializing in niche technologies. Competitive substitutes include alternative energy sources and technological advancements in energy management, although these pose limited threats currently.
- Market Concentration: Moderately concentrated, with top 5 players holding approximately xx% market share in 2024.
- Technological Innovation: Focus on miniaturization, increased efficiency, and improved durability of components.
- Regulatory Framework: Stringent safety and environmental regulations influence component selection and lifespan requirements.
- Competitive Substitutes: Limited direct substitutes, but pressure from alternative energy technologies and increased energy efficiency solutions.
- End-User Demographics: Primarily large oil and gas companies and their subcontractors, with increasing adoption in smaller independent operators.
- M&A Trends: Consolidation expected to continue, driven by the pursuit of technological expertise and market expansion. Approximately xx M&A deals were recorded between 2019 and 2024.
Passive Electronic Components Market in the Oil & Gas Industry Growth Trends & Insights
The Passive Electronic Components market within the Oil & Gas industry exhibits steady growth, driven by increasing demand for sophisticated equipment, automation of operations, and the expansion of existing and new oil & gas infrastructure. The market size is projected to grow at a CAGR of xx% during the forecast period (2025-2033), reaching xx Million units by 2033. This growth is fueled by ongoing technological advancements, which lead to enhanced performance and reliability of electronic components used in demanding Oil & Gas environments. The adoption rate of advanced passive components is steadily increasing, driven by the benefits of improved energy efficiency, safety, and operational reliability. Shifting consumer behavior towards environmentally friendly solutions and increased demand for sustainable energy practices indirectly boosts demand for efficient equipment in the Oil & Gas sector.
Dominant Regions, Countries, or Segments in Passive Electronic Components Market in the Oil & Gas Industry
North America currently holds the largest market share in the Passive Electronic Components market within the Oil & Gas industry. This dominance is largely due to the significant presence of major oil and gas companies and a robust infrastructure supporting exploration and production activities. The significant growth in the Middle East is observed due to the extensive Oil & Gas activities in this region. Europe displays consistent growth, driven by government initiatives favoring energy efficiency and sustainability. Within the product segments, Capacitors represent the largest share owing to their extensive use in power conditioning and energy storage applications.
- North America: High market concentration of major oil and gas companies. Strong infrastructure development and ongoing investment in the sector.
- Middle East: Significant Oil & Gas reserves and rapid industrial development.
- Europe: Growing emphasis on energy efficiency and sustainability drives adoption of advanced components.
- Capacitors: Largest market segment due to widespread application in power conditioning and energy storage within oil & gas operations.
- Inductors: Crucial for filtering and signal processing in various Oil & Gas equipment.
- Resistors: Used in signal conditioning and circuit protection systems.
Passive Electronic Components Market in the Oil & Gas Industry Product Landscape
The market features a range of passive components tailored to the specific requirements of the Oil & Gas industry. These components are designed to withstand harsh environmental conditions, including extreme temperatures, vibration, and exposure to corrosive substances. Recent innovations focus on miniaturization, enhanced performance under high-stress conditions, and improved energy efficiency. Unique selling propositions revolve around increased reliability, extended lifespan, and compliance with stringent industry standards. Technological advancements center on materials science, leading to more robust and efficient designs.
Key Drivers, Barriers & Challenges in Passive Electronic Components Market in the Oil & Gas Industry
Key Drivers:
- Increasing demand for sophisticated Oil & Gas equipment and automation drives component needs.
- Stringent safety regulations necessitate use of high-reliability components.
- Growing focus on energy efficiency pushes demand for advanced components.
Challenges & Restraints:
- Fluctuations in oil and gas prices affect investment and component demand. A xx% decrease in oil prices can lead to a yy% decrease in market growth.
- Supply chain disruptions can impact component availability and cost.
- The high cost of specialized components can be a barrier to entry for some companies.
Emerging Opportunities in Passive Electronic Components Market in the Oil & Gas Industry
Emerging opportunities lie in the development of specialized components for harsh environments and the increasing adoption of digitalization and automation. Untapped markets exist in emerging economies with growing oil and gas sectors. Innovative applications include components for renewable energy integration within oil and gas operations, and the increasing implementation of smart sensors and monitoring systems. The shift towards remote monitoring and predictive maintenance also fuels component demand.
Growth Accelerators in the Passive Electronic Components Market in the Oil & Gas Industry
Technological breakthroughs in materials science and component design are key growth accelerators, alongside strategic partnerships between component manufacturers and oil and gas companies. Market expansion into emerging economies with growing oil and gas industries presents significant growth potential. Investments in research and development of more resilient and efficient components further propel market growth.
Key Players Shaping the Passive Electronic Components Market in the Oil & Gas Industry Market
- Vishay Intertechnology Inc
- AVX Corporation (Kyocera Corporation)
- KEMET Corporation (Yageo Company)
- Lelon Electronics Corp
- API Delevan (Fortive Corporation)
- TE Connectivity
- Cornell Dubilier Electronics Inc
- TDK Corporation
- Ohmite Manufacturing Company
- Panasonic Corporation
- Honeywell International Inc
- Eaton Corporation
Notable Milestones in Passive Electronic Components Market in the Oil & Gas Industry Sector
- March 2023: Cornell Dubilier Electronics Inc. introduced the 944L series of low inductance, high-current DC link film capacitors, enhancing power system efficiency and reducing energy loss in Oil & Gas applications.
- September 2022: TT Electronics launched the TFHP series thin film high-power chip resistors, improving precision and performance in demanding Oil & Gas environments.
In-Depth Passive Electronic Components Market in the Oil & Gas Industry Market Outlook
The future of the Passive Electronic Components market in the Oil & Gas industry is positive, with sustained growth driven by technological advancements, increasing automation, and rising demand for reliable and efficient components. Strategic partnerships, focused R&D, and expansion into emerging markets present lucrative opportunities for market players. The market is poised for considerable expansion, particularly with the integration of smart technologies and the need for robust components within a challenging operating environment.
Passive Electronic Components Market In The Oil & Gas Industry Segmentation
-
1. Type
- 1.1. Capacitor
- 1.2. Inductor
- 1.3. Resistor
Passive Electronic Components Market In The Oil & Gas Industry Segmentation By Geography
- 1. North America
- 2. Europe
- 3. Asia
- 4. Australia and New Zealand
Passive Electronic Components Market In The Oil & Gas Industry REPORT HIGHLIGHTS
| Aspects | Details |
|---|---|
| Study Period | 2019-2033 |
| Base Year | 2024 |
| Estimated Year | 2025 |
| Forecast Period | 2025-2033 |
| Historical Period | 2019-2024 |
| Growth Rate | CAGR of 3.90% from 2019-2033 |
| Segmentation |
|
Table of Contents
- 1. Introduction
- 1.1. Research Scope
- 1.2. Market Segmentation
- 1.3. Research Methodology
- 1.4. Definitions and Assumptions
- 2. Executive Summary
- 2.1. Introduction
- 3. Market Dynamics
- 3.1. Introduction
- 3.2. Market Drivers
- 3.2.1. Increasing Investments in Oil & Gas Industry
- 3.3. Market Restrains
- 3.3.1. Rising Metal Prices Impacting Component Production Costs
- 3.4. Market Trends
- 3.4.1. Increasing Invesment in Oil & Gas Industry
- 4. Market Factor Analysis
- 4.1. Porters Five Forces
- 4.2. Supply/Value Chain
- 4.3. PESTEL analysis
- 4.4. Market Entropy
- 4.5. Patent/Trademark Analysis
- 5. Global Passive Electronic Components Market In The Oil & Gas Industry Analysis, Insights and Forecast, 2019-2031
- 5.1. Market Analysis, Insights and Forecast - by Type
- 5.1.1. Capacitor
- 5.1.2. Inductor
- 5.1.3. Resistor
- 5.2. Market Analysis, Insights and Forecast - by Region
- 5.2.1. North America
- 5.2.2. Europe
- 5.2.3. Asia
- 5.2.4. Australia and New Zealand
- 5.1. Market Analysis, Insights and Forecast - by Type
- 6. North America Passive Electronic Components Market In The Oil & Gas Industry Analysis, Insights and Forecast, 2019-2031
- 6.1. Market Analysis, Insights and Forecast - by Type
- 6.1.1. Capacitor
- 6.1.2. Inductor
- 6.1.3. Resistor
- 6.1. Market Analysis, Insights and Forecast - by Type
- 7. Europe Passive Electronic Components Market In The Oil & Gas Industry Analysis, Insights and Forecast, 2019-2031
- 7.1. Market Analysis, Insights and Forecast - by Type
- 7.1.1. Capacitor
- 7.1.2. Inductor
- 7.1.3. Resistor
- 7.1. Market Analysis, Insights and Forecast - by Type
- 8. Asia Passive Electronic Components Market In The Oil & Gas Industry Analysis, Insights and Forecast, 2019-2031
- 8.1. Market Analysis, Insights and Forecast - by Type
- 8.1.1. Capacitor
- 8.1.2. Inductor
- 8.1.3. Resistor
- 8.1. Market Analysis, Insights and Forecast - by Type
- 9. Australia and New Zealand Passive Electronic Components Market In The Oil & Gas Industry Analysis, Insights and Forecast, 2019-2031
- 9.1. Market Analysis, Insights and Forecast - by Type
- 9.1.1. Capacitor
- 9.1.2. Inductor
- 9.1.3. Resistor
- 9.1. Market Analysis, Insights and Forecast - by Type
- 10. North America Passive Electronic Components Market In The Oil & Gas Industry Analysis, Insights and Forecast, 2019-2031
- 10.1. Market Analysis, Insights and Forecast - By Country/Sub-region
- 10.1.1.
- 11. Europe Passive Electronic Components Market In The Oil & Gas Industry Analysis, Insights and Forecast, 2019-2031
- 11.1. Market Analysis, Insights and Forecast - By Country/Sub-region
- 11.1.1.
- 12. Asia Passive Electronic Components Market In The Oil & Gas Industry Analysis, Insights and Forecast, 2019-2031
- 12.1. Market Analysis, Insights and Forecast - By Country/Sub-region
- 12.1.1.
- 13. Australia and New Zealand Passive Electronic Components Market In The Oil & Gas Industry Analysis, Insights and Forecast, 2019-2031
- 13.1. Market Analysis, Insights and Forecast - By Country/Sub-region
- 13.1.1.
- 14. Competitive Analysis
- 14.1. Global Market Share Analysis 2024
- 14.2. Company Profiles
- 14.2.1 Vishay Intertechnology Inc
- 14.2.1.1. Overview
- 14.2.1.2. Products
- 14.2.1.3. SWOT Analysis
- 14.2.1.4. Recent Developments
- 14.2.1.5. Financials (Based on Availability)
- 14.2.2 AVX Corporation (Kyocera Corporation)
- 14.2.2.1. Overview
- 14.2.2.2. Products
- 14.2.2.3. SWOT Analysis
- 14.2.2.4. Recent Developments
- 14.2.2.5. Financials (Based on Availability)
- 14.2.3 KEMET Corporation (Yageo Company)
- 14.2.3.1. Overview
- 14.2.3.2. Products
- 14.2.3.3. SWOT Analysis
- 14.2.3.4. Recent Developments
- 14.2.3.5. Financials (Based on Availability)
- 14.2.4 Lelon Electronics Corp
- 14.2.4.1. Overview
- 14.2.4.2. Products
- 14.2.4.3. SWOT Analysis
- 14.2.4.4. Recent Developments
- 14.2.4.5. Financials (Based on Availability)
- 14.2.5 API Delevan (Fortive Corporation)
- 14.2.5.1. Overview
- 14.2.5.2. Products
- 14.2.5.3. SWOT Analysis
- 14.2.5.4. Recent Developments
- 14.2.5.5. Financials (Based on Availability)
- 14.2.6 TE Connectivity
- 14.2.6.1. Overview
- 14.2.6.2. Products
- 14.2.6.3. SWOT Analysis
- 14.2.6.4. Recent Developments
- 14.2.6.5. Financials (Based on Availability)
- 14.2.7 Cornell Dubilier Electronics Inc
- 14.2.7.1. Overview
- 14.2.7.2. Products
- 14.2.7.3. SWOT Analysis
- 14.2.7.4. Recent Developments
- 14.2.7.5. Financials (Based on Availability)
- 14.2.8 TDK Corporation
- 14.2.8.1. Overview
- 14.2.8.2. Products
- 14.2.8.3. SWOT Analysis
- 14.2.8.4. Recent Developments
- 14.2.8.5. Financials (Based on Availability)
- 14.2.9 Ohmite Manufacturing Company
- 14.2.9.1. Overview
- 14.2.9.2. Products
- 14.2.9.3. SWOT Analysis
- 14.2.9.4. Recent Developments
- 14.2.9.5. Financials (Based on Availability)
- 14.2.10 Panasonic Corporation
- 14.2.10.1. Overview
- 14.2.10.2. Products
- 14.2.10.3. SWOT Analysis
- 14.2.10.4. Recent Developments
- 14.2.10.5. Financials (Based on Availability)
- 14.2.11 Honeywell International Inc *List Not Exhaustive
- 14.2.11.1. Overview
- 14.2.11.2. Products
- 14.2.11.3. SWOT Analysis
- 14.2.11.4. Recent Developments
- 14.2.11.5. Financials (Based on Availability)
- 14.2.12 Eaton Corporation
- 14.2.12.1. Overview
- 14.2.12.2. Products
- 14.2.12.3. SWOT Analysis
- 14.2.12.4. Recent Developments
- 14.2.12.5. Financials (Based on Availability)
- 14.2.1 Vishay Intertechnology Inc
List of Figures
- Figure 1: Global Passive Electronic Components Market In The Oil & Gas Industry Revenue Breakdown (Million, %) by Region 2024 & 2032
- Figure 2: North America Passive Electronic Components Market In The Oil & Gas Industry Revenue (Million), by Country 2024 & 2032
- Figure 3: North America Passive Electronic Components Market In The Oil & Gas Industry Revenue Share (%), by Country 2024 & 2032
- Figure 4: Europe Passive Electronic Components Market In The Oil & Gas Industry Revenue (Million), by Country 2024 & 2032
- Figure 5: Europe Passive Electronic Components Market In The Oil & Gas Industry Revenue Share (%), by Country 2024 & 2032
- Figure 6: Asia Passive Electronic Components Market In The Oil & Gas Industry Revenue (Million), by Country 2024 & 2032
- Figure 7: Asia Passive Electronic Components Market In The Oil & Gas Industry Revenue Share (%), by Country 2024 & 2032
- Figure 8: Australia and New Zealand Passive Electronic Components Market In The Oil & Gas Industry Revenue (Million), by Country 2024 & 2032
- Figure 9: Australia and New Zealand Passive Electronic Components Market In The Oil & Gas Industry Revenue Share (%), by Country 2024 & 2032
- Figure 10: North America Passive Electronic Components Market In The Oil & Gas Industry Revenue (Million), by Type 2024 & 2032
- Figure 11: North America Passive Electronic Components Market In The Oil & Gas Industry Revenue Share (%), by Type 2024 & 2032
- Figure 12: North America Passive Electronic Components Market In The Oil & Gas Industry Revenue (Million), by Country 2024 & 2032
- Figure 13: North America Passive Electronic Components Market In The Oil & Gas Industry Revenue Share (%), by Country 2024 & 2032
- Figure 14: Europe Passive Electronic Components Market In The Oil & Gas Industry Revenue (Million), by Type 2024 & 2032
- Figure 15: Europe Passive Electronic Components Market In The Oil & Gas Industry Revenue Share (%), by Type 2024 & 2032
- Figure 16: Europe Passive Electronic Components Market In The Oil & Gas Industry Revenue (Million), by Country 2024 & 2032
- Figure 17: Europe Passive Electronic Components Market In The Oil & Gas Industry Revenue Share (%), by Country 2024 & 2032
- Figure 18: Asia Passive Electronic Components Market In The Oil & Gas Industry Revenue (Million), by Type 2024 & 2032
- Figure 19: Asia Passive Electronic Components Market In The Oil & Gas Industry Revenue Share (%), by Type 2024 & 2032
- Figure 20: Asia Passive Electronic Components Market In The Oil & Gas Industry Revenue (Million), by Country 2024 & 2032
- Figure 21: Asia Passive Electronic Components Market In The Oil & Gas Industry Revenue Share (%), by Country 2024 & 2032
- Figure 22: Australia and New Zealand Passive Electronic Components Market In The Oil & Gas Industry Revenue (Million), by Type 2024 & 2032
- Figure 23: Australia and New Zealand Passive Electronic Components Market In The Oil & Gas Industry Revenue Share (%), by Type 2024 & 2032
- Figure 24: Australia and New Zealand Passive Electronic Components Market In The Oil & Gas Industry Revenue (Million), by Country 2024 & 2032
- Figure 25: Australia and New Zealand Passive Electronic Components Market In The Oil & Gas Industry Revenue Share (%), by Country 2024 & 2032
List of Tables
- Table 1: Global Passive Electronic Components Market In The Oil & Gas Industry Revenue Million Forecast, by Region 2019 & 2032
- Table 2: Global Passive Electronic Components Market In The Oil & Gas Industry Revenue Million Forecast, by Type 2019 & 2032
- Table 3: Global Passive Electronic Components Market In The Oil & Gas Industry Revenue Million Forecast, by Region 2019 & 2032
- Table 4: Global Passive Electronic Components Market In The Oil & Gas Industry Revenue Million Forecast, by Country 2019 & 2032
- Table 5: Passive Electronic Components Market In The Oil & Gas Industry Revenue (Million) Forecast, by Application 2019 & 2032
- Table 6: Global Passive Electronic Components Market In The Oil & Gas Industry Revenue Million Forecast, by Country 2019 & 2032
- Table 7: Passive Electronic Components Market In The Oil & Gas Industry Revenue (Million) Forecast, by Application 2019 & 2032
- Table 8: Global Passive Electronic Components Market In The Oil & Gas Industry Revenue Million Forecast, by Country 2019 & 2032
- Table 9: Passive Electronic Components Market In The Oil & Gas Industry Revenue (Million) Forecast, by Application 2019 & 2032
- Table 10: Global Passive Electronic Components Market In The Oil & Gas Industry Revenue Million Forecast, by Country 2019 & 2032
- Table 11: Passive Electronic Components Market In The Oil & Gas Industry Revenue (Million) Forecast, by Application 2019 & 2032
- Table 12: Global Passive Electronic Components Market In The Oil & Gas Industry Revenue Million Forecast, by Type 2019 & 2032
- Table 13: Global Passive Electronic Components Market In The Oil & Gas Industry Revenue Million Forecast, by Country 2019 & 2032
- Table 14: Global Passive Electronic Components Market In The Oil & Gas Industry Revenue Million Forecast, by Type 2019 & 2032
- Table 15: Global Passive Electronic Components Market In The Oil & Gas Industry Revenue Million Forecast, by Country 2019 & 2032
- Table 16: Global Passive Electronic Components Market In The Oil & Gas Industry Revenue Million Forecast, by Type 2019 & 2032
- Table 17: Global Passive Electronic Components Market In The Oil & Gas Industry Revenue Million Forecast, by Country 2019 & 2032
- Table 18: Global Passive Electronic Components Market In The Oil & Gas Industry Revenue Million Forecast, by Type 2019 & 2032
- Table 19: Global Passive Electronic Components Market In The Oil & Gas Industry Revenue Million Forecast, by Country 2019 & 2032
Frequently Asked Questions
1. What is the projected Compound Annual Growth Rate (CAGR) of the Passive Electronic Components Market In The Oil & Gas Industry?
The projected CAGR is approximately 3.90%.
2. Which companies are prominent players in the Passive Electronic Components Market In The Oil & Gas Industry?
Key companies in the market include Vishay Intertechnology Inc, AVX Corporation (Kyocera Corporation), KEMET Corporation (Yageo Company), Lelon Electronics Corp, API Delevan (Fortive Corporation), TE Connectivity, Cornell Dubilier Electronics Inc, TDK Corporation, Ohmite Manufacturing Company, Panasonic Corporation, Honeywell International Inc *List Not Exhaustive, Eaton Corporation.
3. What are the main segments of the Passive Electronic Components Market In The Oil & Gas Industry?
The market segments include Type.
4. Can you provide details about the market size?
The market size is estimated to be USD 3.53 Million as of 2022.
5. What are some drivers contributing to market growth?
Increasing Investments in Oil & Gas Industry.
6. What are the notable trends driving market growth?
Increasing Invesment in Oil & Gas Industry.
7. Are there any restraints impacting market growth?
Rising Metal Prices Impacting Component Production Costs.
8. Can you provide examples of recent developments in the market?
March 2023: Cornell Dubilier Electronics Inc. introduces the 944L series of low inductance, high current DC link film capacitors. The series uses large diameter non-inductive windings and low inductance internal bus connections resulting in equivalent series inductance (ESL) values in the 10 to 15 nano henry range. It is also available in values from 33 to 220uF with voltage ratings of 800, 1000, 1200, and 1400VDC.
9. What pricing options are available for accessing the report?
Pricing options include single-user, multi-user, and enterprise licenses priced at USD 4750, USD 5250, and USD 8750 respectively.
10. Is the market size provided in terms of value or volume?
The market size is provided in terms of value, measured in Million.
11. Are there any specific market keywords associated with the report?
Yes, the market keyword associated with the report is "Passive Electronic Components Market In The Oil & Gas Industry," which aids in identifying and referencing the specific market segment covered.
12. How do I determine which pricing option suits my needs best?
The pricing options vary based on user requirements and access needs. Individual users may opt for single-user licenses, while businesses requiring broader access may choose multi-user or enterprise licenses for cost-effective access to the report.
13. Are there any additional resources or data provided in the Passive Electronic Components Market In The Oil & Gas Industry report?
While the report offers comprehensive insights, it's advisable to review the specific contents or supplementary materials provided to ascertain if additional resources or data are available.
14. How can I stay updated on further developments or reports in the Passive Electronic Components Market In The Oil & Gas Industry?
To stay informed about further developments, trends, and reports in the Passive Electronic Components Market In The Oil & Gas Industry, consider subscribing to industry newsletters, following relevant companies and organizations, or regularly checking reputable industry news sources and publications.
Methodology
Step 1 - Identification of Relevant Samples Size from Population Database


Step 2 - Approaches for Defining Global Market Size (Value, Volume* & Price*)

Note*: In applicable scenarios
Step 3 - Data Sources
Primary Research
- Web Analytics
- Survey Reports
- Research Institute
- Latest Research Reports
- Opinion Leaders
Secondary Research
- Annual Reports
- White Paper
- Latest Press Release
- Industry Association
- Paid Database
- Investor Presentations

Step 4 - Data Triangulation
Involves using different sources of information in order to increase the validity of a study
These sources are likely to be stakeholders in a program - participants, other researchers, program staff, other community members, and so on.
Then we put all data in single framework & apply various statistical tools to find out the dynamic on the market.
During the analysis stage, feedback from the stakeholder groups would be compared to determine areas of agreement as well as areas of divergence


