

Key Insights
The Nigerian paints and protective coatings market is poised for substantial expansion, driven by robust infrastructure development, accelerating urbanization, and a growing middle class. With a projected Compound Annual Growth Rate (CAGR) of 7.5%, the market is expected to reach $2.69 billion by 2025. Key growth catalysts include government-led infrastructure projects, a flourishing construction sector fueled by public and private investment, and the increasing adoption of protective coatings across industrial segments such as oil & gas, mining, and power generation to enhance asset longevity and ensure regulatory compliance. The market is segmented by resin type (epoxy, polyurethane, polyester, vinyl ester, etc.), technology (water-based, solvent-based, powder-based), and end-user industry (oil & gas, mining, power, infrastructure, etc.). Competitive dynamics are intense, featuring prominent local and international players including Berger Paints Nigeria Plc, Akzo Nobel NV, and PPG Industries.
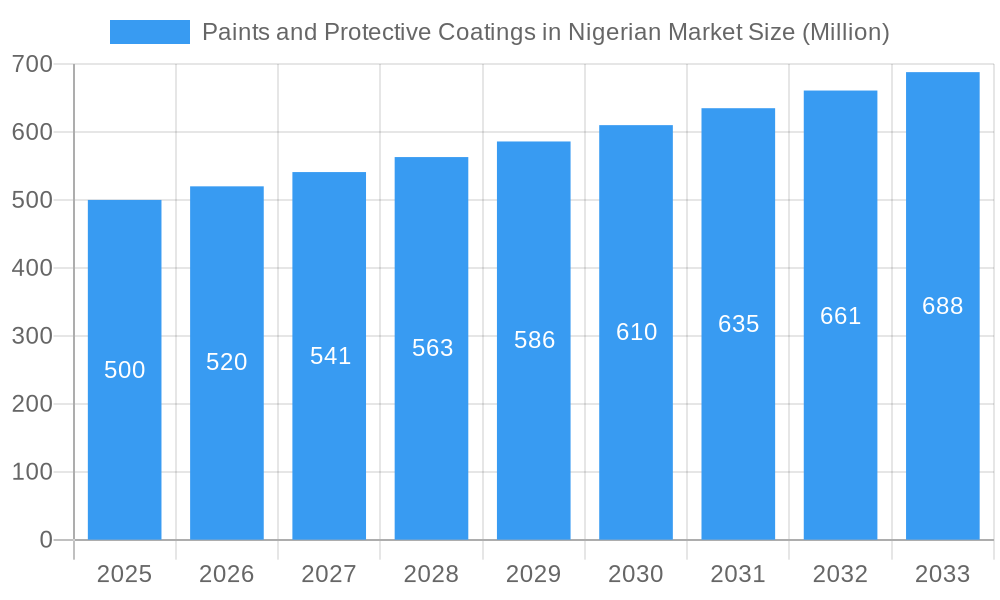
Paints and Protective Coatings in Nigerian Market Market Size (In Billion)
Despite a favorable growth trajectory, the market faces challenges including volatile raw material prices, particularly for imported resins, and economic instability. Counterfeiting and the need to elevate awareness regarding the advantages of premium protective coatings, especially in underserved regions, also present hurdles. To overcome these obstacles and leverage opportunities, market participants are prioritizing product innovation, strategic alliances, and expanded distribution networks. Future growth will likely be propelled by continued infrastructure expansion, advancements in construction methodologies, and the escalating demand for durable and aesthetically superior coatings.
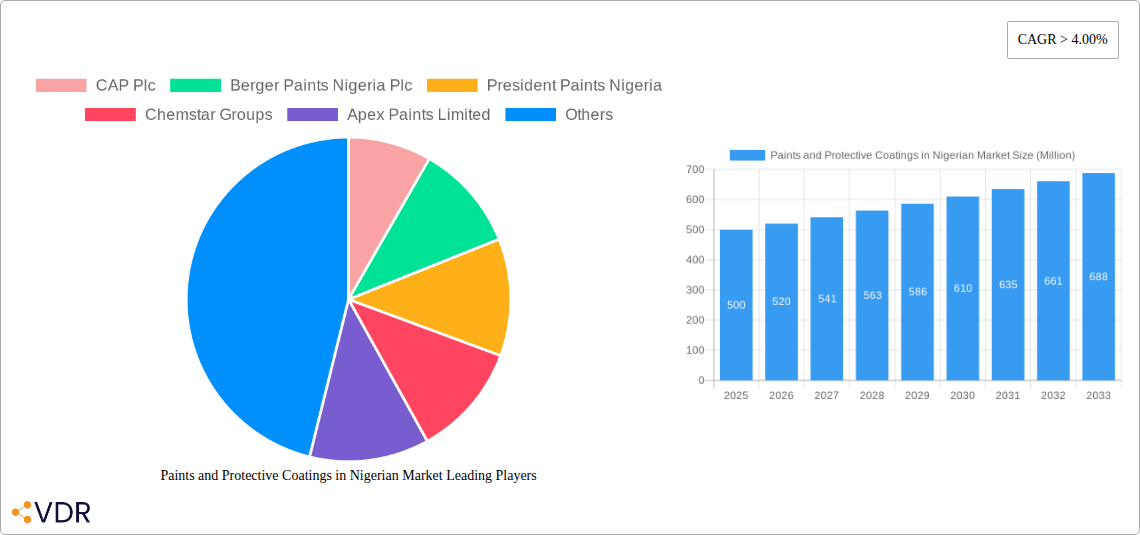
Paints and Protective Coatings in Nigerian Market Company Market Share
Paints and Protective Coatings in the Nigerian Market: A Comprehensive Market Report (2019-2033)
This comprehensive report provides an in-depth analysis of the paints and protective coatings market in Nigeria, covering the period 2019-2033. It offers invaluable insights into market dynamics, growth trends, key players, and future opportunities, enabling businesses to make informed strategic decisions. The report segments the market by product type (Epoxy Resin, Polyurethane Resin, Polyester Resin, Vinyl Ester Resin, Other Product Types), technology (Water-based, Solvent-based, Powder-based), and end-user industry (Oil and Gas, Mining, Power, Infrastructure, Other End-user Industries). With a focus on the Nigerian market, this report serves as an essential resource for industry professionals, investors, and policymakers.
Paints and Protective Coatings in Nigerian Market Market Dynamics & Structure
This section analyzes the competitive landscape, technological advancements, regulatory environment, and market trends within the Nigerian paints and protective coatings market. The market is moderately concentrated, with key players holding significant shares. However, smaller players also contribute substantially, particularly in niche segments. Technological innovation is driven by demand for high-performance, eco-friendly coatings. Regulatory frameworks, including environmental regulations, influence product formulation and manufacturing processes. The presence of substitute products, such as powder coatings, influences market competition. Demographic shifts and the growth of various end-user industries further shape market demand. Mergers and acquisitions (M&A) activity has been notable, with significant deals impacting market structure. For instance, the 2021 merger of CAP Plc and Portland Paints & Products Nigeria Plc significantly altered the market share distribution.
- Market Concentration: Moderately concentrated, with top players holding xx% market share in 2024.
- Technological Innovation: Focus on water-based and powder coatings due to environmental concerns.
- Regulatory Framework: Stringent environmental regulations drive the adoption of eco-friendly products.
- Competitive Substitutes: Powder coatings are gaining traction, posing a competitive threat to traditional liquid coatings.
- End-User Demographics: Growth in construction, infrastructure, and industrial sectors fuels market expansion.
- M&A Activity: Significant M&A activity reshapes market structure, with xx deals recorded between 2019 and 2024.
Paints and Protective Coatings in Nigerian Market Growth Trends & Insights
The Nigerian paints and protective coatings market exhibited steady growth between 2019 and 2024, driven by increasing infrastructure development, industrialization, and rising consumer spending. The market size reached xx million units in 2024, experiencing a CAGR of xx% during the historical period. Adoption rates vary significantly across different segments, with water-based coatings gaining popularity due to their environmental benefits. Technological disruptions, such as the introduction of advanced coating technologies, are shaping market dynamics. Shifting consumer preferences toward durable and aesthetically pleasing coatings also influence growth. The forecast period (2025-2033) projects continued growth, propelled by ongoing infrastructure projects, industrial expansion, and government initiatives promoting sustainable development. Market penetration is expected to increase steadily, with xx% penetration anticipated by 2033.
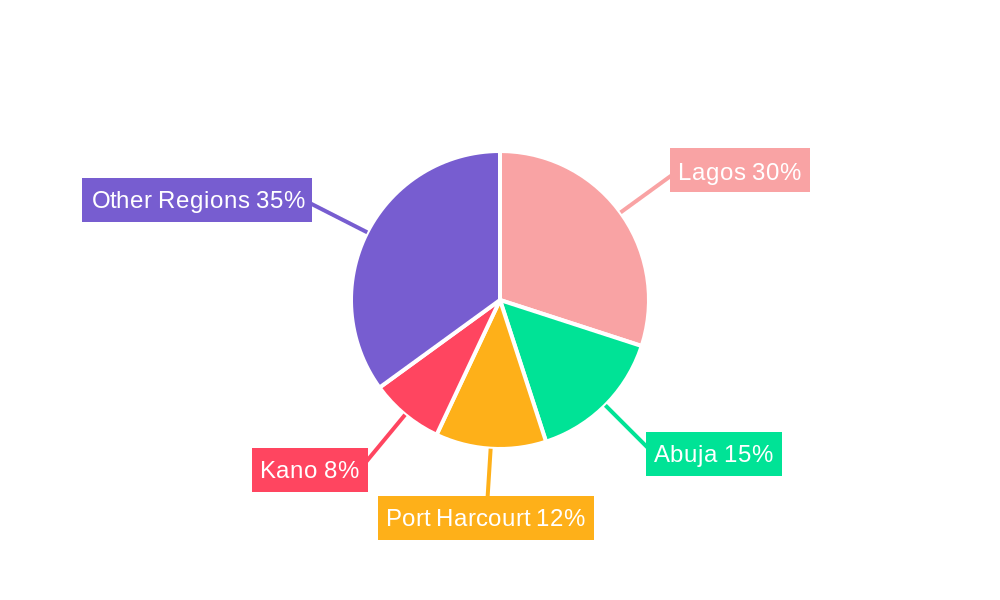
Dominant Regions, Countries, or Segments in Paints and Protective Coatings in Nigerian Market
The Nigerian paints and protective coatings market is geographically diverse, with significant growth observed across various regions. However, urban centers and industrial hubs tend to exhibit higher demand due to concentrated construction and industrial activities. In terms of product segments, the demand for water-based coatings is expanding rapidly due to their environmental friendliness and growing health consciousness. Within end-user industries, the oil and gas sector has been a significant driver of growth, followed by the construction and infrastructure sectors. The infrastructure sector is anticipated to display considerable growth driven by government investment in infrastructure projects.
- Key Drivers:
- Robust economic growth and infrastructure development.
- Rising disposable incomes and increased consumer spending on home improvement.
- Government initiatives promoting sustainable development and adoption of eco-friendly coatings.
- Dominant Segments:
- Water-based coatings are experiencing rapid growth due to environmental benefits.
- The Oil and Gas sector remains a significant driver of demand for high-performance protective coatings.
- The construction and infrastructure sector display promising growth potential.
Paints and Protective Coatings in Nigerian Market Product Landscape
The product landscape is characterized by a diverse range of coatings, tailored to specific applications and performance requirements. Innovations focus on enhancing durability, aesthetics, and environmental sustainability. Advancements in resin technology, pigment dispersion, and curing mechanisms are driving the development of high-performance coatings with improved resistance to corrosion, weathering, and chemicals. Unique selling propositions increasingly emphasize eco-friendliness, ease of application, and long-term performance. The market shows a strong preference for water-based systems, while solvent-based and powder coatings cater to specific niche applications.
Key Drivers, Barriers & Challenges in Paints and Protective Coatings in Nigerian Market
Key Drivers:
- Growing infrastructure development and industrialization are major drivers.
- Rising disposable incomes increase demand for home improvement and decorative coatings.
- Government initiatives to boost construction and infrastructure projects significantly impact the market.
Key Barriers and Challenges:
- Fluctuations in raw material prices and currency exchange rates affect profitability.
- Counterfeit products and competition from low-cost imports pose significant challenges.
- Limited access to finance and high borrowing costs can hinder investment in the sector. This has been estimated to reduce market growth by xx% annually.
Emerging Opportunities in Paints and Protective Coatings in Nigerian Market
Untapped markets exist in rural areas and emerging industrial sectors. The increasing focus on sustainable building practices creates opportunities for eco-friendly coatings. Innovative applications in specialized areas like infrastructure protection and marine coatings present further growth potential. Evolving consumer preferences toward customized coatings with enhanced aesthetics and functionality create niches for specialized products.
Growth Accelerators in the Paints and Protective Coatings in Nigerian Market Industry
Technological advancements in coating formulations, such as the development of high-performance and eco-friendly coatings, will drive long-term growth. Strategic partnerships and collaborations between paint manufacturers and construction companies will expand market reach and enhance distribution networks. Government policies promoting infrastructure development and sustainable building practices will create significant market opportunities. Expanding into new geographic regions and diversifying product portfolios will contribute to sustained growth.
Key Players Shaping the Paints and Protective Coatings in Nigerian Market Market
- CAP Plc
- Berger Paints Nigeria Plc
- President Paints Nigeria
- Chemstar Groups
- Apex Paints Limited
- Akzo Nobel NV
- PCMN PLC
- Prestige Paints Company Limited
- Eagle Paints
- Meyer Plc
- Premier Paints Plc
- PPG Industries
Notable Milestones in Paints and Protective Coatings in Nigerian Market Sector
- February 2021: CAP Plc completed its merger with Portland Paints & Products Nigeria Plc, creating Nigeria's largest paint and chemical company by market capitalization.
- June 2022: AkzoNobel completed the agreement to acquire all paints and coatings activities of Kansai Paint in Africa, strengthening its presence in the region.
In-Depth Paints and Protective Coatings in Nigerian Market Market Outlook
The Nigerian paints and protective coatings market is poised for continued growth, driven by robust infrastructure development, industrial expansion, and rising consumer demand. Opportunities exist in developing sustainable, high-performance coatings tailored to specific end-user needs. Strategic partnerships, technological innovation, and effective marketing strategies will be crucial for success in this dynamic market. The market's future prospects are promising, with significant potential for expansion across various segments and regions.
Paints and Protective Coatings in Nigerian Market Segmentation
-
1. Product Type
- 1.1. Epoxy Resin
- 1.2. Polyurethane Resin
- 1.3. Polyester Resin
- 1.4. Vinyl Ester Resin
- 1.5. Other Product Types (Phenolic, PTFE, Phosphate)
-
2. Technology
- 2.1. Water-based
- 2.2. Solvent-based
- 2.3. Powder-based
-
3. End-user Industry
- 3.1. Oil and Gas
- 3.2. Mining
- 3.3. Power
- 3.4. Infrastructure
- 3.5. Other En
Paints and Protective Coatings in Nigerian Market Segmentation By Geography
-
1. North America
- 1.1. United States
- 1.2. Canada
- 1.3. Mexico
-
2. South America
- 2.1. Brazil
- 2.2. Argentina
- 2.3. Rest of South America
-
3. Europe
- 3.1. United Kingdom
- 3.2. Germany
- 3.3. France
- 3.4. Italy
- 3.5. Spain
- 3.6. Russia
- 3.7. Benelux
- 3.8. Nordics
- 3.9. Rest of Europe
-
4. Middle East & Africa
- 4.1. Turkey
- 4.2. Israel
- 4.3. GCC
- 4.4. North Africa
- 4.5. South Africa
- 4.6. Rest of Middle East & Africa
-
5. Asia Pacific
- 5.1. China
- 5.2. India
- 5.3. Japan
- 5.4. South Korea
- 5.5. ASEAN
- 5.6. Oceania
- 5.7. Rest of Asia Pacific
Paints and Protective Coatings in Nigerian Market Regional Market Share
Geographic Coverage of Paints and Protective Coatings in Nigerian Market
Paints and Protective Coatings in Nigerian Market REPORT HIGHLIGHTS
| Aspects | Details |
|---|---|
| Study Period | 2020-2034 |
| Base Year | 2025 |
| Estimated Year | 2026 |
| Forecast Period | 2026-2034 |
| Historical Period | 2020-2025 |
| Growth Rate | CAGR of 7.5% from 2020-2034 |
| Segmentation |
|
Table of Contents
- 1. Introduction
- 1.1. Research Scope
- 1.2. Market Segmentation
- 1.3. Research Objective
- 1.4. Definitions and Assumptions
- 2. Executive Summary
- 2.1. Market Snapshot
- 3. Market Dynamics
- 3.1. Market Drivers
- 3.2. Market Restrains
- 3.3. Market Trends
- 3.4. Market Opportunities
- 4. Market Factor Analysis
- 4.1. Porters Five Forces
- 4.1.1. Bargaining Power of Suppliers
- 4.1.2. Bargaining Power of Buyers
- 4.1.3. Threat of New Entrants
- 4.1.4. Threat of Substitutes
- 4.1.5. Competitive Rivalry
- 4.2. PESTEL analysis
- 4.3. BCG Analysis
- 4.3.1. Stars (High Growth, High Market Share)
- 4.3.2. Cash Cows (Low Growth, High Market Share)
- 4.3.3. Question Mark (High Growth, Low Market Share)
- 4.3.4. Dogs (Low Growth, Low Market Share)
- 4.4. Ansoff Matrix Analysis
- 4.5. Supply Chain Analysis
- 4.6. Regulatory Landscape
- 4.7. Current Market Potential and Opportunity Assessment (TAM–SAM–SOM Framework)
- 4.8. VDR Analyst Note
- 4.1. Porters Five Forces
- 5. Market Analysis, Insights and Forecast 2021-2033
- 5.1. Market Analysis, Insights and Forecast - by Product Type
- 5.1.1. Epoxy Resin
- 5.1.2. Polyurethane Resin
- 5.1.3. Polyester Resin
- 5.1.4. Vinyl Ester Resin
- 5.1.5. Other Product Types (Phenolic, PTFE, Phosphate)
- 5.2. Market Analysis, Insights and Forecast - by Technology
- 5.2.1. Water-based
- 5.2.2. Solvent-based
- 5.2.3. Powder-based
- 5.3. Market Analysis, Insights and Forecast - by End-user Industry
- 5.3.1. Oil and Gas
- 5.3.2. Mining
- 5.3.3. Power
- 5.3.4. Infrastructure
- 5.3.5. Other En
- 5.4. Market Analysis, Insights and Forecast - by Region
- 5.4.1. North America
- 5.4.2. South America
- 5.4.3. Europe
- 5.4.4. Middle East & Africa
- 5.4.5. Asia Pacific
- 5.1. Market Analysis, Insights and Forecast - by Product Type
- 6. Global Paints and Protective Coatings in Nigerian Market Analysis, Insights and Forecast, 2021-2033
- 6.1. Market Analysis, Insights and Forecast - by Product Type
- 6.1.1. Epoxy Resin
- 6.1.2. Polyurethane Resin
- 6.1.3. Polyester Resin
- 6.1.4. Vinyl Ester Resin
- 6.1.5. Other Product Types (Phenolic, PTFE, Phosphate)
- 6.2. Market Analysis, Insights and Forecast - by Technology
- 6.2.1. Water-based
- 6.2.2. Solvent-based
- 6.2.3. Powder-based
- 6.3. Market Analysis, Insights and Forecast - by End-user Industry
- 6.3.1. Oil and Gas
- 6.3.2. Mining
- 6.3.3. Power
- 6.3.4. Infrastructure
- 6.3.5. Other En
- 6.1. Market Analysis, Insights and Forecast - by Product Type
- 7. North America Paints and Protective Coatings in Nigerian Market Analysis, Insights and Forecast, 2021-2033
- 7.1. Market Analysis, Insights and Forecast - by Product Type
- 7.1.1. Epoxy Resin
- 7.1.2. Polyurethane Resin
- 7.1.3. Polyester Resin
- 7.1.4. Vinyl Ester Resin
- 7.1.5. Other Product Types (Phenolic, PTFE, Phosphate)
- 7.2. Market Analysis, Insights and Forecast - by Technology
- 7.2.1. Water-based
- 7.2.2. Solvent-based
- 7.2.3. Powder-based
- 7.3. Market Analysis, Insights and Forecast - by End-user Industry
- 7.3.1. Oil and Gas
- 7.3.2. Mining
- 7.3.3. Power
- 7.3.4. Infrastructure
- 7.3.5. Other En
- 7.1. Market Analysis, Insights and Forecast - by Product Type
- 8. South America Paints and Protective Coatings in Nigerian Market Analysis, Insights and Forecast, 2021-2033
- 8.1. Market Analysis, Insights and Forecast - by Product Type
- 8.1.1. Epoxy Resin
- 8.1.2. Polyurethane Resin
- 8.1.3. Polyester Resin
- 8.1.4. Vinyl Ester Resin
- 8.1.5. Other Product Types (Phenolic, PTFE, Phosphate)
- 8.2. Market Analysis, Insights and Forecast - by Technology
- 8.2.1. Water-based
- 8.2.2. Solvent-based
- 8.2.3. Powder-based
- 8.3. Market Analysis, Insights and Forecast - by End-user Industry
- 8.3.1. Oil and Gas
- 8.3.2. Mining
- 8.3.3. Power
- 8.3.4. Infrastructure
- 8.3.5. Other En
- 8.1. Market Analysis, Insights and Forecast - by Product Type
- 9. Europe Paints and Protective Coatings in Nigerian Market Analysis, Insights and Forecast, 2021-2033
- 9.1. Market Analysis, Insights and Forecast - by Product Type
- 9.1.1. Epoxy Resin
- 9.1.2. Polyurethane Resin
- 9.1.3. Polyester Resin
- 9.1.4. Vinyl Ester Resin
- 9.1.5. Other Product Types (Phenolic, PTFE, Phosphate)
- 9.2. Market Analysis, Insights and Forecast - by Technology
- 9.2.1. Water-based
- 9.2.2. Solvent-based
- 9.2.3. Powder-based
- 9.3. Market Analysis, Insights and Forecast - by End-user Industry
- 9.3.1. Oil and Gas
- 9.3.2. Mining
- 9.3.3. Power
- 9.3.4. Infrastructure
- 9.3.5. Other En
- 9.1. Market Analysis, Insights and Forecast - by Product Type
- 10. Middle East & Africa Paints and Protective Coatings in Nigerian Market Analysis, Insights and Forecast, 2021-2033
- 10.1. Market Analysis, Insights and Forecast - by Product Type
- 10.1.1. Epoxy Resin
- 10.1.2. Polyurethane Resin
- 10.1.3. Polyester Resin
- 10.1.4. Vinyl Ester Resin
- 10.1.5. Other Product Types (Phenolic, PTFE, Phosphate)
- 10.2. Market Analysis, Insights and Forecast - by Technology
- 10.2.1. Water-based
- 10.2.2. Solvent-based
- 10.2.3. Powder-based
- 10.3. Market Analysis, Insights and Forecast - by End-user Industry
- 10.3.1. Oil and Gas
- 10.3.2. Mining
- 10.3.3. Power
- 10.3.4. Infrastructure
- 10.3.5. Other En
- 10.1. Market Analysis, Insights and Forecast - by Product Type
- 11. Asia Pacific Paints and Protective Coatings in Nigerian Market Analysis, Insights and Forecast, 2021-2033
- 11.1. Market Analysis, Insights and Forecast - by Product Type
- 11.1.1. Epoxy Resin
- 11.1.2. Polyurethane Resin
- 11.1.3. Polyester Resin
- 11.1.4. Vinyl Ester Resin
- 11.1.5. Other Product Types (Phenolic, PTFE, Phosphate)
- 11.2. Market Analysis, Insights and Forecast - by Technology
- 11.2.1. Water-based
- 11.2.2. Solvent-based
- 11.2.3. Powder-based
- 11.3. Market Analysis, Insights and Forecast - by End-user Industry
- 11.3.1. Oil and Gas
- 11.3.2. Mining
- 11.3.3. Power
- 11.3.4. Infrastructure
- 11.3.5. Other En
- 11.1. Market Analysis, Insights and Forecast - by Product Type
- 12. Competitive Analysis
- 12.1. Company Profiles
- 12.1.1 CAP Plc
- 12.1.1.1. Company Overview
- 12.1.1.2. Products
- 12.1.1.3. Company Financials
- 12.1.1.4. SWOT Analysis
- 12.1.2 Berger Paints Nigeria Plc
- 12.1.2.1. Company Overview
- 12.1.2.2. Products
- 12.1.2.3. Company Financials
- 12.1.2.4. SWOT Analysis
- 12.1.3 President Paints Nigeria
- 12.1.3.1. Company Overview
- 12.1.3.2. Products
- 12.1.3.3. Company Financials
- 12.1.3.4. SWOT Analysis
- 12.1.4 Chemstar Groups
- 12.1.4.1. Company Overview
- 12.1.4.2. Products
- 12.1.4.3. Company Financials
- 12.1.4.4. SWOT Analysis
- 12.1.5 Apex Paints Limited
- 12.1.5.1. Company Overview
- 12.1.5.2. Products
- 12.1.5.3. Company Financials
- 12.1.5.4. SWOT Analysis
- 12.1.6 Akzo Nobel NV
- 12.1.6.1. Company Overview
- 12.1.6.2. Products
- 12.1.6.3. Company Financials
- 12.1.6.4. SWOT Analysis
- 12.1.7 PCMN PLC
- 12.1.7.1. Company Overview
- 12.1.7.2. Products
- 12.1.7.3. Company Financials
- 12.1.7.4. SWOT Analysis
- 12.1.8 Prestige Paints Company Limited*List Not Exhaustive
- 12.1.8.1. Company Overview
- 12.1.8.2. Products
- 12.1.8.3. Company Financials
- 12.1.8.4. SWOT Analysis
- 12.1.9 Eagle Paints
- 12.1.9.1. Company Overview
- 12.1.9.2. Products
- 12.1.9.3. Company Financials
- 12.1.9.4. SWOT Analysis
- 12.1.10 Meyer Plc
- 12.1.10.1. Company Overview
- 12.1.10.2. Products
- 12.1.10.3. Company Financials
- 12.1.10.4. SWOT Analysis
- 12.1.11 Premier Paints Plc
- 12.1.11.1. Company Overview
- 12.1.11.2. Products
- 12.1.11.3. Company Financials
- 12.1.11.4. SWOT Analysis
- 12.1.12 PPG Industries
- 12.1.12.1. Company Overview
- 12.1.12.2. Products
- 12.1.12.3. Company Financials
- 12.1.12.4. SWOT Analysis
- 12.1.1 CAP Plc
- 12.2. Market Entropy
- 12.2.1 Company's Key Areas Served
- 12.2.2 Recent Developments
- 12.3. Company Market Share Analysis 2025
- 12.3.1 Top 5 Companies Market Share Analysis
- 12.3.2 Top 3 Companies Market Share Analysis
- 12.4. List of Potential Customers
- 13. Research Methodology
List of Figures
- Figure 1: Global Paints and Protective Coatings in Nigerian Market Revenue Breakdown (billion, %) by Region 2025 & 2033
- Figure 2: Global Paints and Protective Coatings in Nigerian Market Volume Breakdown (liter , %) by Region 2025 & 2033
- Figure 3: North America Paints and Protective Coatings in Nigerian Market Revenue (billion), by Product Type 2025 & 2033
- Figure 4: North America Paints and Protective Coatings in Nigerian Market Volume (liter ), by Product Type 2025 & 2033
- Figure 5: North America Paints and Protective Coatings in Nigerian Market Revenue Share (%), by Product Type 2025 & 2033
- Figure 6: North America Paints and Protective Coatings in Nigerian Market Volume Share (%), by Product Type 2025 & 2033
- Figure 7: North America Paints and Protective Coatings in Nigerian Market Revenue (billion), by Technology 2025 & 2033
- Figure 8: North America Paints and Protective Coatings in Nigerian Market Volume (liter ), by Technology 2025 & 2033
- Figure 9: North America Paints and Protective Coatings in Nigerian Market Revenue Share (%), by Technology 2025 & 2033
- Figure 10: North America Paints and Protective Coatings in Nigerian Market Volume Share (%), by Technology 2025 & 2033
- Figure 11: North America Paints and Protective Coatings in Nigerian Market Revenue (billion), by End-user Industry 2025 & 2033
- Figure 12: North America Paints and Protective Coatings in Nigerian Market Volume (liter ), by End-user Industry 2025 & 2033
- Figure 13: North America Paints and Protective Coatings in Nigerian Market Revenue Share (%), by End-user Industry 2025 & 2033
- Figure 14: North America Paints and Protective Coatings in Nigerian Market Volume Share (%), by End-user Industry 2025 & 2033
- Figure 15: North America Paints and Protective Coatings in Nigerian Market Revenue (billion), by Country 2025 & 2033
- Figure 16: North America Paints and Protective Coatings in Nigerian Market Volume (liter ), by Country 2025 & 2033
- Figure 17: North America Paints and Protective Coatings in Nigerian Market Revenue Share (%), by Country 2025 & 2033
- Figure 18: North America Paints and Protective Coatings in Nigerian Market Volume Share (%), by Country 2025 & 2033
- Figure 19: South America Paints and Protective Coatings in Nigerian Market Revenue (billion), by Product Type 2025 & 2033
- Figure 20: South America Paints and Protective Coatings in Nigerian Market Volume (liter ), by Product Type 2025 & 2033
- Figure 21: South America Paints and Protective Coatings in Nigerian Market Revenue Share (%), by Product Type 2025 & 2033
- Figure 22: South America Paints and Protective Coatings in Nigerian Market Volume Share (%), by Product Type 2025 & 2033
- Figure 23: South America Paints and Protective Coatings in Nigerian Market Revenue (billion), by Technology 2025 & 2033
- Figure 24: South America Paints and Protective Coatings in Nigerian Market Volume (liter ), by Technology 2025 & 2033
- Figure 25: South America Paints and Protective Coatings in Nigerian Market Revenue Share (%), by Technology 2025 & 2033
- Figure 26: South America Paints and Protective Coatings in Nigerian Market Volume Share (%), by Technology 2025 & 2033
- Figure 27: South America Paints and Protective Coatings in Nigerian Market Revenue (billion), by End-user Industry 2025 & 2033
- Figure 28: South America Paints and Protective Coatings in Nigerian Market Volume (liter ), by End-user Industry 2025 & 2033
- Figure 29: South America Paints and Protective Coatings in Nigerian Market Revenue Share (%), by End-user Industry 2025 & 2033
- Figure 30: South America Paints and Protective Coatings in Nigerian Market Volume Share (%), by End-user Industry 2025 & 2033
- Figure 31: South America Paints and Protective Coatings in Nigerian Market Revenue (billion), by Country 2025 & 2033
- Figure 32: South America Paints and Protective Coatings in Nigerian Market Volume (liter ), by Country 2025 & 2033
- Figure 33: South America Paints and Protective Coatings in Nigerian Market Revenue Share (%), by Country 2025 & 2033
- Figure 34: South America Paints and Protective Coatings in Nigerian Market Volume Share (%), by Country 2025 & 2033
- Figure 35: Europe Paints and Protective Coatings in Nigerian Market Revenue (billion), by Product Type 2025 & 2033
- Figure 36: Europe Paints and Protective Coatings in Nigerian Market Volume (liter ), by Product Type 2025 & 2033
- Figure 37: Europe Paints and Protective Coatings in Nigerian Market Revenue Share (%), by Product Type 2025 & 2033
- Figure 38: Europe Paints and Protective Coatings in Nigerian Market Volume Share (%), by Product Type 2025 & 2033
- Figure 39: Europe Paints and Protective Coatings in Nigerian Market Revenue (billion), by Technology 2025 & 2033
- Figure 40: Europe Paints and Protective Coatings in Nigerian Market Volume (liter ), by Technology 2025 & 2033
- Figure 41: Europe Paints and Protective Coatings in Nigerian Market Revenue Share (%), by Technology 2025 & 2033
- Figure 42: Europe Paints and Protective Coatings in Nigerian Market Volume Share (%), by Technology 2025 & 2033
- Figure 43: Europe Paints and Protective Coatings in Nigerian Market Revenue (billion), by End-user Industry 2025 & 2033
- Figure 44: Europe Paints and Protective Coatings in Nigerian Market Volume (liter ), by End-user Industry 2025 & 2033
- Figure 45: Europe Paints and Protective Coatings in Nigerian Market Revenue Share (%), by End-user Industry 2025 & 2033
- Figure 46: Europe Paints and Protective Coatings in Nigerian Market Volume Share (%), by End-user Industry 2025 & 2033
- Figure 47: Europe Paints and Protective Coatings in Nigerian Market Revenue (billion), by Country 2025 & 2033
- Figure 48: Europe Paints and Protective Coatings in Nigerian Market Volume (liter ), by Country 2025 & 2033
- Figure 49: Europe Paints and Protective Coatings in Nigerian Market Revenue Share (%), by Country 2025 & 2033
- Figure 50: Europe Paints and Protective Coatings in Nigerian Market Volume Share (%), by Country 2025 & 2033
- Figure 51: Middle East & Africa Paints and Protective Coatings in Nigerian Market Revenue (billion), by Product Type 2025 & 2033
- Figure 52: Middle East & Africa Paints and Protective Coatings in Nigerian Market Volume (liter ), by Product Type 2025 & 2033
- Figure 53: Middle East & Africa Paints and Protective Coatings in Nigerian Market Revenue Share (%), by Product Type 2025 & 2033
- Figure 54: Middle East & Africa Paints and Protective Coatings in Nigerian Market Volume Share (%), by Product Type 2025 & 2033
- Figure 55: Middle East & Africa Paints and Protective Coatings in Nigerian Market Revenue (billion), by Technology 2025 & 2033
- Figure 56: Middle East & Africa Paints and Protective Coatings in Nigerian Market Volume (liter ), by Technology 2025 & 2033
- Figure 57: Middle East & Africa Paints and Protective Coatings in Nigerian Market Revenue Share (%), by Technology 2025 & 2033
- Figure 58: Middle East & Africa Paints and Protective Coatings in Nigerian Market Volume Share (%), by Technology 2025 & 2033
- Figure 59: Middle East & Africa Paints and Protective Coatings in Nigerian Market Revenue (billion), by End-user Industry 2025 & 2033
- Figure 60: Middle East & Africa Paints and Protective Coatings in Nigerian Market Volume (liter ), by End-user Industry 2025 & 2033
- Figure 61: Middle East & Africa Paints and Protective Coatings in Nigerian Market Revenue Share (%), by End-user Industry 2025 & 2033
- Figure 62: Middle East & Africa Paints and Protective Coatings in Nigerian Market Volume Share (%), by End-user Industry 2025 & 2033
- Figure 63: Middle East & Africa Paints and Protective Coatings in Nigerian Market Revenue (billion), by Country 2025 & 2033
- Figure 64: Middle East & Africa Paints and Protective Coatings in Nigerian Market Volume (liter ), by Country 2025 & 2033
- Figure 65: Middle East & Africa Paints and Protective Coatings in Nigerian Market Revenue Share (%), by Country 2025 & 2033
- Figure 66: Middle East & Africa Paints and Protective Coatings in Nigerian Market Volume Share (%), by Country 2025 & 2033
- Figure 67: Asia Pacific Paints and Protective Coatings in Nigerian Market Revenue (billion), by Product Type 2025 & 2033
- Figure 68: Asia Pacific Paints and Protective Coatings in Nigerian Market Volume (liter ), by Product Type 2025 & 2033
- Figure 69: Asia Pacific Paints and Protective Coatings in Nigerian Market Revenue Share (%), by Product Type 2025 & 2033
- Figure 70: Asia Pacific Paints and Protective Coatings in Nigerian Market Volume Share (%), by Product Type 2025 & 2033
- Figure 71: Asia Pacific Paints and Protective Coatings in Nigerian Market Revenue (billion), by Technology 2025 & 2033
- Figure 72: Asia Pacific Paints and Protective Coatings in Nigerian Market Volume (liter ), by Technology 2025 & 2033
- Figure 73: Asia Pacific Paints and Protective Coatings in Nigerian Market Revenue Share (%), by Technology 2025 & 2033
- Figure 74: Asia Pacific Paints and Protective Coatings in Nigerian Market Volume Share (%), by Technology 2025 & 2033
- Figure 75: Asia Pacific Paints and Protective Coatings in Nigerian Market Revenue (billion), by End-user Industry 2025 & 2033
- Figure 76: Asia Pacific Paints and Protective Coatings in Nigerian Market Volume (liter ), by End-user Industry 2025 & 2033
- Figure 77: Asia Pacific Paints and Protective Coatings in Nigerian Market Revenue Share (%), by End-user Industry 2025 & 2033
- Figure 78: Asia Pacific Paints and Protective Coatings in Nigerian Market Volume Share (%), by End-user Industry 2025 & 2033
- Figure 79: Asia Pacific Paints and Protective Coatings in Nigerian Market Revenue (billion), by Country 2025 & 2033
- Figure 80: Asia Pacific Paints and Protective Coatings in Nigerian Market Volume (liter ), by Country 2025 & 2033
- Figure 81: Asia Pacific Paints and Protective Coatings in Nigerian Market Revenue Share (%), by Country 2025 & 2033
- Figure 82: Asia Pacific Paints and Protective Coatings in Nigerian Market Volume Share (%), by Country 2025 & 2033
List of Tables
- Table 1: Global Paints and Protective Coatings in Nigerian Market Revenue billion Forecast, by Product Type 2020 & 2033
- Table 2: Global Paints and Protective Coatings in Nigerian Market Volume liter Forecast, by Product Type 2020 & 2033
- Table 3: Global Paints and Protective Coatings in Nigerian Market Revenue billion Forecast, by Technology 2020 & 2033
- Table 4: Global Paints and Protective Coatings in Nigerian Market Volume liter Forecast, by Technology 2020 & 2033
- Table 5: Global Paints and Protective Coatings in Nigerian Market Revenue billion Forecast, by End-user Industry 2020 & 2033
- Table 6: Global Paints and Protective Coatings in Nigerian Market Volume liter Forecast, by End-user Industry 2020 & 2033
- Table 7: Global Paints and Protective Coatings in Nigerian Market Revenue billion Forecast, by Region 2020 & 2033
- Table 8: Global Paints and Protective Coatings in Nigerian Market Volume liter Forecast, by Region 2020 & 2033
- Table 9: Global Paints and Protective Coatings in Nigerian Market Revenue billion Forecast, by Product Type 2020 & 2033
- Table 10: Global Paints and Protective Coatings in Nigerian Market Volume liter Forecast, by Product Type 2020 & 2033
- Table 11: Global Paints and Protective Coatings in Nigerian Market Revenue billion Forecast, by Technology 2020 & 2033
- Table 12: Global Paints and Protective Coatings in Nigerian Market Volume liter Forecast, by Technology 2020 & 2033
- Table 13: Global Paints and Protective Coatings in Nigerian Market Revenue billion Forecast, by End-user Industry 2020 & 2033
- Table 14: Global Paints and Protective Coatings in Nigerian Market Volume liter Forecast, by End-user Industry 2020 & 2033
- Table 15: Global Paints and Protective Coatings in Nigerian Market Revenue billion Forecast, by Country 2020 & 2033
- Table 16: Global Paints and Protective Coatings in Nigerian Market Volume liter Forecast, by Country 2020 & 2033
- Table 17: United States Paints and Protective Coatings in Nigerian Market Revenue (billion) Forecast, by Application 2020 & 2033
- Table 18: United States Paints and Protective Coatings in Nigerian Market Volume (liter ) Forecast, by Application 2020 & 2033
- Table 19: Canada Paints and Protective Coatings in Nigerian Market Revenue (billion) Forecast, by Application 2020 & 2033
- Table 20: Canada Paints and Protective Coatings in Nigerian Market Volume (liter ) Forecast, by Application 2020 & 2033
- Table 21: Mexico Paints and Protective Coatings in Nigerian Market Revenue (billion) Forecast, by Application 2020 & 2033
- Table 22: Mexico Paints and Protective Coatings in Nigerian Market Volume (liter ) Forecast, by Application 2020 & 2033
- Table 23: Global Paints and Protective Coatings in Nigerian Market Revenue billion Forecast, by Product Type 2020 & 2033
- Table 24: Global Paints and Protective Coatings in Nigerian Market Volume liter Forecast, by Product Type 2020 & 2033
- Table 25: Global Paints and Protective Coatings in Nigerian Market Revenue billion Forecast, by Technology 2020 & 2033
- Table 26: Global Paints and Protective Coatings in Nigerian Market Volume liter Forecast, by Technology 2020 & 2033
- Table 27: Global Paints and Protective Coatings in Nigerian Market Revenue billion Forecast, by End-user Industry 2020 & 2033
- Table 28: Global Paints and Protective Coatings in Nigerian Market Volume liter Forecast, by End-user Industry 2020 & 2033
- Table 29: Global Paints and Protective Coatings in Nigerian Market Revenue billion Forecast, by Country 2020 & 2033
- Table 30: Global Paints and Protective Coatings in Nigerian Market Volume liter Forecast, by Country 2020 & 2033
- Table 31: Brazil Paints and Protective Coatings in Nigerian Market Revenue (billion) Forecast, by Application 2020 & 2033
- Table 32: Brazil Paints and Protective Coatings in Nigerian Market Volume (liter ) Forecast, by Application 2020 & 2033
- Table 33: Argentina Paints and Protective Coatings in Nigerian Market Revenue (billion) Forecast, by Application 2020 & 2033
- Table 34: Argentina Paints and Protective Coatings in Nigerian Market Volume (liter ) Forecast, by Application 2020 & 2033
- Table 35: Rest of South America Paints and Protective Coatings in Nigerian Market Revenue (billion) Forecast, by Application 2020 & 2033
- Table 36: Rest of South America Paints and Protective Coatings in Nigerian Market Volume (liter ) Forecast, by Application 2020 & 2033
- Table 37: Global Paints and Protective Coatings in Nigerian Market Revenue billion Forecast, by Product Type 2020 & 2033
- Table 38: Global Paints and Protective Coatings in Nigerian Market Volume liter Forecast, by Product Type 2020 & 2033
- Table 39: Global Paints and Protective Coatings in Nigerian Market Revenue billion Forecast, by Technology 2020 & 2033
- Table 40: Global Paints and Protective Coatings in Nigerian Market Volume liter Forecast, by Technology 2020 & 2033
- Table 41: Global Paints and Protective Coatings in Nigerian Market Revenue billion Forecast, by End-user Industry 2020 & 2033
- Table 42: Global Paints and Protective Coatings in Nigerian Market Volume liter Forecast, by End-user Industry 2020 & 2033
- Table 43: Global Paints and Protective Coatings in Nigerian Market Revenue billion Forecast, by Country 2020 & 2033
- Table 44: Global Paints and Protective Coatings in Nigerian Market Volume liter Forecast, by Country 2020 & 2033
- Table 45: United Kingdom Paints and Protective Coatings in Nigerian Market Revenue (billion) Forecast, by Application 2020 & 2033
- Table 46: United Kingdom Paints and Protective Coatings in Nigerian Market Volume (liter ) Forecast, by Application 2020 & 2033
- Table 47: Germany Paints and Protective Coatings in Nigerian Market Revenue (billion) Forecast, by Application 2020 & 2033
- Table 48: Germany Paints and Protective Coatings in Nigerian Market Volume (liter ) Forecast, by Application 2020 & 2033
- Table 49: France Paints and Protective Coatings in Nigerian Market Revenue (billion) Forecast, by Application 2020 & 2033
- Table 50: France Paints and Protective Coatings in Nigerian Market Volume (liter ) Forecast, by Application 2020 & 2033
- Table 51: Italy Paints and Protective Coatings in Nigerian Market Revenue (billion) Forecast, by Application 2020 & 2033
- Table 52: Italy Paints and Protective Coatings in Nigerian Market Volume (liter ) Forecast, by Application 2020 & 2033
- Table 53: Spain Paints and Protective Coatings in Nigerian Market Revenue (billion) Forecast, by Application 2020 & 2033
- Table 54: Spain Paints and Protective Coatings in Nigerian Market Volume (liter ) Forecast, by Application 2020 & 2033
- Table 55: Russia Paints and Protective Coatings in Nigerian Market Revenue (billion) Forecast, by Application 2020 & 2033
- Table 56: Russia Paints and Protective Coatings in Nigerian Market Volume (liter ) Forecast, by Application 2020 & 2033
- Table 57: Benelux Paints and Protective Coatings in Nigerian Market Revenue (billion) Forecast, by Application 2020 & 2033
- Table 58: Benelux Paints and Protective Coatings in Nigerian Market Volume (liter ) Forecast, by Application 2020 & 2033
- Table 59: Nordics Paints and Protective Coatings in Nigerian Market Revenue (billion) Forecast, by Application 2020 & 2033
- Table 60: Nordics Paints and Protective Coatings in Nigerian Market Volume (liter ) Forecast, by Application 2020 & 2033
- Table 61: Rest of Europe Paints and Protective Coatings in Nigerian Market Revenue (billion) Forecast, by Application 2020 & 2033
- Table 62: Rest of Europe Paints and Protective Coatings in Nigerian Market Volume (liter ) Forecast, by Application 2020 & 2033
- Table 63: Global Paints and Protective Coatings in Nigerian Market Revenue billion Forecast, by Product Type 2020 & 2033
- Table 64: Global Paints and Protective Coatings in Nigerian Market Volume liter Forecast, by Product Type 2020 & 2033
- Table 65: Global Paints and Protective Coatings in Nigerian Market Revenue billion Forecast, by Technology 2020 & 2033
- Table 66: Global Paints and Protective Coatings in Nigerian Market Volume liter Forecast, by Technology 2020 & 2033
- Table 67: Global Paints and Protective Coatings in Nigerian Market Revenue billion Forecast, by End-user Industry 2020 & 2033
- Table 68: Global Paints and Protective Coatings in Nigerian Market Volume liter Forecast, by End-user Industry 2020 & 2033
- Table 69: Global Paints and Protective Coatings in Nigerian Market Revenue billion Forecast, by Country 2020 & 2033
- Table 70: Global Paints and Protective Coatings in Nigerian Market Volume liter Forecast, by Country 2020 & 2033
- Table 71: Turkey Paints and Protective Coatings in Nigerian Market Revenue (billion) Forecast, by Application 2020 & 2033
- Table 72: Turkey Paints and Protective Coatings in Nigerian Market Volume (liter ) Forecast, by Application 2020 & 2033
- Table 73: Israel Paints and Protective Coatings in Nigerian Market Revenue (billion) Forecast, by Application 2020 & 2033
- Table 74: Israel Paints and Protective Coatings in Nigerian Market Volume (liter ) Forecast, by Application 2020 & 2033
- Table 75: GCC Paints and Protective Coatings in Nigerian Market Revenue (billion) Forecast, by Application 2020 & 2033
- Table 76: GCC Paints and Protective Coatings in Nigerian Market Volume (liter ) Forecast, by Application 2020 & 2033
- Table 77: North Africa Paints and Protective Coatings in Nigerian Market Revenue (billion) Forecast, by Application 2020 & 2033
- Table 78: North Africa Paints and Protective Coatings in Nigerian Market Volume (liter ) Forecast, by Application 2020 & 2033
- Table 79: South Africa Paints and Protective Coatings in Nigerian Market Revenue (billion) Forecast, by Application 2020 & 2033
- Table 80: South Africa Paints and Protective Coatings in Nigerian Market Volume (liter ) Forecast, by Application 2020 & 2033
- Table 81: Rest of Middle East & Africa Paints and Protective Coatings in Nigerian Market Revenue (billion) Forecast, by Application 2020 & 2033
- Table 82: Rest of Middle East & Africa Paints and Protective Coatings in Nigerian Market Volume (liter ) Forecast, by Application 2020 & 2033
- Table 83: Global Paints and Protective Coatings in Nigerian Market Revenue billion Forecast, by Product Type 2020 & 2033
- Table 84: Global Paints and Protective Coatings in Nigerian Market Volume liter Forecast, by Product Type 2020 & 2033
- Table 85: Global Paints and Protective Coatings in Nigerian Market Revenue billion Forecast, by Technology 2020 & 2033
- Table 86: Global Paints and Protective Coatings in Nigerian Market Volume liter Forecast, by Technology 2020 & 2033
- Table 87: Global Paints and Protective Coatings in Nigerian Market Revenue billion Forecast, by End-user Industry 2020 & 2033
- Table 88: Global Paints and Protective Coatings in Nigerian Market Volume liter Forecast, by End-user Industry 2020 & 2033
- Table 89: Global Paints and Protective Coatings in Nigerian Market Revenue billion Forecast, by Country 2020 & 2033
- Table 90: Global Paints and Protective Coatings in Nigerian Market Volume liter Forecast, by Country 2020 & 2033
- Table 91: China Paints and Protective Coatings in Nigerian Market Revenue (billion) Forecast, by Application 2020 & 2033
- Table 92: China Paints and Protective Coatings in Nigerian Market Volume (liter ) Forecast, by Application 2020 & 2033
- Table 93: India Paints and Protective Coatings in Nigerian Market Revenue (billion) Forecast, by Application 2020 & 2033
- Table 94: India Paints and Protective Coatings in Nigerian Market Volume (liter ) Forecast, by Application 2020 & 2033
- Table 95: Japan Paints and Protective Coatings in Nigerian Market Revenue (billion) Forecast, by Application 2020 & 2033
- Table 96: Japan Paints and Protective Coatings in Nigerian Market Volume (liter ) Forecast, by Application 2020 & 2033
- Table 97: South Korea Paints and Protective Coatings in Nigerian Market Revenue (billion) Forecast, by Application 2020 & 2033
- Table 98: South Korea Paints and Protective Coatings in Nigerian Market Volume (liter ) Forecast, by Application 2020 & 2033
- Table 99: ASEAN Paints and Protective Coatings in Nigerian Market Revenue (billion) Forecast, by Application 2020 & 2033
- Table 100: ASEAN Paints and Protective Coatings in Nigerian Market Volume (liter ) Forecast, by Application 2020 & 2033
- Table 101: Oceania Paints and Protective Coatings in Nigerian Market Revenue (billion) Forecast, by Application 2020 & 2033
- Table 102: Oceania Paints and Protective Coatings in Nigerian Market Volume (liter ) Forecast, by Application 2020 & 2033
- Table 103: Rest of Asia Pacific Paints and Protective Coatings in Nigerian Market Revenue (billion) Forecast, by Application 2020 & 2033
- Table 104: Rest of Asia Pacific Paints and Protective Coatings in Nigerian Market Volume (liter ) Forecast, by Application 2020 & 2033
Frequently Asked Questions
1. What is the projected Compound Annual Growth Rate (CAGR) of the Paints and Protective Coatings in Nigerian Market?
The projected CAGR is approximately 7.5%.
2. Which companies are prominent players in the Paints and Protective Coatings in Nigerian Market?
Key companies in the market include CAP Plc, Berger Paints Nigeria Plc, President Paints Nigeria, Chemstar Groups, Apex Paints Limited, Akzo Nobel NV, PCMN PLC, Prestige Paints Company Limited*List Not Exhaustive, Eagle Paints, Meyer Plc, Premier Paints Plc, PPG Industries.
3. What are the main segments of the Paints and Protective Coatings in Nigerian Market?
The market segments include Product Type, Technology, End-user Industry.
4. Can you provide details about the market size?
The market size is estimated to be USD 2.69 billion as of 2022.
5. What are some drivers contributing to market growth?
Growing Infrastructure Activities with Government Support; Increase in off-shore oil drilling activities.
6. What are the notable trends driving market growth?
Oil and Gas End-user Industry to dominate the market.
7. Are there any restraints impacting market growth?
Regulations Related to the VOC Emissions.
8. Can you provide examples of recent developments in the market?
June 2022: AkzoNobel completed the agreement to acquire all paints and coatings activities of Kansai Paint in Africa. This acquisition is expected to be completed by 2023. After this acquisition, AkzoNobel will strengthen its footprint in the African region.
9. What pricing options are available for accessing the report?
Pricing options include single-user, multi-user, and enterprise licenses priced at USD 3800, USD 4500, and USD 5800 respectively.
10. Is the market size provided in terms of value or volume?
The market size is provided in terms of value, measured in billion and volume, measured in liter .
11. Are there any specific market keywords associated with the report?
Yes, the market keyword associated with the report is "Paints and Protective Coatings in Nigerian Market," which aids in identifying and referencing the specific market segment covered.
12. How do I determine which pricing option suits my needs best?
The pricing options vary based on user requirements and access needs. Individual users may opt for single-user licenses, while businesses requiring broader access may choose multi-user or enterprise licenses for cost-effective access to the report.
13. Are there any additional resources or data provided in the Paints and Protective Coatings in Nigerian Market report?
While the report offers comprehensive insights, it's advisable to review the specific contents or supplementary materials provided to ascertain if additional resources or data are available.
14. How can I stay updated on further developments or reports in the Paints and Protective Coatings in Nigerian Market?
To stay informed about further developments, trends, and reports in the Paints and Protective Coatings in Nigerian Market, consider subscribing to industry newsletters, following relevant companies and organizations, or regularly checking reputable industry news sources and publications.
Methodology
Step 1 - Identification of Relevant Samples Size from Population Database


Step 2 - Approaches for Defining Global Market Size (Value, Volume* & Price*)

Note*: In applicable scenarios
Step 3 - Data Sources
Primary Research
- Web Analytics
- Survey Reports
- Research Institute
- Latest Research Reports
- Opinion Leaders
Secondary Research
- Annual Reports
- White Paper
- Latest Press Release
- Industry Association
- Paid Database
- Investor Presentations

Step 4 - Data Triangulation
Involves using different sources of information in order to increase the validity of a study
These sources are likely to be stakeholders in a program - participants, other researchers, program staff, other community members, and so on.
Then we put all data in single framework & apply various statistical tools to find out the dynamic on the market.
During the analysis stage, feedback from the stakeholder groups would be compared to determine areas of agreement as well as areas of divergence