
Key Insights
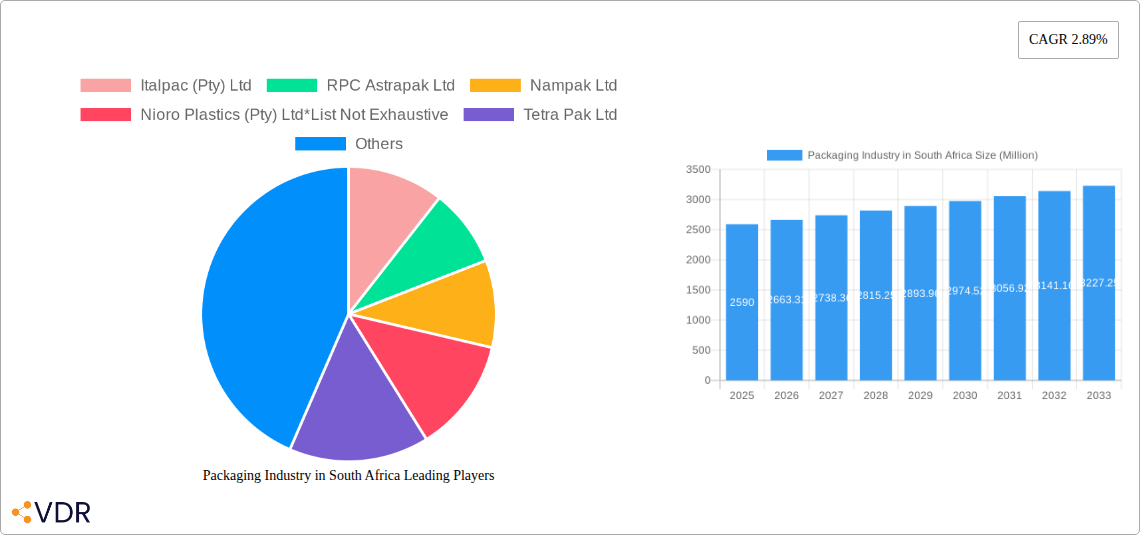
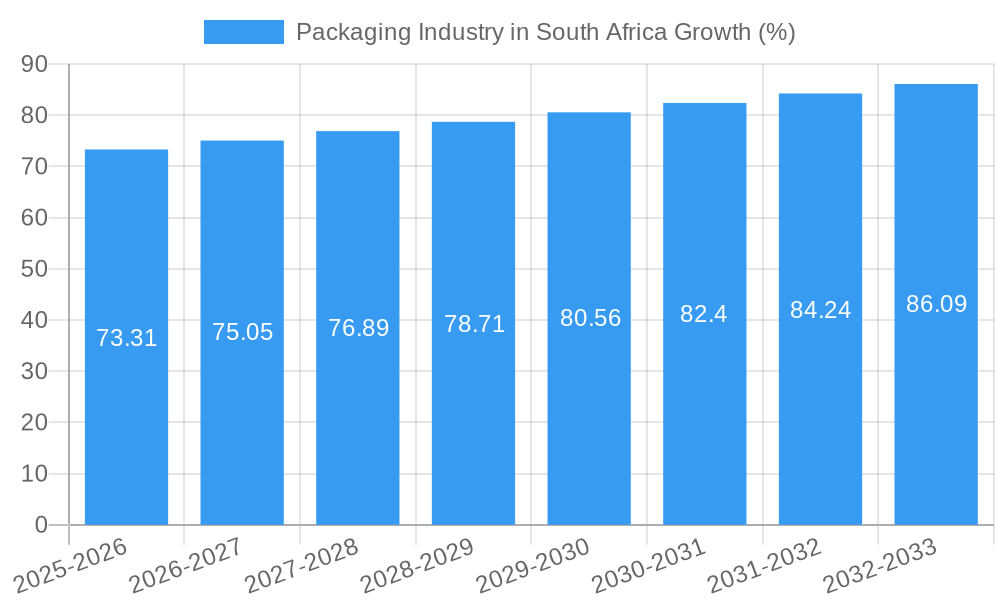
The South African packaging industry, valued at approximately $2.59 billion in 2025, is projected to experience steady growth, with a compound annual growth rate (CAGR) of 2.89% from 2025 to 2033. This growth is driven by several key factors. The expanding food and beverage sector, fueled by a growing population and increasing consumer spending, is a significant driver. Furthermore, the healthcare and pharmaceutical industries, demanding safe and reliable packaging solutions, contribute to market expansion. Growth in the e-commerce sector is also boosting demand for protective packaging materials. Trends towards sustainable and eco-friendly packaging options, such as biodegradable plastics and recycled materials, are reshaping the industry landscape, prompting manufacturers to innovate and adapt. While a lack of readily available data limits detailed analysis of specific restraints, potential challenges include fluctuations in raw material prices and increasing pressure to comply with stringent environmental regulations. The market is segmented by product type (bottles, pouches, films etc.), plastic type (rigid and flexible), material (PE, PP, PVC etc.), and end-user industry, offering diverse investment opportunities. Competitive pressures are evident, with established players like Amcor Limited and Mondi PLC competing alongside local companies like Italpac (Pty) Ltd and RPC Astrapak Ltd. The significant presence of multinational corporations underscores the potential for both domestic and international investment.
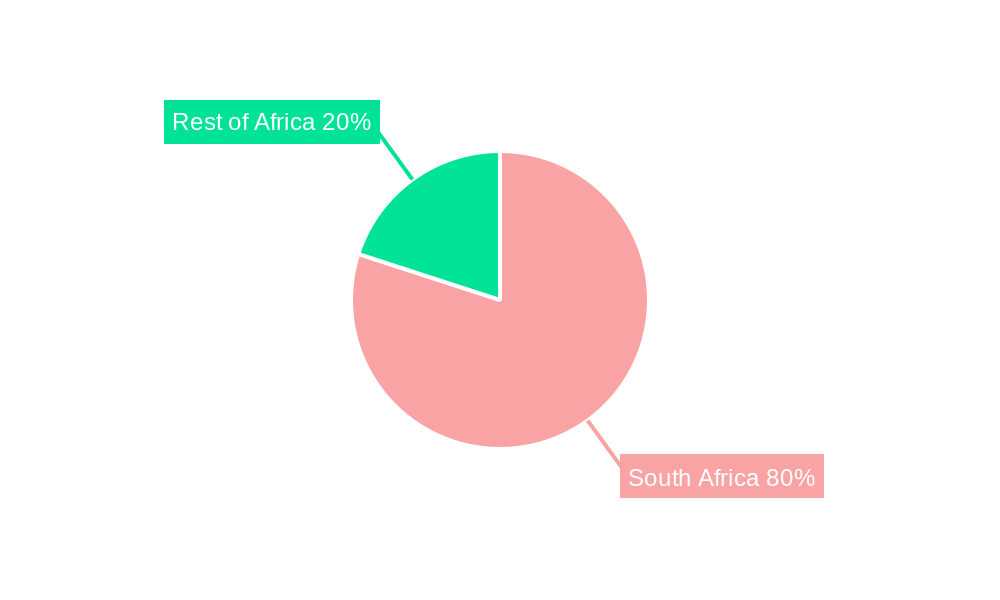
The South African packaging market demonstrates promising long-term prospects, despite potential challenges. The continued expansion of key industries, coupled with the rising awareness of sustainability, presents opportunities for businesses focused on innovation and environmentally conscious solutions. Strategic partnerships, investments in research and development, and a focus on export markets will be crucial for companies to thrive in this evolving sector. Geographical focus within South Africa, and potentially expanding into neighboring countries like those listed in the provided data (Sudan, Uganda, Tanzania, Kenya) will also be key strategies for growth. The market's resilience to economic fluctuations will also dictate future growth trajectories. A detailed analysis of regional differences in growth within South Africa would provide a more refined understanding of market potential.
Packaging Industry in South Africa: A Comprehensive Market Report (2019-2033)
This in-depth report provides a comprehensive analysis of the South African packaging industry, covering market dynamics, growth trends, key players, and future outlook. With a focus on both parent and child markets, this report is essential for industry professionals, investors, and anyone seeking to understand this dynamic sector. The study period spans 2019-2033, with 2025 as the base and estimated year.
Packaging Industry in South Africa Market Dynamics & Structure
The South African packaging market is characterized by a moderate level of concentration, with key players such as Nampak Ltd, RPC Astrapak Ltd, and Mondi PLC holding significant market share. However, the presence of numerous smaller players, especially in niche segments, ensures a dynamic competitive landscape. Technological innovation is a key driver, with companies investing in sustainable and efficient packaging solutions. The regulatory framework, particularly concerning plastic waste management, is undergoing significant changes, impacting industry practices and investments. The introduction of Extended Producer Responsibility (EPR) fees in 2021 significantly altered the playing field. Competitive substitutes, such as biodegradable and compostable packaging, are gaining traction.
Key Market Dynamics:
- Market Concentration: Moderate, with a few dominant players and many smaller firms. Nampak Ltd is estimated to hold approximately xx% market share in 2025.
- Technological Innovation: Focus on sustainability (bio-based materials, recyclability), automation, and lightweighting. Barriers include high initial investment costs for new technologies and a lack of skilled labor.
- Regulatory Framework: Stringent environmental regulations, including the EPR scheme, drive industry transformation toward circular economy practices.
- Competitive Substitutes: Biodegradable and compostable packaging materials are gaining market share, presenting a challenge to traditional players.
- M&A Activity: Moderate level of mergers and acquisitions, driven by consolidation and expansion into new segments. xx M&A deals were recorded between 2019 and 2024.
- End-User Demographics: Growth driven by rising population, urbanization, and changing consumer preferences for convenience and sustainability.
Packaging Industry in South Africa Growth Trends & Insights
The South African packaging market experienced steady growth during the historical period (2019-2024), with a Compound Annual Growth Rate (CAGR) of xx%. This growth is primarily driven by increasing consumption in key end-use sectors like food and beverages, healthcare, and personal care. The adoption of innovative packaging materials and technologies, such as flexible packaging and modified atmosphere packaging (MAP), further fueled market expansion. The market size in 2025 is estimated at ZAR xx Million. The forecast period (2025-2033) anticipates continued growth, albeit at a slightly moderated pace, driven by factors like economic growth, infrastructure development, and evolving consumer preferences. Technological disruptions, such as the increasing adoption of e-commerce and the demand for sustainable packaging, will significantly influence market trends. Consumer behavior shifts towards convenience, sustainability, and premiumization will shape the demand for different packaging types. Market penetration of sustainable packaging is expected to reach xx% by 2033.
Dominant Regions, Countries, or Segments in Packaging Industry in South Africa
The Gauteng province is the dominant region in the South African packaging market, followed by KwaZulu-Natal and Western Cape. This dominance is primarily attributed to higher levels of industrial activity and concentration of major packaging companies in these areas. Within the product type segment, flexible packaging (pouches, bags, films, and wraps) demonstrates the highest growth potential, driven by the rising demand for convenient and lightweight packaging in various end-use industries. In terms of plastic types, flexible plastics are projected to hold a larger market share than rigid plastics in the coming years. Among materials, PE and PET are the most widely used. The food and beverage sector is the largest end-user industry for packaging in South Africa, contributing the bulk of demand.
Key Growth Drivers:
- Economic Growth: Overall economic expansion fuels consumption and demand across various sectors.
- Infrastructure Development: Investments in logistics and retail infrastructure support the packaging industry.
- Government Policies: Regulations promoting local manufacturing and sustainable packaging practices are stimulating growth.
- Urbanization: Increasing urbanization drives demand for convenient and efficient packaging formats.
Packaging Industry in South Africa Product Landscape
The South African packaging industry offers a diverse range of products, including bottles and jars, pouches, bags, films and wraps, and other specialized packaging solutions. Significant technological advancements are occurring in areas such as active and intelligent packaging, which incorporate sensors and indicators to enhance product safety and shelf-life. Sustainable packaging options, like bio-based materials and recyclable designs, are gaining prominence due to environmental concerns and regulatory pressures. This includes a shift towards lighter weight packaging and improved recyclability to address the EPR requirements.
Key Drivers, Barriers & Challenges in Packaging Industry in South Africa
Key Drivers:
- Growth of organized retail: Increased supermarket penetration drives demand for sophisticated packaging.
- Rising disposable incomes: Leads to higher spending on packaged goods.
- Food and beverage sector expansion: Strong growth in the food processing and beverage industries.
Key Challenges:
- Fluctuating raw material prices: Impacts production costs and profitability.
- Stringent environmental regulations: Increased costs and complexity in meeting compliance requirements.
- Supply chain disruptions: Logistics bottlenecks and disruptions can lead to production delays.
- Competition from imports: Imported packaging products can compete on price and quality.
Emerging Opportunities in Packaging Industry in South Africa
- Growth in e-commerce: Demand for protective and efficient packaging for online deliveries.
- Sustainable packaging solutions: Growing demand for eco-friendly and recyclable options.
- Specialized packaging for niche markets: Opportunities in sectors like pharmaceuticals and cosmetics.
Growth Accelerators in the Packaging Industry in South Africa Industry
Technological advancements in sustainable materials and packaging design, coupled with strategic partnerships and collaborations between packaging companies and brand owners, are accelerating industry growth. Furthermore, expansion into new markets and diversification into specialized packaging segments offer significant potential for future growth.
Key Players Shaping the Packaging Industry in South Africa Market
- Italpac (Pty) Ltd
- RPC Astrapak Ltd
- Nampak Ltd
- Nioro Plastics (Pty) Ltd
- Tetra Pak Ltd
- Mondi PLC
- Mpact Ltd
- Amcor Limited
- Sealed Air Corporation
- Constantia Flexibles Corporation
Notable Milestones in Packaging Industry in South Africa Sector
- May 2021: Introduction of Extended Producer Responsibility (EPR) fees for plastic packaging.
- January 2020: Launch of the South African Plastics Pact, aiming for a circular economy for plastics.
In-Depth Packaging Industry in South Africa Market Outlook
The South African packaging market is poised for continued growth over the forecast period, driven by factors such as increasing consumption, technological advancements, and a growing emphasis on sustainability. Strategic investments in innovation, sustainable practices, and efficient supply chains will be crucial for success in this dynamic market. Opportunities exist in developing specialized packaging solutions for niche markets and leveraging the growth of e-commerce.
Packaging Industry in South Africa Segmentation
-
1. Product Type
- 1.1. Bottles and Jars
- 1.2. Pouches
- 1.3. Bags
- 1.4. Films and Wraps
- 1.5. Other Product Types
-
2. Type of Plastic
- 2.1. Rigid
- 2.2. Flexible
-
3. Material
- 3.1. Polyethylene (PE)
- 3.2. Polypropylene (PP)
- 3.3. Polyvinyl Chloride (PVC)
- 3.4. Polyethylene Terephthalate (PET)
- 3.5. Other Materials
-
4. End-user Industry
- 4.1. Food
- 4.2. Beverages
- 4.3. Healthcare and Pharmaceuticals
- 4.4. Personal and Home Care
- 4.5. Other End-user Industries
Packaging Industry in South Africa Segmentation By Geography
-
1. North America
- 1.1. United States
- 1.2. Canada
- 1.3. Mexico
-
2. South America
- 2.1. Brazil
- 2.2. Argentina
- 2.3. Rest of South America
-
3. Europe
- 3.1. United Kingdom
- 3.2. Germany
- 3.3. France
- 3.4. Italy
- 3.5. Spain
- 3.6. Russia
- 3.7. Benelux
- 3.8. Nordics
- 3.9. Rest of Europe
-
4. Middle East & Africa
- 4.1. Turkey
- 4.2. Israel
- 4.3. GCC
- 4.4. North Africa
- 4.5. South Africa
- 4.6. Rest of Middle East & Africa
-
5. Asia Pacific
- 5.1. China
- 5.2. India
- 5.3. Japan
- 5.4. South Korea
- 5.5. ASEAN
- 5.6. Oceania
- 5.7. Rest of Asia Pacific
Packaging Industry in South Africa REPORT HIGHLIGHTS
| Aspects | Details |
|---|---|
| Study Period | 2019-2033 |
| Base Year | 2024 |
| Estimated Year | 2025 |
| Forecast Period | 2025-2033 |
| Historical Period | 2019-2024 |
| Growth Rate | CAGR of 2.89% from 2019-2033 |
| Segmentation |
|
Table of Contents
- 1. Introduction
- 1.1. Research Scope
- 1.2. Market Segmentation
- 1.3. Research Methodology
- 1.4. Definitions and Assumptions
- 2. Executive Summary
- 2.1. Introduction
- 3. Market Dynamics
- 3.1. Introduction
- 3.2. Market Drivers
- 3.2.1. Growing Demand for Consumer Goods; Favorable Packaging Properties Possessed by Plastic
- 3.3. Market Restrains
- 3.3.1. Fluctuating Raw Material Prices
- 3.4. Market Trends
- 3.4.1. Aggressive Recycling Rates of Plastic Products within the Country and an increase in Waste Generation
- 4. Market Factor Analysis
- 4.1. Porters Five Forces
- 4.2. Supply/Value Chain
- 4.3. PESTEL analysis
- 4.4. Market Entropy
- 4.5. Patent/Trademark Analysis
- 5. Global Packaging Industry in South Africa Analysis, Insights and Forecast, 2019-2031
- 5.1. Market Analysis, Insights and Forecast - by Product Type
- 5.1.1. Bottles and Jars
- 5.1.2. Pouches
- 5.1.3. Bags
- 5.1.4. Films and Wraps
- 5.1.5. Other Product Types
- 5.2. Market Analysis, Insights and Forecast - by Type of Plastic
- 5.2.1. Rigid
- 5.2.2. Flexible
- 5.3. Market Analysis, Insights and Forecast - by Material
- 5.3.1. Polyethylene (PE)
- 5.3.2. Polypropylene (PP)
- 5.3.3. Polyvinyl Chloride (PVC)
- 5.3.4. Polyethylene Terephthalate (PET)
- 5.3.5. Other Materials
- 5.4. Market Analysis, Insights and Forecast - by End-user Industry
- 5.4.1. Food
- 5.4.2. Beverages
- 5.4.3. Healthcare and Pharmaceuticals
- 5.4.4. Personal and Home Care
- 5.4.5. Other End-user Industries
- 5.5. Market Analysis, Insights and Forecast - by Region
- 5.5.1. North America
- 5.5.2. South America
- 5.5.3. Europe
- 5.5.4. Middle East & Africa
- 5.5.5. Asia Pacific
- 5.1. Market Analysis, Insights and Forecast - by Product Type
- 6. North America Packaging Industry in South Africa Analysis, Insights and Forecast, 2019-2031
- 6.1. Market Analysis, Insights and Forecast - by Product Type
- 6.1.1. Bottles and Jars
- 6.1.2. Pouches
- 6.1.3. Bags
- 6.1.4. Films and Wraps
- 6.1.5. Other Product Types
- 6.2. Market Analysis, Insights and Forecast - by Type of Plastic
- 6.2.1. Rigid
- 6.2.2. Flexible
- 6.3. Market Analysis, Insights and Forecast - by Material
- 6.3.1. Polyethylene (PE)
- 6.3.2. Polypropylene (PP)
- 6.3.3. Polyvinyl Chloride (PVC)
- 6.3.4. Polyethylene Terephthalate (PET)
- 6.3.5. Other Materials
- 6.4. Market Analysis, Insights and Forecast - by End-user Industry
- 6.4.1. Food
- 6.4.2. Beverages
- 6.4.3. Healthcare and Pharmaceuticals
- 6.4.4. Personal and Home Care
- 6.4.5. Other End-user Industries
- 6.1. Market Analysis, Insights and Forecast - by Product Type
- 7. South America Packaging Industry in South Africa Analysis, Insights and Forecast, 2019-2031
- 7.1. Market Analysis, Insights and Forecast - by Product Type
- 7.1.1. Bottles and Jars
- 7.1.2. Pouches
- 7.1.3. Bags
- 7.1.4. Films and Wraps
- 7.1.5. Other Product Types
- 7.2. Market Analysis, Insights and Forecast - by Type of Plastic
- 7.2.1. Rigid
- 7.2.2. Flexible
- 7.3. Market Analysis, Insights and Forecast - by Material
- 7.3.1. Polyethylene (PE)
- 7.3.2. Polypropylene (PP)
- 7.3.3. Polyvinyl Chloride (PVC)
- 7.3.4. Polyethylene Terephthalate (PET)
- 7.3.5. Other Materials
- 7.4. Market Analysis, Insights and Forecast - by End-user Industry
- 7.4.1. Food
- 7.4.2. Beverages
- 7.4.3. Healthcare and Pharmaceuticals
- 7.4.4. Personal and Home Care
- 7.4.5. Other End-user Industries
- 7.1. Market Analysis, Insights and Forecast - by Product Type
- 8. Europe Packaging Industry in South Africa Analysis, Insights and Forecast, 2019-2031
- 8.1. Market Analysis, Insights and Forecast - by Product Type
- 8.1.1. Bottles and Jars
- 8.1.2. Pouches
- 8.1.3. Bags
- 8.1.4. Films and Wraps
- 8.1.5. Other Product Types
- 8.2. Market Analysis, Insights and Forecast - by Type of Plastic
- 8.2.1. Rigid
- 8.2.2. Flexible
- 8.3. Market Analysis, Insights and Forecast - by Material
- 8.3.1. Polyethylene (PE)
- 8.3.2. Polypropylene (PP)
- 8.3.3. Polyvinyl Chloride (PVC)
- 8.3.4. Polyethylene Terephthalate (PET)
- 8.3.5. Other Materials
- 8.4. Market Analysis, Insights and Forecast - by End-user Industry
- 8.4.1. Food
- 8.4.2. Beverages
- 8.4.3. Healthcare and Pharmaceuticals
- 8.4.4. Personal and Home Care
- 8.4.5. Other End-user Industries
- 8.1. Market Analysis, Insights and Forecast - by Product Type
- 9. Middle East & Africa Packaging Industry in South Africa Analysis, Insights and Forecast, 2019-2031
- 9.1. Market Analysis, Insights and Forecast - by Product Type
- 9.1.1. Bottles and Jars
- 9.1.2. Pouches
- 9.1.3. Bags
- 9.1.4. Films and Wraps
- 9.1.5. Other Product Types
- 9.2. Market Analysis, Insights and Forecast - by Type of Plastic
- 9.2.1. Rigid
- 9.2.2. Flexible
- 9.3. Market Analysis, Insights and Forecast - by Material
- 9.3.1. Polyethylene (PE)
- 9.3.2. Polypropylene (PP)
- 9.3.3. Polyvinyl Chloride (PVC)
- 9.3.4. Polyethylene Terephthalate (PET)
- 9.3.5. Other Materials
- 9.4. Market Analysis, Insights and Forecast - by End-user Industry
- 9.4.1. Food
- 9.4.2. Beverages
- 9.4.3. Healthcare and Pharmaceuticals
- 9.4.4. Personal and Home Care
- 9.4.5. Other End-user Industries
- 9.1. Market Analysis, Insights and Forecast - by Product Type
- 10. Asia Pacific Packaging Industry in South Africa Analysis, Insights and Forecast, 2019-2031
- 10.1. Market Analysis, Insights and Forecast - by Product Type
- 10.1.1. Bottles and Jars
- 10.1.2. Pouches
- 10.1.3. Bags
- 10.1.4. Films and Wraps
- 10.1.5. Other Product Types
- 10.2. Market Analysis, Insights and Forecast - by Type of Plastic
- 10.2.1. Rigid
- 10.2.2. Flexible
- 10.3. Market Analysis, Insights and Forecast - by Material
- 10.3.1. Polyethylene (PE)
- 10.3.2. Polypropylene (PP)
- 10.3.3. Polyvinyl Chloride (PVC)
- 10.3.4. Polyethylene Terephthalate (PET)
- 10.3.5. Other Materials
- 10.4. Market Analysis, Insights and Forecast - by End-user Industry
- 10.4.1. Food
- 10.4.2. Beverages
- 10.4.3. Healthcare and Pharmaceuticals
- 10.4.4. Personal and Home Care
- 10.4.5. Other End-user Industries
- 10.1. Market Analysis, Insights and Forecast - by Product Type
- 11. South Africa Packaging Industry in South Africa Analysis, Insights and Forecast, 2019-2031
- 12. Sudan Packaging Industry in South Africa Analysis, Insights and Forecast, 2019-2031
- 13. Uganda Packaging Industry in South Africa Analysis, Insights and Forecast, 2019-2031
- 14. Tanzania Packaging Industry in South Africa Analysis, Insights and Forecast, 2019-2031
- 15. Kenya Packaging Industry in South Africa Analysis, Insights and Forecast, 2019-2031
- 16. Rest of Africa Packaging Industry in South Africa Analysis, Insights and Forecast, 2019-2031
- 17. Competitive Analysis
- 17.1. Global Market Share Analysis 2024
- 17.2. Company Profiles
- 17.2.1 Italpac (Pty) Ltd
- 17.2.1.1. Overview
- 17.2.1.2. Products
- 17.2.1.3. SWOT Analysis
- 17.2.1.4. Recent Developments
- 17.2.1.5. Financials (Based on Availability)
- 17.2.2 RPC Astrapak Ltd
- 17.2.2.1. Overview
- 17.2.2.2. Products
- 17.2.2.3. SWOT Analysis
- 17.2.2.4. Recent Developments
- 17.2.2.5. Financials (Based on Availability)
- 17.2.3 Nampak Ltd
- 17.2.3.1. Overview
- 17.2.3.2. Products
- 17.2.3.3. SWOT Analysis
- 17.2.3.4. Recent Developments
- 17.2.3.5. Financials (Based on Availability)
- 17.2.4 Nioro Plastics (Pty) Ltd*List Not Exhaustive
- 17.2.4.1. Overview
- 17.2.4.2. Products
- 17.2.4.3. SWOT Analysis
- 17.2.4.4. Recent Developments
- 17.2.4.5. Financials (Based on Availability)
- 17.2.5 Tetra Pak Ltd
- 17.2.5.1. Overview
- 17.2.5.2. Products
- 17.2.5.3. SWOT Analysis
- 17.2.5.4. Recent Developments
- 17.2.5.5. Financials (Based on Availability)
- 17.2.6 Mondi PLC
- 17.2.6.1. Overview
- 17.2.6.2. Products
- 17.2.6.3. SWOT Analysis
- 17.2.6.4. Recent Developments
- 17.2.6.5. Financials (Based on Availability)
- 17.2.7 Mpact Ltd
- 17.2.7.1. Overview
- 17.2.7.2. Products
- 17.2.7.3. SWOT Analysis
- 17.2.7.4. Recent Developments
- 17.2.7.5. Financials (Based on Availability)
- 17.2.8 Amcor Limited
- 17.2.8.1. Overview
- 17.2.8.2. Products
- 17.2.8.3. SWOT Analysis
- 17.2.8.4. Recent Developments
- 17.2.8.5. Financials (Based on Availability)
- 17.2.9 Sealed Air Corporation
- 17.2.9.1. Overview
- 17.2.9.2. Products
- 17.2.9.3. SWOT Analysis
- 17.2.9.4. Recent Developments
- 17.2.9.5. Financials (Based on Availability)
- 17.2.10 Constantia Flexibles Corporation
- 17.2.10.1. Overview
- 17.2.10.2. Products
- 17.2.10.3. SWOT Analysis
- 17.2.10.4. Recent Developments
- 17.2.10.5. Financials (Based on Availability)
- 17.2.1 Italpac (Pty) Ltd
List of Figures
- Figure 1: Global Packaging Industry in South Africa Revenue Breakdown (Million, %) by Region 2024 & 2032
- Figure 2: Africa Packaging Industry in South Africa Revenue (Million), by Country 2024 & 2032
- Figure 3: Africa Packaging Industry in South Africa Revenue Share (%), by Country 2024 & 2032
- Figure 4: North America Packaging Industry in South Africa Revenue (Million), by Product Type 2024 & 2032
- Figure 5: North America Packaging Industry in South Africa Revenue Share (%), by Product Type 2024 & 2032
- Figure 6: North America Packaging Industry in South Africa Revenue (Million), by Type of Plastic 2024 & 2032
- Figure 7: North America Packaging Industry in South Africa Revenue Share (%), by Type of Plastic 2024 & 2032
- Figure 8: North America Packaging Industry in South Africa Revenue (Million), by Material 2024 & 2032
- Figure 9: North America Packaging Industry in South Africa Revenue Share (%), by Material 2024 & 2032
- Figure 10: North America Packaging Industry in South Africa Revenue (Million), by End-user Industry 2024 & 2032
- Figure 11: North America Packaging Industry in South Africa Revenue Share (%), by End-user Industry 2024 & 2032
- Figure 12: North America Packaging Industry in South Africa Revenue (Million), by Country 2024 & 2032
- Figure 13: North America Packaging Industry in South Africa Revenue Share (%), by Country 2024 & 2032
- Figure 14: South America Packaging Industry in South Africa Revenue (Million), by Product Type 2024 & 2032
- Figure 15: South America Packaging Industry in South Africa Revenue Share (%), by Product Type 2024 & 2032
- Figure 16: South America Packaging Industry in South Africa Revenue (Million), by Type of Plastic 2024 & 2032
- Figure 17: South America Packaging Industry in South Africa Revenue Share (%), by Type of Plastic 2024 & 2032
- Figure 18: South America Packaging Industry in South Africa Revenue (Million), by Material 2024 & 2032
- Figure 19: South America Packaging Industry in South Africa Revenue Share (%), by Material 2024 & 2032
- Figure 20: South America Packaging Industry in South Africa Revenue (Million), by End-user Industry 2024 & 2032
- Figure 21: South America Packaging Industry in South Africa Revenue Share (%), by End-user Industry 2024 & 2032
- Figure 22: South America Packaging Industry in South Africa Revenue (Million), by Country 2024 & 2032
- Figure 23: South America Packaging Industry in South Africa Revenue Share (%), by Country 2024 & 2032
- Figure 24: Europe Packaging Industry in South Africa Revenue (Million), by Product Type 2024 & 2032
- Figure 25: Europe Packaging Industry in South Africa Revenue Share (%), by Product Type 2024 & 2032
- Figure 26: Europe Packaging Industry in South Africa Revenue (Million), by Type of Plastic 2024 & 2032
- Figure 27: Europe Packaging Industry in South Africa Revenue Share (%), by Type of Plastic 2024 & 2032
- Figure 28: Europe Packaging Industry in South Africa Revenue (Million), by Material 2024 & 2032
- Figure 29: Europe Packaging Industry in South Africa Revenue Share (%), by Material 2024 & 2032
- Figure 30: Europe Packaging Industry in South Africa Revenue (Million), by End-user Industry 2024 & 2032
- Figure 31: Europe Packaging Industry in South Africa Revenue Share (%), by End-user Industry 2024 & 2032
- Figure 32: Europe Packaging Industry in South Africa Revenue (Million), by Country 2024 & 2032
- Figure 33: Europe Packaging Industry in South Africa Revenue Share (%), by Country 2024 & 2032
- Figure 34: Middle East & Africa Packaging Industry in South Africa Revenue (Million), by Product Type 2024 & 2032
- Figure 35: Middle East & Africa Packaging Industry in South Africa Revenue Share (%), by Product Type 2024 & 2032
- Figure 36: Middle East & Africa Packaging Industry in South Africa Revenue (Million), by Type of Plastic 2024 & 2032
- Figure 37: Middle East & Africa Packaging Industry in South Africa Revenue Share (%), by Type of Plastic 2024 & 2032
- Figure 38: Middle East & Africa Packaging Industry in South Africa Revenue (Million), by Material 2024 & 2032
- Figure 39: Middle East & Africa Packaging Industry in South Africa Revenue Share (%), by Material 2024 & 2032
- Figure 40: Middle East & Africa Packaging Industry in South Africa Revenue (Million), by End-user Industry 2024 & 2032
- Figure 41: Middle East & Africa Packaging Industry in South Africa Revenue Share (%), by End-user Industry 2024 & 2032
- Figure 42: Middle East & Africa Packaging Industry in South Africa Revenue (Million), by Country 2024 & 2032
- Figure 43: Middle East & Africa Packaging Industry in South Africa Revenue Share (%), by Country 2024 & 2032
- Figure 44: Asia Pacific Packaging Industry in South Africa Revenue (Million), by Product Type 2024 & 2032
- Figure 45: Asia Pacific Packaging Industry in South Africa Revenue Share (%), by Product Type 2024 & 2032
- Figure 46: Asia Pacific Packaging Industry in South Africa Revenue (Million), by Type of Plastic 2024 & 2032
- Figure 47: Asia Pacific Packaging Industry in South Africa Revenue Share (%), by Type of Plastic 2024 & 2032
- Figure 48: Asia Pacific Packaging Industry in South Africa Revenue (Million), by Material 2024 & 2032
- Figure 49: Asia Pacific Packaging Industry in South Africa Revenue Share (%), by Material 2024 & 2032
- Figure 50: Asia Pacific Packaging Industry in South Africa Revenue (Million), by End-user Industry 2024 & 2032
- Figure 51: Asia Pacific Packaging Industry in South Africa Revenue Share (%), by End-user Industry 2024 & 2032
- Figure 52: Asia Pacific Packaging Industry in South Africa Revenue (Million), by Country 2024 & 2032
- Figure 53: Asia Pacific Packaging Industry in South Africa Revenue Share (%), by Country 2024 & 2032
List of Tables
- Table 1: Global Packaging Industry in South Africa Revenue Million Forecast, by Region 2019 & 2032
- Table 2: Global Packaging Industry in South Africa Revenue Million Forecast, by Product Type 2019 & 2032
- Table 3: Global Packaging Industry in South Africa Revenue Million Forecast, by Type of Plastic 2019 & 2032
- Table 4: Global Packaging Industry in South Africa Revenue Million Forecast, by Material 2019 & 2032
- Table 5: Global Packaging Industry in South Africa Revenue Million Forecast, by End-user Industry 2019 & 2032
- Table 6: Global Packaging Industry in South Africa Revenue Million Forecast, by Region 2019 & 2032
- Table 7: Global Packaging Industry in South Africa Revenue Million Forecast, by Country 2019 & 2032
- Table 8: South Africa Packaging Industry in South Africa Revenue (Million) Forecast, by Application 2019 & 2032
- Table 9: Sudan Packaging Industry in South Africa Revenue (Million) Forecast, by Application 2019 & 2032
- Table 10: Uganda Packaging Industry in South Africa Revenue (Million) Forecast, by Application 2019 & 2032
- Table 11: Tanzania Packaging Industry in South Africa Revenue (Million) Forecast, by Application 2019 & 2032
- Table 12: Kenya Packaging Industry in South Africa Revenue (Million) Forecast, by Application 2019 & 2032
- Table 13: Rest of Africa Packaging Industry in South Africa Revenue (Million) Forecast, by Application 2019 & 2032
- Table 14: Global Packaging Industry in South Africa Revenue Million Forecast, by Product Type 2019 & 2032
- Table 15: Global Packaging Industry in South Africa Revenue Million Forecast, by Type of Plastic 2019 & 2032
- Table 16: Global Packaging Industry in South Africa Revenue Million Forecast, by Material 2019 & 2032
- Table 17: Global Packaging Industry in South Africa Revenue Million Forecast, by End-user Industry 2019 & 2032
- Table 18: Global Packaging Industry in South Africa Revenue Million Forecast, by Country 2019 & 2032
- Table 19: United States Packaging Industry in South Africa Revenue (Million) Forecast, by Application 2019 & 2032
- Table 20: Canada Packaging Industry in South Africa Revenue (Million) Forecast, by Application 2019 & 2032
- Table 21: Mexico Packaging Industry in South Africa Revenue (Million) Forecast, by Application 2019 & 2032
- Table 22: Global Packaging Industry in South Africa Revenue Million Forecast, by Product Type 2019 & 2032
- Table 23: Global Packaging Industry in South Africa Revenue Million Forecast, by Type of Plastic 2019 & 2032
- Table 24: Global Packaging Industry in South Africa Revenue Million Forecast, by Material 2019 & 2032
- Table 25: Global Packaging Industry in South Africa Revenue Million Forecast, by End-user Industry 2019 & 2032
- Table 26: Global Packaging Industry in South Africa Revenue Million Forecast, by Country 2019 & 2032
- Table 27: Brazil Packaging Industry in South Africa Revenue (Million) Forecast, by Application 2019 & 2032
- Table 28: Argentina Packaging Industry in South Africa Revenue (Million) Forecast, by Application 2019 & 2032
- Table 29: Rest of South America Packaging Industry in South Africa Revenue (Million) Forecast, by Application 2019 & 2032
- Table 30: Global Packaging Industry in South Africa Revenue Million Forecast, by Product Type 2019 & 2032
- Table 31: Global Packaging Industry in South Africa Revenue Million Forecast, by Type of Plastic 2019 & 2032
- Table 32: Global Packaging Industry in South Africa Revenue Million Forecast, by Material 2019 & 2032
- Table 33: Global Packaging Industry in South Africa Revenue Million Forecast, by End-user Industry 2019 & 2032
- Table 34: Global Packaging Industry in South Africa Revenue Million Forecast, by Country 2019 & 2032
- Table 35: United Kingdom Packaging Industry in South Africa Revenue (Million) Forecast, by Application 2019 & 2032
- Table 36: Germany Packaging Industry in South Africa Revenue (Million) Forecast, by Application 2019 & 2032
- Table 37: France Packaging Industry in South Africa Revenue (Million) Forecast, by Application 2019 & 2032
- Table 38: Italy Packaging Industry in South Africa Revenue (Million) Forecast, by Application 2019 & 2032
- Table 39: Spain Packaging Industry in South Africa Revenue (Million) Forecast, by Application 2019 & 2032
- Table 40: Russia Packaging Industry in South Africa Revenue (Million) Forecast, by Application 2019 & 2032
- Table 41: Benelux Packaging Industry in South Africa Revenue (Million) Forecast, by Application 2019 & 2032
- Table 42: Nordics Packaging Industry in South Africa Revenue (Million) Forecast, by Application 2019 & 2032
- Table 43: Rest of Europe Packaging Industry in South Africa Revenue (Million) Forecast, by Application 2019 & 2032
- Table 44: Global Packaging Industry in South Africa Revenue Million Forecast, by Product Type 2019 & 2032
- Table 45: Global Packaging Industry in South Africa Revenue Million Forecast, by Type of Plastic 2019 & 2032
- Table 46: Global Packaging Industry in South Africa Revenue Million Forecast, by Material 2019 & 2032
- Table 47: Global Packaging Industry in South Africa Revenue Million Forecast, by End-user Industry 2019 & 2032
- Table 48: Global Packaging Industry in South Africa Revenue Million Forecast, by Country 2019 & 2032
- Table 49: Turkey Packaging Industry in South Africa Revenue (Million) Forecast, by Application 2019 & 2032
- Table 50: Israel Packaging Industry in South Africa Revenue (Million) Forecast, by Application 2019 & 2032
- Table 51: GCC Packaging Industry in South Africa Revenue (Million) Forecast, by Application 2019 & 2032
- Table 52: North Africa Packaging Industry in South Africa Revenue (Million) Forecast, by Application 2019 & 2032
- Table 53: South Africa Packaging Industry in South Africa Revenue (Million) Forecast, by Application 2019 & 2032
- Table 54: Rest of Middle East & Africa Packaging Industry in South Africa Revenue (Million) Forecast, by Application 2019 & 2032
- Table 55: Global Packaging Industry in South Africa Revenue Million Forecast, by Product Type 2019 & 2032
- Table 56: Global Packaging Industry in South Africa Revenue Million Forecast, by Type of Plastic 2019 & 2032
- Table 57: Global Packaging Industry in South Africa Revenue Million Forecast, by Material 2019 & 2032
- Table 58: Global Packaging Industry in South Africa Revenue Million Forecast, by End-user Industry 2019 & 2032
- Table 59: Global Packaging Industry in South Africa Revenue Million Forecast, by Country 2019 & 2032
- Table 60: China Packaging Industry in South Africa Revenue (Million) Forecast, by Application 2019 & 2032
- Table 61: India Packaging Industry in South Africa Revenue (Million) Forecast, by Application 2019 & 2032
- Table 62: Japan Packaging Industry in South Africa Revenue (Million) Forecast, by Application 2019 & 2032
- Table 63: South Korea Packaging Industry in South Africa Revenue (Million) Forecast, by Application 2019 & 2032
- Table 64: ASEAN Packaging Industry in South Africa Revenue (Million) Forecast, by Application 2019 & 2032
- Table 65: Oceania Packaging Industry in South Africa Revenue (Million) Forecast, by Application 2019 & 2032
- Table 66: Rest of Asia Pacific Packaging Industry in South Africa Revenue (Million) Forecast, by Application 2019 & 2032
Frequently Asked Questions
1. What is the projected Compound Annual Growth Rate (CAGR) of the Packaging Industry in South Africa?
The projected CAGR is approximately 2.89%.
2. Which companies are prominent players in the Packaging Industry in South Africa?
Key companies in the market include Italpac (Pty) Ltd, RPC Astrapak Ltd, Nampak Ltd, Nioro Plastics (Pty) Ltd*List Not Exhaustive, Tetra Pak Ltd, Mondi PLC, Mpact Ltd, Amcor Limited, Sealed Air Corporation, Constantia Flexibles Corporation.
3. What are the main segments of the Packaging Industry in South Africa?
The market segments include Product Type, Type of Plastic, Material, End-user Industry.
4. Can you provide details about the market size?
The market size is estimated to be USD 2.59 Million as of 2022.
5. What are some drivers contributing to market growth?
Growing Demand for Consumer Goods; Favorable Packaging Properties Possessed by Plastic.
6. What are the notable trends driving market growth?
Aggressive Recycling Rates of Plastic Products within the Country and an increase in Waste Generation.
7. Are there any restraints impacting market growth?
Fluctuating Raw Material Prices.
8. Can you provide examples of recent developments in the market?
May 2021 - The country released a new regulation that requires any company or brand that makes or imports any form of plastic packaging for distribution in South Africa to pay an extended producer responsibility (EPR) fee per tonne from 5 May 2021. Strict government targets have been set for annual collection and recycling over the next five years, and the EPR is positioned to invest in collection infrastructure in the country. Existing producers are expected to register with the Department of Environment, Forestry, and Fisheries by November 2021.
9. What pricing options are available for accessing the report?
Pricing options include single-user, multi-user, and enterprise licenses priced at USD 3800, USD 4500, and USD 5800 respectively.
10. Is the market size provided in terms of value or volume?
The market size is provided in terms of value, measured in Million.
11. Are there any specific market keywords associated with the report?
Yes, the market keyword associated with the report is "Packaging Industry in South Africa," which aids in identifying and referencing the specific market segment covered.
12. How do I determine which pricing option suits my needs best?
The pricing options vary based on user requirements and access needs. Individual users may opt for single-user licenses, while businesses requiring broader access may choose multi-user or enterprise licenses for cost-effective access to the report.
13. Are there any additional resources or data provided in the Packaging Industry in South Africa report?
While the report offers comprehensive insights, it's advisable to review the specific contents or supplementary materials provided to ascertain if additional resources or data are available.
14. How can I stay updated on further developments or reports in the Packaging Industry in South Africa?
To stay informed about further developments, trends, and reports in the Packaging Industry in South Africa, consider subscribing to industry newsletters, following relevant companies and organizations, or regularly checking reputable industry news sources and publications.
Methodology
Step 1 - Identification of Relevant Samples Size from Population Database


Step 2 - Approaches for Defining Global Market Size (Value, Volume* & Price*)

Note*: In applicable scenarios
Step 3 - Data Sources
Primary Research
- Web Analytics
- Survey Reports
- Research Institute
- Latest Research Reports
- Opinion Leaders
Secondary Research
- Annual Reports
- White Paper
- Latest Press Release
- Industry Association
- Paid Database
- Investor Presentations

Step 4 - Data Triangulation
Involves using different sources of information in order to increase the validity of a study
These sources are likely to be stakeholders in a program - participants, other researchers, program staff, other community members, and so on.
Then we put all data in single framework & apply various statistical tools to find out the dynamic on the market.
During the analysis stage, feedback from the stakeholder groups would be compared to determine areas of agreement as well as areas of divergence


