

Key Insights
The global oxygen market, projected at 87.93 million in 2025, is forecast to achieve a compound annual growth rate (CAGR) of 4.59% through 2033. This growth is propelled by escalating demand in the healthcare sector, particularly for medical oxygen in hospital and homecare settings, alongside robust industrial applications across metallurgy, chemical manufacturing, and oil & gas extraction. Technological advancements in production and delivery, coupled with industrialization in emerging economies, further bolster market expansion. Key market segments include medical and industrial oxygen, with applications spanning metals & mining, chemicals, oil & gas, and healthcare. Intense competition among key players like Air Liquide and Linde plc drives innovation and pricing strategies.
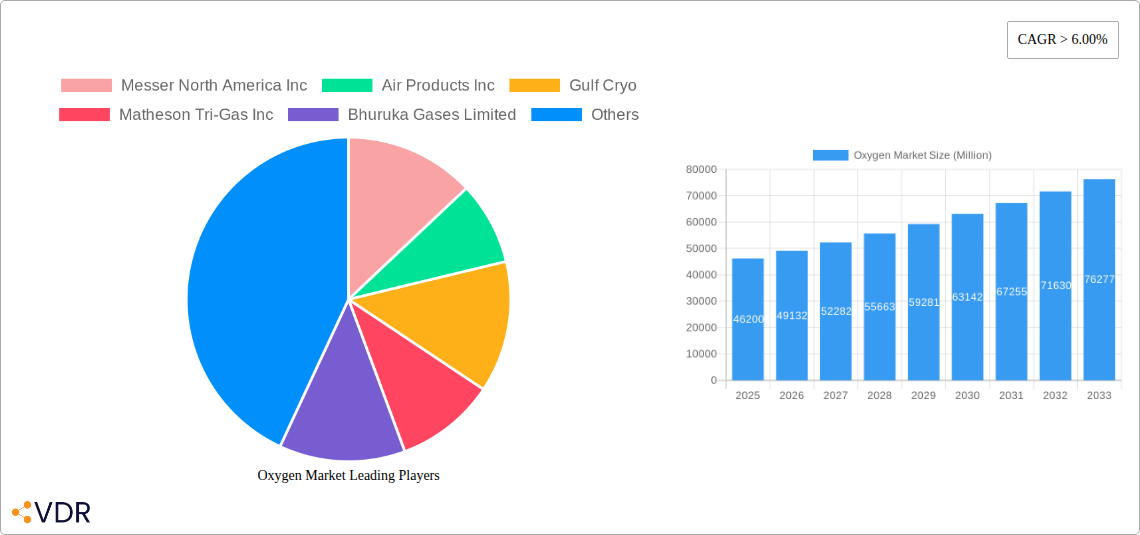
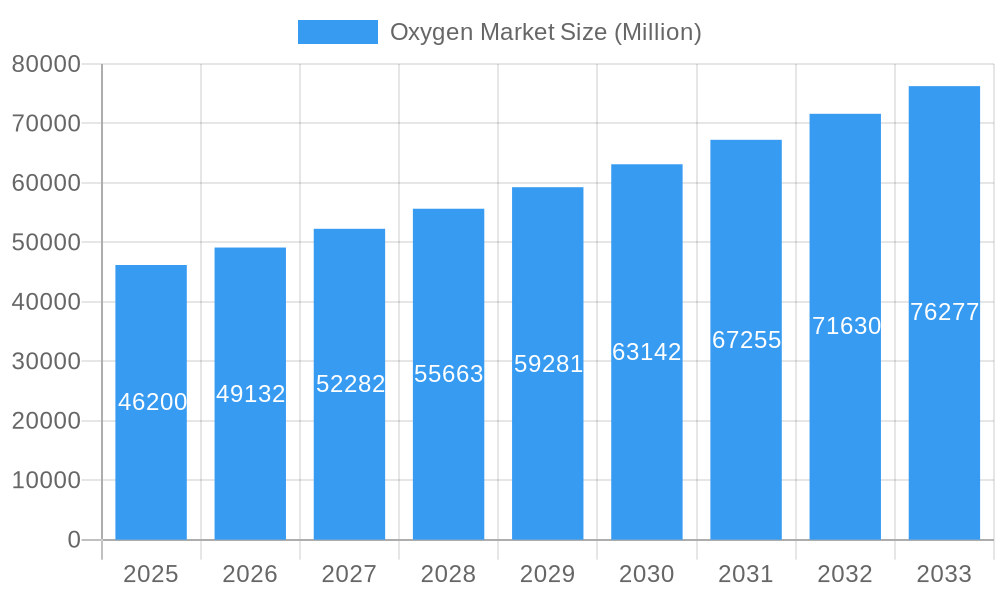
Oxygen Market Market Size (In Million)
The medical oxygen segment is expected to grow significantly due to increased healthcare spending and an aging global population. Industrial applications, especially in rapidly industrializing emerging economies, will be substantial drivers. Asia-Pacific is anticipated to be a major growth region, supported by expanding healthcare infrastructure and industrial activity in China and India. Mature markets in North America and Europe will continue to contribute due to established healthcare systems and industrial bases. The forecast period (2025-2033) indicates sustained growth, influenced by global economic expansion and ongoing demand across various sectors. Strategic collaborations and technological innovations are expected to shape market dynamics.
Oxygen Market Company Market Share
This report offers an in-depth analysis of the global oxygen market, covering market dynamics, growth trends, regional insights, product segmentation, competitive landscape, and future projections. The analysis spans the historical period (2019-2024), the base year (2025), and provides forecasts through 2033. This data offers critical insights for industry stakeholders, investors, and professionals. The broader market context includes Industrial Gases, with Oxygen as a specific sub-segment.
Oxygen Market Market Dynamics & Structure
The oxygen market is characterized by a moderately concentrated structure, with several multinational corporations holding significant market shares. Technological innovation, particularly in air separation technologies and delivery systems, is a key driver. Stringent regulatory frameworks related to safety and environmental compliance influence market operations. The market also faces competition from substitute products, such as hydrogen in certain industrial applications. End-user demographics vary significantly across different applications, with industrial segments (metals and mining, chemical industry, oil & gas) dominating the market volume.
- Market Concentration: The top five players hold approximately xx% of the global market share in 2025 (Estimated).
- Technological Innovation: Focus on energy efficiency in air separation units (ASUs) and the development of on-site oxygen generation systems are driving growth.
- Regulatory Landscape: Emission standards and safety regulations (e.g., related to cryogenic storage and transportation) impose significant operational costs.
- M&A Activity: Significant consolidation is observed, with xx major M&A deals completed between 2019 and 2024, representing a total transaction value of xx Million USD (Estimated).
Oxygen Market Growth Trends & Insights
The global oxygen market is experiencing robust expansion, fueled by escalating industrial activities, particularly within burgeoning economies. Projections indicate the market size will reach an impressive [Insert Specific Million Unit Figure Here] million units by 2033, demonstrating a Compound Annual Growth Rate (CAGR) of approximately [Insert Specific CAGR Percentage Here]% during the forecast period of 2025-2033. This growth is further propelled by significant technological advancements, such as the development of more energy-efficient Air Separation Units (ASUs), which are enhancing market adoption and operational efficiency. Evolving consumer preferences, with an increasing inclination towards sustainable and environmentally conscious solutions, are also playing a pivotal role in shaping market dynamics. Opportunities for expansion are particularly evident in segments like healthcare within emerging markets, where market penetration is currently at a nascent stage. The sustained and heightened demand for medical oxygen, especially in the wake of recent global health events, stands as a critical growth catalyst. A detailed analysis of segment-specific growth figures is available in the comprehensive market report.
Dominant Regions, Countries, or Segments in Oxygen Market
The Asia-Pacific region stands at the forefront of the global oxygen market, propelled by its accelerated industrialization and extensive infrastructural development, notably in China and India. In terms of application segments, the industrial sector commands the largest market share, estimated at [Insert Specific Percentage Here]% in 2025, closely followed by the medical and healthcare sector. By form, gaseous oxygen dominates in terms of volume, with liquid oxygen also representing a significant portion of the market.
- Key Growth Drivers:
- Rapid industrial expansion in developing economic regions.
- Surging demand from vital sectors including metals & mining, chemicals, and oil & gas.
- Continuous enhancement of healthcare infrastructure and a growing imperative for medical oxygen supply.
- Supportive government policies designed to foster industrial advancement and growth.
- Regional Dominance: Asia-Pacific currently holds a substantial market share, estimated at around [Insert Specific Percentage Here]%, with North America and Europe following as significant regional contributors.
- Segment Dominance: The industrial applications segment remains the largest contributor to the market's overall value, with medical oxygen representing the second-largest segment.
Oxygen Market Product Landscape
The oxygen market offers a diverse array of products, available in gaseous, liquid, and solid forms, each tailored to meet the specific requirements of a wide range of applications. Medical-grade oxygen adheres to exceptionally stringent purity standards to ensure patient safety, while industrial applications often have specifications that vary based on the precise end-use. Recent innovations are centered on the development of more efficient and compact Air Separation Unit (ASU) technologies, alongside the enhancement of delivery systems to improve safety, convenience, and logistical ease. Key differentiating factors for market players often revolve around the assurance of high purity, unwavering reliability, and competitive cost-effectiveness.
Key Drivers, Barriers & Challenges in Oxygen Market
Key Drivers:
- The sustained upward trend in global industrial output and manufacturing activity.
- The escalating demand for medical-grade oxygen, especially in emerging economies with expanding healthcare access.
- Continuous technological advancements that yield more efficient and economically viable oxygen production methods.
- The increasing implementation of stringent environmental regulations, which drive the adoption of cleaner production processes.
Key Challenges & Restraints:
- Volatility in raw material costs, particularly energy prices, can impact production expenses.
- The complex nature of safety regulations and the logistical challenges associated with transporting cryogenic gases.
- Intense competition from well-established market players.
- Potential disruptions in the supply chain affecting the availability of critical raw materials and necessary equipment.
Emerging Opportunities in Oxygen Market
- Expanding into untapped markets in developing economies.
- Development of novel oxygen delivery systems for healthcare and industrial applications.
- Growth in on-site oxygen generation systems for smaller-scale operations.
- Increasing demand for high-purity oxygen in specialized industrial processes.
Growth Accelerators in the Oxygen Market Industry
Technological advancements, such as the development of more energy-efficient air separation technologies, will drive long-term market growth. Strategic partnerships and collaborations among key players to enhance supply chain efficiency and market reach will also be important. The expansion into new geographic markets, especially within rapidly developing economies, presents significant opportunities for growth.
Key Players Shaping the Oxygen Market Market
- Messer North America Inc
- Air Products Inc
- Gulf Cryo
- Matheson Tri-Gas Inc
- Bhuruka Gases Limited
- Inox-Air Products Inc
- Daesung Group
- Linde plc
- Nippon Gases
- TAIYO NIPPON SANSO CORPORATION
- Yingde Gases Group
- KOATSU GAS KOGYO CO LTD
- Air Liquide
- SHOWA DENKO K K
- SOL Spa
Notable Milestones in Oxygen Market Sector
- July 2021: Linde launched a new on-site facility in Qinzhou, China, with a capacity of 7,500 tons of oxygen per day.
- June 2021: Air Liquide acquired Sasol's 16 Air Separation Units in Secunda, South Africa, creating the world's largest oxygen production site.
- June 2021: Air Liquide signed a long-term contract with PAO Severstal to supply oxygen to its Severstal ChemMK site in Russia.
- February 2021: Inox-Air Products planned an INR 2000 crore investment to build 8 new air separation units in India.
In-Depth Oxygen Market Market Outlook
The oxygen market is poised for robust growth over the next decade, driven by increasing industrial demand, technological innovation, and expansion into new markets. Strategic investments in capacity expansion, technological upgrades, and strategic partnerships will be crucial for success. The market presents attractive opportunities for both established players and new entrants, particularly in regions with strong economic growth and increasing industrial activity. Companies focusing on sustainable and environmentally friendly production methods will also gain a competitive edge.
Oxygen Market Segmentation
-
1. Form
- 1.1. Gas
- 1.2. Liquid
- 1.3. Solid
-
2. Type
- 2.1. Medical
- 2.2. Industrial
- 2.3. Other Types (Scientific and Electronic)
-
3. Application
- 3.1. Metals and Mining
- 3.2. Chemical Industry
- 3.3. Oil and Gas
- 3.4. Healthcare
- 3.5. Pharmaceutical
- 3.6. Other Ap
Oxygen Market Segmentation By Geography
-
1. Asia Pacific
- 1.1. China
- 1.2. India
- 1.3. Japan
- 1.4. South Korea
- 1.5. Malaysia
- 1.6. Thailand
- 1.7. Indonesia
- 1.8. Vietnam
- 1.9. Rest of Asia Pacific
-
2. North America
- 2.1. United States
- 2.2. Canada
- 2.3. Mexico
-
3. Europe
- 3.1. Germany
- 3.2. United Kingdom
- 3.3. France
- 3.4. Italy
- 3.5. Spain
- 3.6. NORDIC Countries
- 3.7. Turkey
- 3.8. Russia
- 3.9. Rest of Europe
-
4. South America
- 4.1. Brazil
- 4.2. Argentina
- 4.3. Colombia
- 4.4. Rest of South America
-
5. Middle East and Africa
- 5.1. Saudi Arabia
- 5.2. Qatar
- 5.3. United Arab Emirates
- 5.4. Nigeria
- 5.5. Egypt
- 5.6. South Africa
- 5.7. Rest of Middle East and Africa
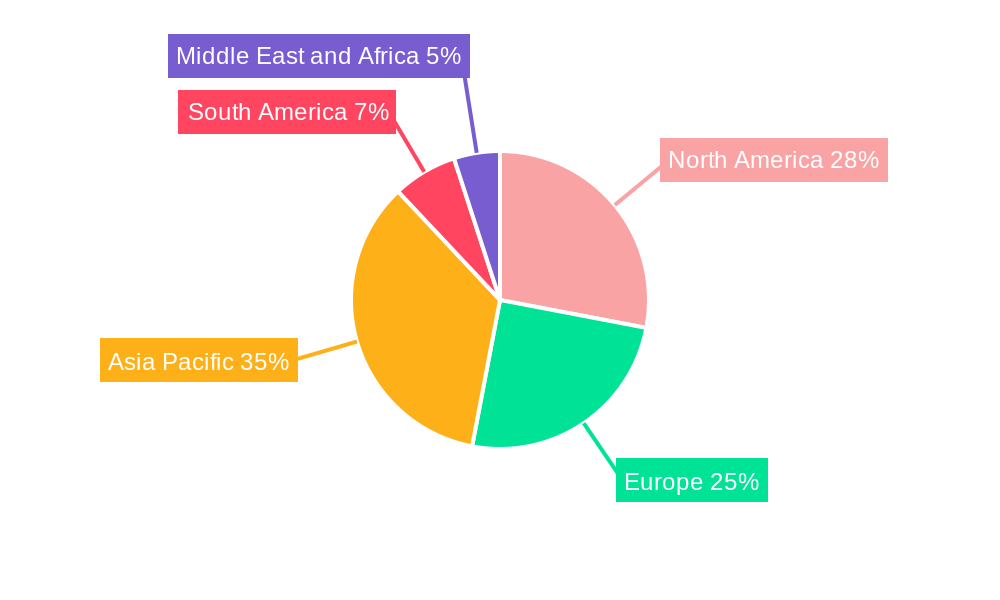
Oxygen Market Regional Market Share
Geographic Coverage of Oxygen Market
Oxygen Market REPORT HIGHLIGHTS
| Aspects | Details |
|---|---|
| Study Period | 2020-2034 |
| Base Year | 2025 |
| Estimated Year | 2026 |
| Forecast Period | 2026-2034 |
| Historical Period | 2020-2025 |
| Growth Rate | CAGR of 4.59% from 2020-2034 |
| Segmentation |
|
Table of Contents
- 1. Introduction
- 1.1. Research Scope
- 1.2. Market Segmentation
- 1.3. Research Objective
- 1.4. Definitions and Assumptions
- 2. Executive Summary
- 2.1. Market Snapshot
- 3. Market Dynamics
- 3.1. Market Drivers
- 3.2. Market Restrains
- 3.3. Market Trends
- 3.4. Market Opportunities
- 4. Market Factor Analysis
- 4.1. Porters Five Forces
- 4.1.1. Bargaining Power of Suppliers
- 4.1.2. Bargaining Power of Buyers
- 4.1.3. Threat of New Entrants
- 4.1.4. Threat of Substitutes
- 4.1.5. Competitive Rivalry
- 4.2. PESTEL analysis
- 4.3. BCG Analysis
- 4.3.1. Stars (High Growth, High Market Share)
- 4.3.2. Cash Cows (Low Growth, High Market Share)
- 4.3.3. Question Mark (High Growth, Low Market Share)
- 4.3.4. Dogs (Low Growth, Low Market Share)
- 4.4. Ansoff Matrix Analysis
- 4.5. Supply Chain Analysis
- 4.6. Regulatory Landscape
- 4.7. Current Market Potential and Opportunity Assessment (TAM–SAM–SOM Framework)
- 4.8. VDR Analyst Note
- 4.1. Porters Five Forces
- 5. Market Analysis, Insights and Forecast 2021-2033
- 5.1. Market Analysis, Insights and Forecast - by Form
- 5.1.1. Gas
- 5.1.2. Liquid
- 5.1.3. Solid
- 5.2. Market Analysis, Insights and Forecast - by Type
- 5.2.1. Medical
- 5.2.2. Industrial
- 5.2.3. Other Types (Scientific and Electronic)
- 5.3. Market Analysis, Insights and Forecast - by Application
- 5.3.1. Metals and Mining
- 5.3.2. Chemical Industry
- 5.3.3. Oil and Gas
- 5.3.4. Healthcare
- 5.3.5. Pharmaceutical
- 5.3.6. Other Ap
- 5.4. Market Analysis, Insights and Forecast - by Region
- 5.4.1. Asia Pacific
- 5.4.2. North America
- 5.4.3. Europe
- 5.4.4. South America
- 5.4.5. Middle East and Africa
- 5.1. Market Analysis, Insights and Forecast - by Form
- 6. Global Oxygen Market Analysis, Insights and Forecast, 2021-2033
- 6.1. Market Analysis, Insights and Forecast - by Form
- 6.1.1. Gas
- 6.1.2. Liquid
- 6.1.3. Solid
- 6.2. Market Analysis, Insights and Forecast - by Type
- 6.2.1. Medical
- 6.2.2. Industrial
- 6.2.3. Other Types (Scientific and Electronic)
- 6.3. Market Analysis, Insights and Forecast - by Application
- 6.3.1. Metals and Mining
- 6.3.2. Chemical Industry
- 6.3.3. Oil and Gas
- 6.3.4. Healthcare
- 6.3.5. Pharmaceutical
- 6.3.6. Other Ap
- 6.1. Market Analysis, Insights and Forecast - by Form
- 7. Asia Pacific Oxygen Market Analysis, Insights and Forecast, 2021-2033
- 7.1. Market Analysis, Insights and Forecast - by Form
- 7.1.1. Gas
- 7.1.2. Liquid
- 7.1.3. Solid
- 7.2. Market Analysis, Insights and Forecast - by Type
- 7.2.1. Medical
- 7.2.2. Industrial
- 7.2.3. Other Types (Scientific and Electronic)
- 7.3. Market Analysis, Insights and Forecast - by Application
- 7.3.1. Metals and Mining
- 7.3.2. Chemical Industry
- 7.3.3. Oil and Gas
- 7.3.4. Healthcare
- 7.3.5. Pharmaceutical
- 7.3.6. Other Ap
- 7.1. Market Analysis, Insights and Forecast - by Form
- 8. North America Oxygen Market Analysis, Insights and Forecast, 2021-2033
- 8.1. Market Analysis, Insights and Forecast - by Form
- 8.1.1. Gas
- 8.1.2. Liquid
- 8.1.3. Solid
- 8.2. Market Analysis, Insights and Forecast - by Type
- 8.2.1. Medical
- 8.2.2. Industrial
- 8.2.3. Other Types (Scientific and Electronic)
- 8.3. Market Analysis, Insights and Forecast - by Application
- 8.3.1. Metals and Mining
- 8.3.2. Chemical Industry
- 8.3.3. Oil and Gas
- 8.3.4. Healthcare
- 8.3.5. Pharmaceutical
- 8.3.6. Other Ap
- 8.1. Market Analysis, Insights and Forecast - by Form
- 9. Europe Oxygen Market Analysis, Insights and Forecast, 2021-2033
- 9.1. Market Analysis, Insights and Forecast - by Form
- 9.1.1. Gas
- 9.1.2. Liquid
- 9.1.3. Solid
- 9.2. Market Analysis, Insights and Forecast - by Type
- 9.2.1. Medical
- 9.2.2. Industrial
- 9.2.3. Other Types (Scientific and Electronic)
- 9.3. Market Analysis, Insights and Forecast - by Application
- 9.3.1. Metals and Mining
- 9.3.2. Chemical Industry
- 9.3.3. Oil and Gas
- 9.3.4. Healthcare
- 9.3.5. Pharmaceutical
- 9.3.6. Other Ap
- 9.1. Market Analysis, Insights and Forecast - by Form
- 10. South America Oxygen Market Analysis, Insights and Forecast, 2021-2033
- 10.1. Market Analysis, Insights and Forecast - by Form
- 10.1.1. Gas
- 10.1.2. Liquid
- 10.1.3. Solid
- 10.2. Market Analysis, Insights and Forecast - by Type
- 10.2.1. Medical
- 10.2.2. Industrial
- 10.2.3. Other Types (Scientific and Electronic)
- 10.3. Market Analysis, Insights and Forecast - by Application
- 10.3.1. Metals and Mining
- 10.3.2. Chemical Industry
- 10.3.3. Oil and Gas
- 10.3.4. Healthcare
- 10.3.5. Pharmaceutical
- 10.3.6. Other Ap
- 10.1. Market Analysis, Insights and Forecast - by Form
- 11. Middle East and Africa Oxygen Market Analysis, Insights and Forecast, 2021-2033
- 11.1. Market Analysis, Insights and Forecast - by Form
- 11.1.1. Gas
- 11.1.2. Liquid
- 11.1.3. Solid
- 11.2. Market Analysis, Insights and Forecast - by Type
- 11.2.1. Medical
- 11.2.2. Industrial
- 11.2.3. Other Types (Scientific and Electronic)
- 11.3. Market Analysis, Insights and Forecast - by Application
- 11.3.1. Metals and Mining
- 11.3.2. Chemical Industry
- 11.3.3. Oil and Gas
- 11.3.4. Healthcare
- 11.3.5. Pharmaceutical
- 11.3.6. Other Ap
- 11.1. Market Analysis, Insights and Forecast - by Form
- 12. Competitive Analysis
- 12.1. Company Profiles
- 12.1.1 Messer North America Inc
- 12.1.1.1. Company Overview
- 12.1.1.2. Products
- 12.1.1.3. Company Financials
- 12.1.1.4. SWOT Analysis
- 12.1.2 Air Products Inc
- 12.1.2.1. Company Overview
- 12.1.2.2. Products
- 12.1.2.3. Company Financials
- 12.1.2.4. SWOT Analysis
- 12.1.3 Gulf Cryo
- 12.1.3.1. Company Overview
- 12.1.3.2. Products
- 12.1.3.3. Company Financials
- 12.1.3.4. SWOT Analysis
- 12.1.4 Matheson Tri-Gas Inc
- 12.1.4.1. Company Overview
- 12.1.4.2. Products
- 12.1.4.3. Company Financials
- 12.1.4.4. SWOT Analysis
- 12.1.5 Bhuruka Gases Limited
- 12.1.5.1. Company Overview
- 12.1.5.2. Products
- 12.1.5.3. Company Financials
- 12.1.5.4. SWOT Analysis
- 12.1.6 Inox-Air Products Inc
- 12.1.6.1. Company Overview
- 12.1.6.2. Products
- 12.1.6.3. Company Financials
- 12.1.6.4. SWOT Analysis
- 12.1.7 Daesung Group
- 12.1.7.1. Company Overview
- 12.1.7.2. Products
- 12.1.7.3. Company Financials
- 12.1.7.4. SWOT Analysis
- 12.1.8 Linde plc
- 12.1.8.1. Company Overview
- 12.1.8.2. Products
- 12.1.8.3. Company Financials
- 12.1.8.4. SWOT Analysis
- 12.1.9 Nippon Gases
- 12.1.9.1. Company Overview
- 12.1.9.2. Products
- 12.1.9.3. Company Financials
- 12.1.9.4. SWOT Analysis
- 12.1.10 TAIYO NIPPON SANSO CORPORATION
- 12.1.10.1. Company Overview
- 12.1.10.2. Products
- 12.1.10.3. Company Financials
- 12.1.10.4. SWOT Analysis
- 12.1.11 Yingde Gases Group*List Not Exhaustive
- 12.1.11.1. Company Overview
- 12.1.11.2. Products
- 12.1.11.3. Company Financials
- 12.1.11.4. SWOT Analysis
- 12.1.12 KOATSU GAS KOGYO CO LTD
- 12.1.12.1. Company Overview
- 12.1.12.2. Products
- 12.1.12.3. Company Financials
- 12.1.12.4. SWOT Analysis
- 12.1.13 Air Liquide
- 12.1.13.1. Company Overview
- 12.1.13.2. Products
- 12.1.13.3. Company Financials
- 12.1.13.4. SWOT Analysis
- 12.1.14 SHOWA DENKO K K
- 12.1.14.1. Company Overview
- 12.1.14.2. Products
- 12.1.14.3. Company Financials
- 12.1.14.4. SWOT Analysis
- 12.1.15 SOL Spa
- 12.1.15.1. Company Overview
- 12.1.15.2. Products
- 12.1.15.3. Company Financials
- 12.1.15.4. SWOT Analysis
- 12.1.1 Messer North America Inc
- 12.2. Market Entropy
- 12.2.1 Company's Key Areas Served
- 12.2.2 Recent Developments
- 12.3. Company Market Share Analysis 2025
- 12.3.1 Top 5 Companies Market Share Analysis
- 12.3.2 Top 3 Companies Market Share Analysis
- 12.4. List of Potential Customers
- 13. Research Methodology
List of Figures
- Figure 1: Global Oxygen Market Revenue Breakdown (million, %) by Region 2025 & 2033
- Figure 2: Global Oxygen Market Volume Breakdown (K Tons, %) by Region 2025 & 2033
- Figure 3: Asia Pacific Oxygen Market Revenue (million), by Form 2025 & 2033
- Figure 4: Asia Pacific Oxygen Market Volume (K Tons), by Form 2025 & 2033
- Figure 5: Asia Pacific Oxygen Market Revenue Share (%), by Form 2025 & 2033
- Figure 6: Asia Pacific Oxygen Market Volume Share (%), by Form 2025 & 2033
- Figure 7: Asia Pacific Oxygen Market Revenue (million), by Type 2025 & 2033
- Figure 8: Asia Pacific Oxygen Market Volume (K Tons), by Type 2025 & 2033
- Figure 9: Asia Pacific Oxygen Market Revenue Share (%), by Type 2025 & 2033
- Figure 10: Asia Pacific Oxygen Market Volume Share (%), by Type 2025 & 2033
- Figure 11: Asia Pacific Oxygen Market Revenue (million), by Application 2025 & 2033
- Figure 12: Asia Pacific Oxygen Market Volume (K Tons), by Application 2025 & 2033
- Figure 13: Asia Pacific Oxygen Market Revenue Share (%), by Application 2025 & 2033
- Figure 14: Asia Pacific Oxygen Market Volume Share (%), by Application 2025 & 2033
- Figure 15: Asia Pacific Oxygen Market Revenue (million), by Country 2025 & 2033
- Figure 16: Asia Pacific Oxygen Market Volume (K Tons), by Country 2025 & 2033
- Figure 17: Asia Pacific Oxygen Market Revenue Share (%), by Country 2025 & 2033
- Figure 18: Asia Pacific Oxygen Market Volume Share (%), by Country 2025 & 2033
- Figure 19: North America Oxygen Market Revenue (million), by Form 2025 & 2033
- Figure 20: North America Oxygen Market Volume (K Tons), by Form 2025 & 2033
- Figure 21: North America Oxygen Market Revenue Share (%), by Form 2025 & 2033
- Figure 22: North America Oxygen Market Volume Share (%), by Form 2025 & 2033
- Figure 23: North America Oxygen Market Revenue (million), by Type 2025 & 2033
- Figure 24: North America Oxygen Market Volume (K Tons), by Type 2025 & 2033
- Figure 25: North America Oxygen Market Revenue Share (%), by Type 2025 & 2033
- Figure 26: North America Oxygen Market Volume Share (%), by Type 2025 & 2033
- Figure 27: North America Oxygen Market Revenue (million), by Application 2025 & 2033
- Figure 28: North America Oxygen Market Volume (K Tons), by Application 2025 & 2033
- Figure 29: North America Oxygen Market Revenue Share (%), by Application 2025 & 2033
- Figure 30: North America Oxygen Market Volume Share (%), by Application 2025 & 2033
- Figure 31: North America Oxygen Market Revenue (million), by Country 2025 & 2033
- Figure 32: North America Oxygen Market Volume (K Tons), by Country 2025 & 2033
- Figure 33: North America Oxygen Market Revenue Share (%), by Country 2025 & 2033
- Figure 34: North America Oxygen Market Volume Share (%), by Country 2025 & 2033
- Figure 35: Europe Oxygen Market Revenue (million), by Form 2025 & 2033
- Figure 36: Europe Oxygen Market Volume (K Tons), by Form 2025 & 2033
- Figure 37: Europe Oxygen Market Revenue Share (%), by Form 2025 & 2033
- Figure 38: Europe Oxygen Market Volume Share (%), by Form 2025 & 2033
- Figure 39: Europe Oxygen Market Revenue (million), by Type 2025 & 2033
- Figure 40: Europe Oxygen Market Volume (K Tons), by Type 2025 & 2033
- Figure 41: Europe Oxygen Market Revenue Share (%), by Type 2025 & 2033
- Figure 42: Europe Oxygen Market Volume Share (%), by Type 2025 & 2033
- Figure 43: Europe Oxygen Market Revenue (million), by Application 2025 & 2033
- Figure 44: Europe Oxygen Market Volume (K Tons), by Application 2025 & 2033
- Figure 45: Europe Oxygen Market Revenue Share (%), by Application 2025 & 2033
- Figure 46: Europe Oxygen Market Volume Share (%), by Application 2025 & 2033
- Figure 47: Europe Oxygen Market Revenue (million), by Country 2025 & 2033
- Figure 48: Europe Oxygen Market Volume (K Tons), by Country 2025 & 2033
- Figure 49: Europe Oxygen Market Revenue Share (%), by Country 2025 & 2033
- Figure 50: Europe Oxygen Market Volume Share (%), by Country 2025 & 2033
- Figure 51: South America Oxygen Market Revenue (million), by Form 2025 & 2033
- Figure 52: South America Oxygen Market Volume (K Tons), by Form 2025 & 2033
- Figure 53: South America Oxygen Market Revenue Share (%), by Form 2025 & 2033
- Figure 54: South America Oxygen Market Volume Share (%), by Form 2025 & 2033
- Figure 55: South America Oxygen Market Revenue (million), by Type 2025 & 2033
- Figure 56: South America Oxygen Market Volume (K Tons), by Type 2025 & 2033
- Figure 57: South America Oxygen Market Revenue Share (%), by Type 2025 & 2033
- Figure 58: South America Oxygen Market Volume Share (%), by Type 2025 & 2033
- Figure 59: South America Oxygen Market Revenue (million), by Application 2025 & 2033
- Figure 60: South America Oxygen Market Volume (K Tons), by Application 2025 & 2033
- Figure 61: South America Oxygen Market Revenue Share (%), by Application 2025 & 2033
- Figure 62: South America Oxygen Market Volume Share (%), by Application 2025 & 2033
- Figure 63: South America Oxygen Market Revenue (million), by Country 2025 & 2033
- Figure 64: South America Oxygen Market Volume (K Tons), by Country 2025 & 2033
- Figure 65: South America Oxygen Market Revenue Share (%), by Country 2025 & 2033
- Figure 66: South America Oxygen Market Volume Share (%), by Country 2025 & 2033
- Figure 67: Middle East and Africa Oxygen Market Revenue (million), by Form 2025 & 2033
- Figure 68: Middle East and Africa Oxygen Market Volume (K Tons), by Form 2025 & 2033
- Figure 69: Middle East and Africa Oxygen Market Revenue Share (%), by Form 2025 & 2033
- Figure 70: Middle East and Africa Oxygen Market Volume Share (%), by Form 2025 & 2033
- Figure 71: Middle East and Africa Oxygen Market Revenue (million), by Type 2025 & 2033
- Figure 72: Middle East and Africa Oxygen Market Volume (K Tons), by Type 2025 & 2033
- Figure 73: Middle East and Africa Oxygen Market Revenue Share (%), by Type 2025 & 2033
- Figure 74: Middle East and Africa Oxygen Market Volume Share (%), by Type 2025 & 2033
- Figure 75: Middle East and Africa Oxygen Market Revenue (million), by Application 2025 & 2033
- Figure 76: Middle East and Africa Oxygen Market Volume (K Tons), by Application 2025 & 2033
- Figure 77: Middle East and Africa Oxygen Market Revenue Share (%), by Application 2025 & 2033
- Figure 78: Middle East and Africa Oxygen Market Volume Share (%), by Application 2025 & 2033
- Figure 79: Middle East and Africa Oxygen Market Revenue (million), by Country 2025 & 2033
- Figure 80: Middle East and Africa Oxygen Market Volume (K Tons), by Country 2025 & 2033
- Figure 81: Middle East and Africa Oxygen Market Revenue Share (%), by Country 2025 & 2033
- Figure 82: Middle East and Africa Oxygen Market Volume Share (%), by Country 2025 & 2033
List of Tables
- Table 1: Global Oxygen Market Revenue million Forecast, by Form 2020 & 2033
- Table 2: Global Oxygen Market Volume K Tons Forecast, by Form 2020 & 2033
- Table 3: Global Oxygen Market Revenue million Forecast, by Type 2020 & 2033
- Table 4: Global Oxygen Market Volume K Tons Forecast, by Type 2020 & 2033
- Table 5: Global Oxygen Market Revenue million Forecast, by Application 2020 & 2033
- Table 6: Global Oxygen Market Volume K Tons Forecast, by Application 2020 & 2033
- Table 7: Global Oxygen Market Revenue million Forecast, by Region 2020 & 2033
- Table 8: Global Oxygen Market Volume K Tons Forecast, by Region 2020 & 2033
- Table 9: Global Oxygen Market Revenue million Forecast, by Form 2020 & 2033
- Table 10: Global Oxygen Market Volume K Tons Forecast, by Form 2020 & 2033
- Table 11: Global Oxygen Market Revenue million Forecast, by Type 2020 & 2033
- Table 12: Global Oxygen Market Volume K Tons Forecast, by Type 2020 & 2033
- Table 13: Global Oxygen Market Revenue million Forecast, by Application 2020 & 2033
- Table 14: Global Oxygen Market Volume K Tons Forecast, by Application 2020 & 2033
- Table 15: Global Oxygen Market Revenue million Forecast, by Country 2020 & 2033
- Table 16: Global Oxygen Market Volume K Tons Forecast, by Country 2020 & 2033
- Table 17: China Oxygen Market Revenue (million) Forecast, by Application 2020 & 2033
- Table 18: China Oxygen Market Volume (K Tons) Forecast, by Application 2020 & 2033
- Table 19: India Oxygen Market Revenue (million) Forecast, by Application 2020 & 2033
- Table 20: India Oxygen Market Volume (K Tons) Forecast, by Application 2020 & 2033
- Table 21: Japan Oxygen Market Revenue (million) Forecast, by Application 2020 & 2033
- Table 22: Japan Oxygen Market Volume (K Tons) Forecast, by Application 2020 & 2033
- Table 23: South Korea Oxygen Market Revenue (million) Forecast, by Application 2020 & 2033
- Table 24: South Korea Oxygen Market Volume (K Tons) Forecast, by Application 2020 & 2033
- Table 25: Malaysia Oxygen Market Revenue (million) Forecast, by Application 2020 & 2033
- Table 26: Malaysia Oxygen Market Volume (K Tons) Forecast, by Application 2020 & 2033
- Table 27: Thailand Oxygen Market Revenue (million) Forecast, by Application 2020 & 2033
- Table 28: Thailand Oxygen Market Volume (K Tons) Forecast, by Application 2020 & 2033
- Table 29: Indonesia Oxygen Market Revenue (million) Forecast, by Application 2020 & 2033
- Table 30: Indonesia Oxygen Market Volume (K Tons) Forecast, by Application 2020 & 2033
- Table 31: Vietnam Oxygen Market Revenue (million) Forecast, by Application 2020 & 2033
- Table 32: Vietnam Oxygen Market Volume (K Tons) Forecast, by Application 2020 & 2033
- Table 33: Rest of Asia Pacific Oxygen Market Revenue (million) Forecast, by Application 2020 & 2033
- Table 34: Rest of Asia Pacific Oxygen Market Volume (K Tons) Forecast, by Application 2020 & 2033
- Table 35: Global Oxygen Market Revenue million Forecast, by Form 2020 & 2033
- Table 36: Global Oxygen Market Volume K Tons Forecast, by Form 2020 & 2033
- Table 37: Global Oxygen Market Revenue million Forecast, by Type 2020 & 2033
- Table 38: Global Oxygen Market Volume K Tons Forecast, by Type 2020 & 2033
- Table 39: Global Oxygen Market Revenue million Forecast, by Application 2020 & 2033
- Table 40: Global Oxygen Market Volume K Tons Forecast, by Application 2020 & 2033
- Table 41: Global Oxygen Market Revenue million Forecast, by Country 2020 & 2033
- Table 42: Global Oxygen Market Volume K Tons Forecast, by Country 2020 & 2033
- Table 43: United States Oxygen Market Revenue (million) Forecast, by Application 2020 & 2033
- Table 44: United States Oxygen Market Volume (K Tons) Forecast, by Application 2020 & 2033
- Table 45: Canada Oxygen Market Revenue (million) Forecast, by Application 2020 & 2033
- Table 46: Canada Oxygen Market Volume (K Tons) Forecast, by Application 2020 & 2033
- Table 47: Mexico Oxygen Market Revenue (million) Forecast, by Application 2020 & 2033
- Table 48: Mexico Oxygen Market Volume (K Tons) Forecast, by Application 2020 & 2033
- Table 49: Global Oxygen Market Revenue million Forecast, by Form 2020 & 2033
- Table 50: Global Oxygen Market Volume K Tons Forecast, by Form 2020 & 2033
- Table 51: Global Oxygen Market Revenue million Forecast, by Type 2020 & 2033
- Table 52: Global Oxygen Market Volume K Tons Forecast, by Type 2020 & 2033
- Table 53: Global Oxygen Market Revenue million Forecast, by Application 2020 & 2033
- Table 54: Global Oxygen Market Volume K Tons Forecast, by Application 2020 & 2033
- Table 55: Global Oxygen Market Revenue million Forecast, by Country 2020 & 2033
- Table 56: Global Oxygen Market Volume K Tons Forecast, by Country 2020 & 2033
- Table 57: Germany Oxygen Market Revenue (million) Forecast, by Application 2020 & 2033
- Table 58: Germany Oxygen Market Volume (K Tons) Forecast, by Application 2020 & 2033
- Table 59: United Kingdom Oxygen Market Revenue (million) Forecast, by Application 2020 & 2033
- Table 60: United Kingdom Oxygen Market Volume (K Tons) Forecast, by Application 2020 & 2033
- Table 61: France Oxygen Market Revenue (million) Forecast, by Application 2020 & 2033
- Table 62: France Oxygen Market Volume (K Tons) Forecast, by Application 2020 & 2033
- Table 63: Italy Oxygen Market Revenue (million) Forecast, by Application 2020 & 2033
- Table 64: Italy Oxygen Market Volume (K Tons) Forecast, by Application 2020 & 2033
- Table 65: Spain Oxygen Market Revenue (million) Forecast, by Application 2020 & 2033
- Table 66: Spain Oxygen Market Volume (K Tons) Forecast, by Application 2020 & 2033
- Table 67: NORDIC Countries Oxygen Market Revenue (million) Forecast, by Application 2020 & 2033
- Table 68: NORDIC Countries Oxygen Market Volume (K Tons) Forecast, by Application 2020 & 2033
- Table 69: Turkey Oxygen Market Revenue (million) Forecast, by Application 2020 & 2033
- Table 70: Turkey Oxygen Market Volume (K Tons) Forecast, by Application 2020 & 2033
- Table 71: Russia Oxygen Market Revenue (million) Forecast, by Application 2020 & 2033
- Table 72: Russia Oxygen Market Volume (K Tons) Forecast, by Application 2020 & 2033
- Table 73: Rest of Europe Oxygen Market Revenue (million) Forecast, by Application 2020 & 2033
- Table 74: Rest of Europe Oxygen Market Volume (K Tons) Forecast, by Application 2020 & 2033
- Table 75: Global Oxygen Market Revenue million Forecast, by Form 2020 & 2033
- Table 76: Global Oxygen Market Volume K Tons Forecast, by Form 2020 & 2033
- Table 77: Global Oxygen Market Revenue million Forecast, by Type 2020 & 2033
- Table 78: Global Oxygen Market Volume K Tons Forecast, by Type 2020 & 2033
- Table 79: Global Oxygen Market Revenue million Forecast, by Application 2020 & 2033
- Table 80: Global Oxygen Market Volume K Tons Forecast, by Application 2020 & 2033
- Table 81: Global Oxygen Market Revenue million Forecast, by Country 2020 & 2033
- Table 82: Global Oxygen Market Volume K Tons Forecast, by Country 2020 & 2033
- Table 83: Brazil Oxygen Market Revenue (million) Forecast, by Application 2020 & 2033
- Table 84: Brazil Oxygen Market Volume (K Tons) Forecast, by Application 2020 & 2033
- Table 85: Argentina Oxygen Market Revenue (million) Forecast, by Application 2020 & 2033
- Table 86: Argentina Oxygen Market Volume (K Tons) Forecast, by Application 2020 & 2033
- Table 87: Colombia Oxygen Market Revenue (million) Forecast, by Application 2020 & 2033
- Table 88: Colombia Oxygen Market Volume (K Tons) Forecast, by Application 2020 & 2033
- Table 89: Rest of South America Oxygen Market Revenue (million) Forecast, by Application 2020 & 2033
- Table 90: Rest of South America Oxygen Market Volume (K Tons) Forecast, by Application 2020 & 2033
- Table 91: Global Oxygen Market Revenue million Forecast, by Form 2020 & 2033
- Table 92: Global Oxygen Market Volume K Tons Forecast, by Form 2020 & 2033
- Table 93: Global Oxygen Market Revenue million Forecast, by Type 2020 & 2033
- Table 94: Global Oxygen Market Volume K Tons Forecast, by Type 2020 & 2033
- Table 95: Global Oxygen Market Revenue million Forecast, by Application 2020 & 2033
- Table 96: Global Oxygen Market Volume K Tons Forecast, by Application 2020 & 2033
- Table 97: Global Oxygen Market Revenue million Forecast, by Country 2020 & 2033
- Table 98: Global Oxygen Market Volume K Tons Forecast, by Country 2020 & 2033
- Table 99: Saudi Arabia Oxygen Market Revenue (million) Forecast, by Application 2020 & 2033
- Table 100: Saudi Arabia Oxygen Market Volume (K Tons) Forecast, by Application 2020 & 2033
- Table 101: Qatar Oxygen Market Revenue (million) Forecast, by Application 2020 & 2033
- Table 102: Qatar Oxygen Market Volume (K Tons) Forecast, by Application 2020 & 2033
- Table 103: United Arab Emirates Oxygen Market Revenue (million) Forecast, by Application 2020 & 2033
- Table 104: United Arab Emirates Oxygen Market Volume (K Tons) Forecast, by Application 2020 & 2033
- Table 105: Nigeria Oxygen Market Revenue (million) Forecast, by Application 2020 & 2033
- Table 106: Nigeria Oxygen Market Volume (K Tons) Forecast, by Application 2020 & 2033
- Table 107: Egypt Oxygen Market Revenue (million) Forecast, by Application 2020 & 2033
- Table 108: Egypt Oxygen Market Volume (K Tons) Forecast, by Application 2020 & 2033
- Table 109: South Africa Oxygen Market Revenue (million) Forecast, by Application 2020 & 2033
- Table 110: South Africa Oxygen Market Volume (K Tons) Forecast, by Application 2020 & 2033
- Table 111: Rest of Middle East and Africa Oxygen Market Revenue (million) Forecast, by Application 2020 & 2033
- Table 112: Rest of Middle East and Africa Oxygen Market Volume (K Tons) Forecast, by Application 2020 & 2033
Frequently Asked Questions
1. What is the projected Compound Annual Growth Rate (CAGR) of the Oxygen Market?
The projected CAGR is approximately 4.59%.
2. Which companies are prominent players in the Oxygen Market?
Key companies in the market include Messer North America Inc, Air Products Inc, Gulf Cryo, Matheson Tri-Gas Inc, Bhuruka Gases Limited, Inox-Air Products Inc, Daesung Group, Linde plc, Nippon Gases, TAIYO NIPPON SANSO CORPORATION, Yingde Gases Group*List Not Exhaustive, KOATSU GAS KOGYO CO LTD, Air Liquide, SHOWA DENKO K K, SOL Spa.
3. What are the main segments of the Oxygen Market?
The market segments include Form, Type, Application.
4. Can you provide details about the market size?
The market size is estimated to be USD 87.93 million as of 2022.
5. What are some drivers contributing to market growth?
Increasing Demand From the Medical and Healthcare Industry; Growing Demand for Oxygen from the Metals and Mining Industry.
6. What are the notable trends driving market growth?
Increasing Demand From Healthcare Industry.
7. Are there any restraints impacting market growth?
High Costs for Manufacturing Oxygen; Alternative Fuel Gases Used for Welding and Cutting Applications.
8. Can you provide examples of recent developments in the market?
In July 2021, Linde announced that it had started its new on-site facility in Qinzhou, China. The facility can supply up to 7,500 tons of oxygen per day.
9. What pricing options are available for accessing the report?
Pricing options include single-user, multi-user, and enterprise licenses priced at USD 4750, USD 5250, and USD 8750 respectively.
10. Is the market size provided in terms of value or volume?
The market size is provided in terms of value, measured in million and volume, measured in K Tons.
11. Are there any specific market keywords associated with the report?
Yes, the market keyword associated with the report is "Oxygen Market," which aids in identifying and referencing the specific market segment covered.
12. How do I determine which pricing option suits my needs best?
The pricing options vary based on user requirements and access needs. Individual users may opt for single-user licenses, while businesses requiring broader access may choose multi-user or enterprise licenses for cost-effective access to the report.
13. Are there any additional resources or data provided in the Oxygen Market report?
While the report offers comprehensive insights, it's advisable to review the specific contents or supplementary materials provided to ascertain if additional resources or data are available.
14. How can I stay updated on further developments or reports in the Oxygen Market?
To stay informed about further developments, trends, and reports in the Oxygen Market, consider subscribing to industry newsletters, following relevant companies and organizations, or regularly checking reputable industry news sources and publications.
Methodology
Step 1 - Identification of Relevant Samples Size from Population Database


Step 2 - Approaches for Defining Global Market Size (Value, Volume* & Price*)

Note*: In applicable scenarios
Step 3 - Data Sources
Primary Research
- Web Analytics
- Survey Reports
- Research Institute
- Latest Research Reports
- Opinion Leaders
Secondary Research
- Annual Reports
- White Paper
- Latest Press Release
- Industry Association
- Paid Database
- Investor Presentations

Step 4 - Data Triangulation
Involves using different sources of information in order to increase the validity of a study
These sources are likely to be stakeholders in a program - participants, other researchers, program staff, other community members, and so on.
Then we put all data in single framework & apply various statistical tools to find out the dynamic on the market.
During the analysis stage, feedback from the stakeholder groups would be compared to determine areas of agreement as well as areas of divergence