


Key Insights
The global Outdoor Power Supply market is projected to experience robust expansion, reaching an estimated USD 38.83 billion by 2025, with a Compound Annual Growth Rate (CAGR) of 5.33% from a base year of 2025. This growth is propelled by increasing participation in outdoor recreational activities and a rising need for portable, dependable power solutions for remote work and emergency preparedness. Demand for higher capacity units, particularly those exceeding 1000Wh, is escalating as consumers require extended power for devices during outdoor excursions. Advancements in battery technology, delivering lighter, more efficient, and faster-charging power stations, are also enhancing product accessibility and appeal.
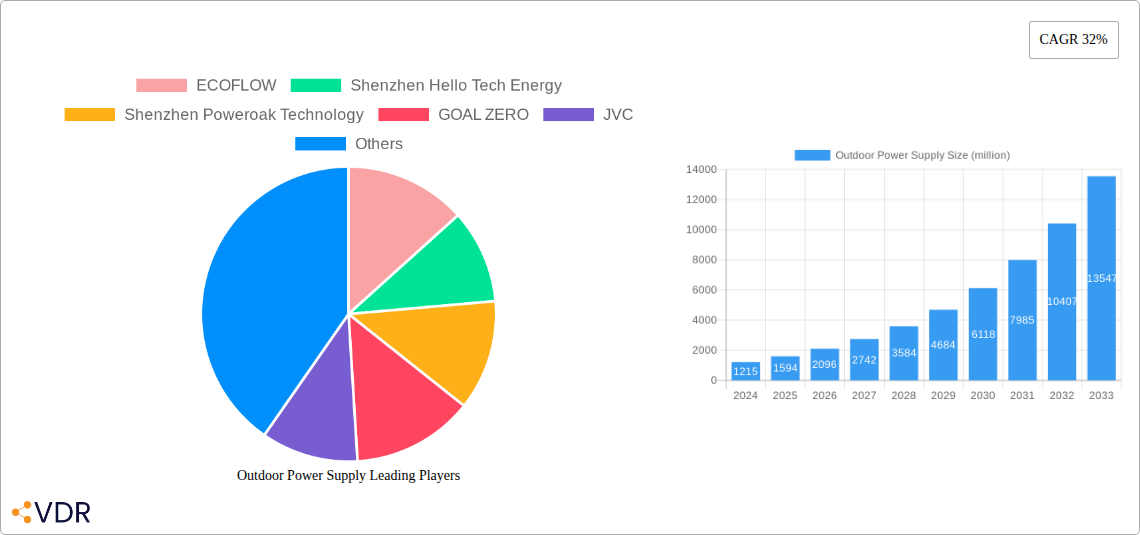
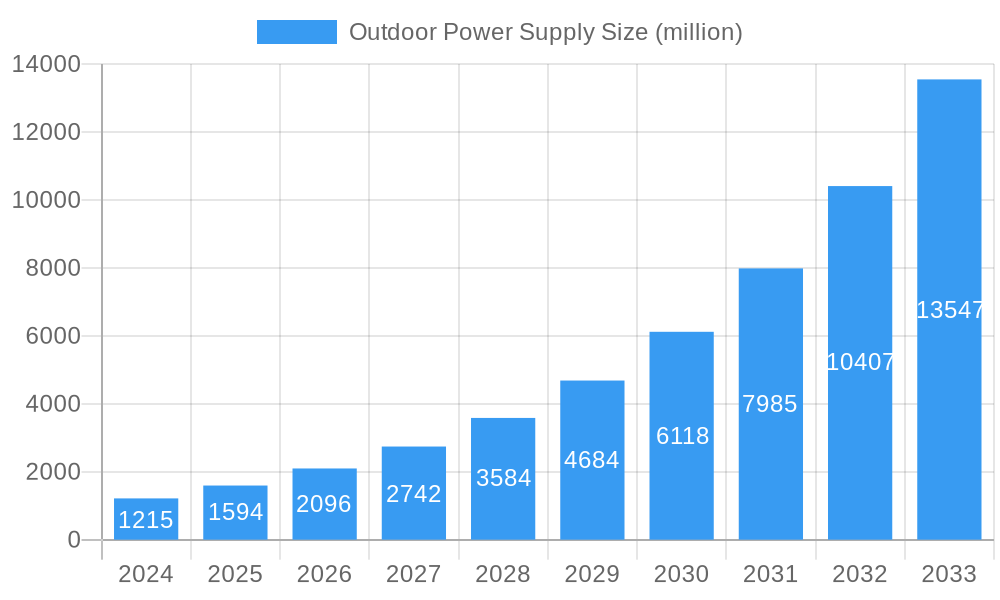
Outdoor Power Supply Market Size (In Billion)

Key market drivers include the growing adoption of portable solar power solutions for sustainable, off-grid charging. E-commerce expansion further facilitates wider distribution and consumer access. Potential restraints, such as the initial cost of high-capacity units and the need for enhanced consumer education on product benefits and safe usage, are anticipated to be mitigated by economies of scale, ongoing innovation, and a growing consumer appreciation for self-sufficiency and connectivity. Leading companies like ECOFLOW, Shenzhen Hello Tech Energy, and GOAL ZERO are actively innovating and expanding their product offerings to meet the evolving demands of outdoor enthusiasts and emergency-prepared consumers.
Outdoor Power Supply Company Market Share
Outdoor Power Supply Market Report: Unleashing Portable Energy Solutions (2019-2033)
This comprehensive report delves into the dynamic global Outdoor Power Supply market, analyzing its structure, growth trajectory, and future potential. Covering the period from 2019 to 2033, with a base and estimated year of 2025, this research provides in-depth insights for industry stakeholders. We examine key market segments, dominant regions, technological innovations, and the competitive landscape, offering a strategic roadmap for businesses navigating this rapidly evolving sector.
Outdoor Power Supply Market Dynamics & Structure
The outdoor power supply market is characterized by a moderately concentrated structure, with key players like ECOFLOW, Shenzhen Hello Tech Energy, Shenzhen Poweroak Technology, GOAL ZERO, and ANKER holding significant market shares. Technological innovation is a primary driver, fueled by advancements in battery technology (lithium-ion, LiFePO4), solar charging efficiency, and smart power management systems. Regulatory frameworks are becoming more stringent regarding product safety, battery disposal, and energy efficiency, influencing product design and market entry. Competitive product substitutes, such as traditional generators and the increasing availability of car power inverters, pose a challenge but are largely differentiated by portability and eco-friendliness. End-user demographics are broadening, encompassing outdoor enthusiasts, remote workers, emergency preparedness individuals, and off-grid living communities. Mergers and acquisitions (M&A) are on the rise as larger players seek to consolidate market presence and acquire innovative technologies.
- Market Concentration: Dominated by a few key players, with an estimated combined market share of 65% by leading companies.
- Technological Innovation Drivers: Advancements in battery density, faster charging capabilities, and integrated smart features are critical.
- Regulatory Frameworks: Growing emphasis on safety certifications (e.g., UL, CE) and environmental sustainability standards.
- Competitive Product Substitutes: Traditional generators, while powerful, lack portability and are noisy; car power inverters have limited capacity.
- End-User Demographics: Expansion beyond traditional camping to include disaster relief, professional photography, and remote construction sites.
- M&A Trends: Acquisitions focused on securing intellectual property and expanding product portfolios, with an estimated 5-7 significant deals anticipated between 2023-2027.
Outdoor Power Supply Growth Trends & Insights
The global outdoor power supply market is poised for substantial expansion, driven by increasing consumer demand for portable and sustainable energy solutions. The market size is projected to grow from an estimated $8,500 million units in 2025 to over $20,000 million units by 2033, exhibiting a robust Compound Annual Growth Rate (CAGR) of approximately 10.5% during the forecast period. This growth is underpinned by a significant rise in adoption rates among a diverse consumer base, from casual campers to professionals requiring off-grid power. Technological disruptions, such as the development of more efficient solar panel integration and faster charging technologies, are actively shaping consumer preferences and product development. Shifts in consumer behavior, including a growing preference for eco-friendly alternatives and a desire for greater energy independence, are also key accelerators. The market penetration of these devices is expected to double within the next decade, moving from roughly 15% in 2024 to over 30% by 2033 in developed economies.
The increasing prevalence of outdoor recreational activities, coupled with a growing awareness of environmental sustainability, are fundamental pillars supporting the market's upward trajectory. The convenience and versatility offered by outdoor power supplies, enabling users to power electronics, appliances, and even small tools in remote locations, are major adoption drivers. Furthermore, the rising frequency of natural disasters and power outages has spurred a demand for reliable backup power solutions, positioning outdoor power supplies as a crucial component of emergency preparedness. The development of lighter, more compact, and higher-capacity units is continuously expanding the potential applications and appeal of these devices.
Technological advancements are not only improving the performance of outdoor power supplies but also making them more accessible and user-friendly. Innovations in battery management systems (BMS) ensure optimal charging and discharging, extending battery lifespan and enhancing safety. The integration of smart features, such as app connectivity for monitoring power levels and controlling settings remotely, caters to the evolving expectations of tech-savvy consumers. Moreover, the declining costs of solar panels and advancements in their efficiency are making solar charging a more viable and attractive option for users seeking to minimize their reliance on grid power and reduce their environmental footprint.
Consumer behavior is also undergoing a significant transformation. There's a discernible shift towards experiences over material possessions, driving increased participation in outdoor activities like camping, hiking, and van life. This trend directly translates into a higher demand for portable power solutions to support these lifestyles. Additionally, the growing concern for climate change and the desire to reduce carbon emissions are prompting consumers to opt for renewable energy sources and portable power stations over traditional, fossil-fuel-powered generators. The "work from anywhere" trend, amplified by recent global events, has also created a niche market for robust, portable power solutions that enable productivity in diverse outdoor settings.
The market is witnessing a growing segment of users seeking to power not just small electronics but also larger appliances, leading to a demand for higher capacity units. This is pushing manufacturers to innovate in terms of battery technology and power output. The expansion of the gig economy and the rise of mobile businesses also contribute to the demand for reliable portable power. Ultimately, the convergence of lifestyle trends, technological advancements, and an increasing focus on sustainability is creating a fertile ground for sustained growth in the outdoor power supply market.
Dominant Regions, Countries, or Segments in Outdoor Power Supply
The North America region stands as a dominant force in the global outdoor power supply market, driven by a confluence of strong consumer demand, robust economic conditions, and a deeply ingrained culture of outdoor recreation. This dominance is further amplified by the presence of key market players and a well-developed retail infrastructure, facilitating both online and offline sales channels. Within North America, the United States leads in market share and growth potential, fueled by its vast geographical diversity, extensive national parks, and a large population actively engaged in camping, RVing, and other outdoor pursuits. The increasing adoption of off-grid living solutions and a heightened awareness of emergency preparedness also contribute significantly to market penetration.
The Online Sales segment within the application category is particularly strong in North America, reflecting the purchasing habits of its digitally native consumer base. E-commerce platforms offer a wide selection of products and competitive pricing, making it the preferred channel for many consumers seeking outdoor power solutions. However, Offline Sales through outdoor recreation retailers, electronics stores, and specialized power equipment outlets remain crucial, providing consumers with the opportunity to physically inspect products and receive expert advice.
Geographically, the market’s strength in North America is mirrored in its preference for specific product types. The 500 to 1000wh capacity range is experiencing significant traction. This segment offers a compelling balance of portability and power, capable of running essential appliances like portable refrigerators, laptops, and multiple smaller electronic devices, catering effectively to the needs of weekend campers, RV owners, and individuals seeking reliable backup power. The Above 1000wh segment is also showing considerable growth, driven by users requiring power for more demanding applications, such as powering small A/V equipment on location, running larger appliances in off-grid cabins, or extended emergency power needs.
Key drivers underpinning North America's dominance include supportive government policies that promote renewable energy adoption, albeit indirectly, by fostering a market for off-grid solutions. The economic stability of the region allows for higher disposable incomes, enabling consumers to invest in premium outdoor power products. Furthermore, the extensive infrastructure for outdoor activities, including campgrounds and national parks, ensures continuous demand. The active promotion and innovation by companies like GOAL ZERO, ECOFLOW, and Westinghouse, who have a strong presence and loyal customer base in the region, further solidify its leading position. The increasing adoption of portable power stations for residential backup during power outages, a recurring issue in certain parts of the U.S., also contributes to market expansion. The synergy between technological advancements and consumer lifestyle trends in North America positions it as the epicenter of the outdoor power supply market.
Outdoor Power Supply Product Landscape
The outdoor power supply product landscape is characterized by continuous innovation focused on enhancing portability, efficiency, and versatility. Modern outdoor power stations, such as those from ECOFLOW, Shenzhen Poweroak Technology, and ANKER, feature high-density lithium-ion or LiFePO4 batteries, offering capacities ranging from under 300wh to over 2000wh. Key advancements include rapid charging technologies, with some units capable of reaching 80% charge in under an hour via AC power, and efficient solar input capabilities, often supporting up to 500W of solar charging. Unique selling propositions include integrated pure sine wave inverters for safe powering of sensitive electronics, multiple output ports (AC, USB-A, USB-C PD, car outlets), and robust, weather-resistant designs. PISEN and YOOBaa are also making strides in offering durable and reliable solutions for diverse outdoor needs.
Key Drivers, Barriers & Challenges in Outdoor Power Supply
Key Drivers: The outdoor power supply market is propelled by a burgeoning demand for off-grid energy solutions, driven by the increasing popularity of outdoor recreational activities like camping, hiking, and van life. Technological advancements in battery technology, leading to lighter, more powerful, and faster-charging units, are significant accelerators. Growing environmental consciousness and a desire for sustainable energy sources also play a crucial role, with consumers opting for solar-rechargeable power stations over fossil-fuel generators. Furthermore, the rise in remote work and the need for reliable power on the go have expanded the user base.
Key Barriers & Challenges: Despite robust growth, the market faces several challenges. The relatively high initial cost of advanced outdoor power supplies can be a barrier to entry for some consumers. Supply chain disruptions and the fluctuating costs of raw materials, particularly lithium, can impact pricing and availability. Regulatory hurdles related to battery safety, transportation, and disposal are also evolving and require ongoing compliance efforts. Intense competition among a growing number of manufacturers, including newcomers like Flashfish and Pecron, puts pressure on profit margins and necessitates continuous product differentiation and marketing investment. Poweroak Technology and GOAL ZERO are constantly innovating to overcome these.
Emerging Opportunities in Outdoor Power Supply
Emerging opportunities in the outdoor power supply sector lie in the development of more integrated and eco-friendly solutions. The expansion of smart home ecosystems to outdoor applications, allowing for seamless power management and integration with other portable devices, presents a significant avenue. Innovations in battery technology, such as solid-state batteries, promise further improvements in energy density, safety, and lifespan, creating opportunities for next-generation products. The growing demand for silent, emission-free power sources in noise-sensitive environments, like national parks and campgrounds, also presents a lucrative niche. Furthermore, the increasing use of outdoor power supplies in professional settings, such as mobile film crews and remote scientific research, opens up avenues for specialized, ruggedized, and high-capacity models. Letsolar and Allpowers are exploring these niches.
Growth Accelerators in the Outdoor Power Supply Industry
Several catalysts are accelerating the growth of the outdoor power supply industry. Technological breakthroughs in battery chemistry and power electronics are continually enhancing product performance, making them more efficient and user-friendly. Strategic partnerships between power station manufacturers and solar panel producers are creating integrated, all-in-one solutions that appeal to environmentally conscious consumers. Market expansion strategies, including the penetration into emerging economies and the development of specialized product lines for specific industries (e.g., emergency services, construction), are driving broader adoption. The increasing focus on product durability and longevity, coupled with accessible repair services, builds consumer trust and encourages repeat purchases, fostering sustained market momentum.
Key Players Shaping the Outdoor Power Supply Market
- ECOFLOW
- Shenzhen Hello Tech Energy
- Shenzhen Poweroak Technology
- GOAL ZERO
- JVC
- Allpowers
- Westinghouse
- DBK
- PISEN
- ANKER
- Sbase
- Letsolar
- Yoobao
- Newsmy
- Orico
- Flashfish
- Pecron
Notable Milestones in Outdoor Power Supply Sector
- 2019: Introduction of high-capacity portable power stations with integrated pure sine wave inverters, enabling the powering of sensitive electronics.
- 2020: Significant advancements in solar charging efficiency, allowing for faster recharging in off-grid scenarios.
- 2021: Rise of LiFePO4 battery technology in consumer-grade outdoor power stations, offering increased lifespan and safety.
- 2022: Increased integration of smart features and app connectivity for remote monitoring and control of power station functions.
- 2023: Introduction of modular and expandable power station systems, allowing users to customize capacity based on their needs.
- 2024: Growing emphasis on eco-friendly materials and sustainable manufacturing processes in product development.
In-Depth Outdoor Power Supply Market Outlook
The outdoor power supply market is set for a future characterized by sustained innovation and expanded applications. Growth accelerators such as breakthroughs in battery technology, leading to lighter and more powerful units, will continue to drive market expansion. Strategic partnerships between manufacturers and renewable energy providers will foster the development of more integrated and efficient solar charging solutions. The increasing consumer demand for energy independence and preparedness, coupled with the growth of outdoor lifestyles, will ensure a robust and growing customer base. Future market potential lies in tapping into niche industrial applications and developing ultra-portable, high-performance devices for professional use, while also making these essential power solutions more accessible to a wider demographic.
Outdoor Power Supply Segmentation
-
1. Application
- 1.1. Online Sales
- 1.2. Offline Sales
-
2. Types
- 2.1. Below 500wh
- 2.2. 500 to 1000wh
- 2.3. Above 1000wh
Outdoor Power Supply Segmentation By Geography
-
1. North America
- 1.1. United States
- 1.2. Canada
- 1.3. Mexico
-
2. South America
- 2.1. Brazil
- 2.2. Argentina
- 2.3. Rest of South America
-
3. Europe
- 3.1. United Kingdom
- 3.2. Germany
- 3.3. France
- 3.4. Italy
- 3.5. Spain
- 3.6. Russia
- 3.7. Benelux
- 3.8. Nordics
- 3.9. Rest of Europe
-
4. Middle East & Africa
- 4.1. Turkey
- 4.2. Israel
- 4.3. GCC
- 4.4. North Africa
- 4.5. South Africa
- 4.6. Rest of Middle East & Africa
-
5. Asia Pacific
- 5.1. China
- 5.2. India
- 5.3. Japan
- 5.4. South Korea
- 5.5. ASEAN
- 5.6. Oceania
- 5.7. Rest of Asia Pacific
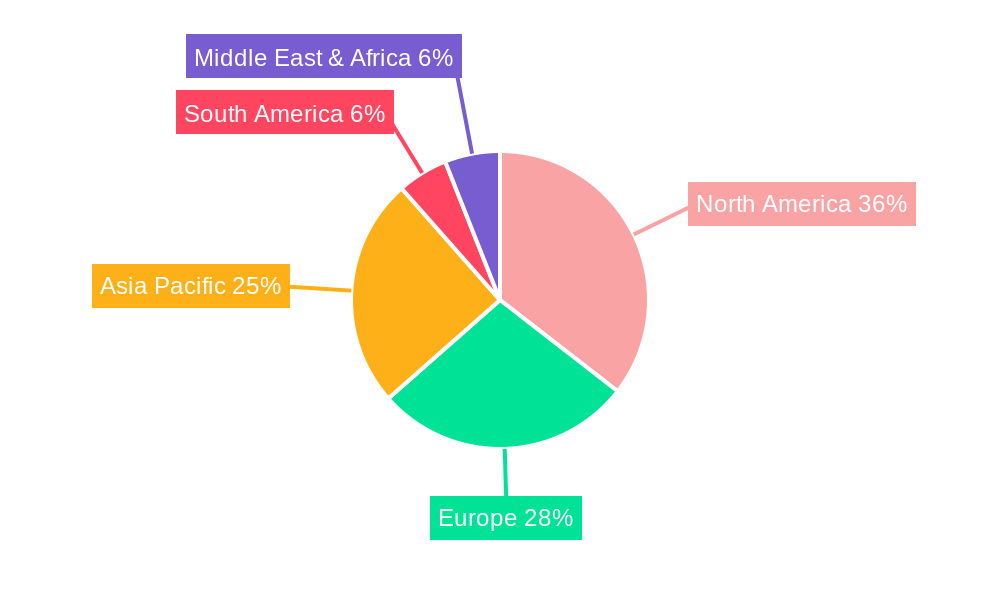
Outdoor Power Supply Regional Market Share
Geographic Coverage of Outdoor Power Supply
Outdoor Power Supply REPORT HIGHLIGHTS
| Aspects | Details |
|---|---|
| Study Period | 2020-2034 |
| Base Year | 2025 |
| Estimated Year | 2026 |
| Forecast Period | 2026-2034 |
| Historical Period | 2020-2025 |
| Growth Rate | CAGR of 5.33% from 2020-2034 |
| Segmentation |
|
Table of Contents
- 1. Introduction
- 1.1. Research Scope
- 1.2. Market Segmentation
- 1.3. Research Methodology
- 1.4. Definitions and Assumptions
- 2. Executive Summary
- 2.1. Introduction
- 3. Market Dynamics
- 3.1. Introduction
- 3.2. Market Drivers
- 3.3. Market Restrains
- 3.4. Market Trends
- 4. Market Factor Analysis
- 4.1. Porters Five Forces
- 4.2. Supply/Value Chain
- 4.3. PESTEL analysis
- 4.4. Market Entropy
- 4.5. Patent/Trademark Analysis
- 5. Global Outdoor Power Supply Analysis, Insights and Forecast, 2020-2032
- 5.1. Market Analysis, Insights and Forecast - by Application
- 5.1.1. Online Sales
- 5.1.2. Offline Sales
- 5.2. Market Analysis, Insights and Forecast - by Types
- 5.2.1. Below 500wh
- 5.2.2. 500 to 1000wh
- 5.2.3. Above 1000wh
- 5.3. Market Analysis, Insights and Forecast - by Region
- 5.3.1. North America
- 5.3.2. South America
- 5.3.3. Europe
- 5.3.4. Middle East & Africa
- 5.3.5. Asia Pacific
- 5.1. Market Analysis, Insights and Forecast - by Application
- 6. North America Outdoor Power Supply Analysis, Insights and Forecast, 2020-2032
- 6.1. Market Analysis, Insights and Forecast - by Application
- 6.1.1. Online Sales
- 6.1.2. Offline Sales
- 6.2. Market Analysis, Insights and Forecast - by Types
- 6.2.1. Below 500wh
- 6.2.2. 500 to 1000wh
- 6.2.3. Above 1000wh
- 6.1. Market Analysis, Insights and Forecast - by Application
- 7. South America Outdoor Power Supply Analysis, Insights and Forecast, 2020-2032
- 7.1. Market Analysis, Insights and Forecast - by Application
- 7.1.1. Online Sales
- 7.1.2. Offline Sales
- 7.2. Market Analysis, Insights and Forecast - by Types
- 7.2.1. Below 500wh
- 7.2.2. 500 to 1000wh
- 7.2.3. Above 1000wh
- 7.1. Market Analysis, Insights and Forecast - by Application
- 8. Europe Outdoor Power Supply Analysis, Insights and Forecast, 2020-2032
- 8.1. Market Analysis, Insights and Forecast - by Application
- 8.1.1. Online Sales
- 8.1.2. Offline Sales
- 8.2. Market Analysis, Insights and Forecast - by Types
- 8.2.1. Below 500wh
- 8.2.2. 500 to 1000wh
- 8.2.3. Above 1000wh
- 8.1. Market Analysis, Insights and Forecast - by Application
- 9. Middle East & Africa Outdoor Power Supply Analysis, Insights and Forecast, 2020-2032
- 9.1. Market Analysis, Insights and Forecast - by Application
- 9.1.1. Online Sales
- 9.1.2. Offline Sales
- 9.2. Market Analysis, Insights and Forecast - by Types
- 9.2.1. Below 500wh
- 9.2.2. 500 to 1000wh
- 9.2.3. Above 1000wh
- 9.1. Market Analysis, Insights and Forecast - by Application
- 10. Asia Pacific Outdoor Power Supply Analysis, Insights and Forecast, 2020-2032
- 10.1. Market Analysis, Insights and Forecast - by Application
- 10.1.1. Online Sales
- 10.1.2. Offline Sales
- 10.2. Market Analysis, Insights and Forecast - by Types
- 10.2.1. Below 500wh
- 10.2.2. 500 to 1000wh
- 10.2.3. Above 1000wh
- 10.1. Market Analysis, Insights and Forecast - by Application
- 11. Competitive Analysis
- 11.1. Global Market Share Analysis 2025
- 11.2. Company Profiles
- 11.2.1 ECOFLOW
- 11.2.1.1. Overview
- 11.2.1.2. Products
- 11.2.1.3. SWOT Analysis
- 11.2.1.4. Recent Developments
- 11.2.1.5. Financials (Based on Availability)
- 11.2.2 Shenzhen Hello Tech Energy
- 11.2.2.1. Overview
- 11.2.2.2. Products
- 11.2.2.3. SWOT Analysis
- 11.2.2.4. Recent Developments
- 11.2.2.5. Financials (Based on Availability)
- 11.2.3 Shenzhen Poweroak Technology
- 11.2.3.1. Overview
- 11.2.3.2. Products
- 11.2.3.3. SWOT Analysis
- 11.2.3.4. Recent Developments
- 11.2.3.5. Financials (Based on Availability)
- 11.2.4 GOAL ZERO
- 11.2.4.1. Overview
- 11.2.4.2. Products
- 11.2.4.3. SWOT Analysis
- 11.2.4.4. Recent Developments
- 11.2.4.5. Financials (Based on Availability)
- 11.2.5 JVC
- 11.2.5.1. Overview
- 11.2.5.2. Products
- 11.2.5.3. SWOT Analysis
- 11.2.5.4. Recent Developments
- 11.2.5.5. Financials (Based on Availability)
- 11.2.6 Allpowers
- 11.2.6.1. Overview
- 11.2.6.2. Products
- 11.2.6.3. SWOT Analysis
- 11.2.6.4. Recent Developments
- 11.2.6.5. Financials (Based on Availability)
- 11.2.7 Westinghouse
- 11.2.7.1. Overview
- 11.2.7.2. Products
- 11.2.7.3. SWOT Analysis
- 11.2.7.4. Recent Developments
- 11.2.7.5. Financials (Based on Availability)
- 11.2.8 DBK
- 11.2.8.1. Overview
- 11.2.8.2. Products
- 11.2.8.3. SWOT Analysis
- 11.2.8.4. Recent Developments
- 11.2.8.5. Financials (Based on Availability)
- 11.2.9 PISEN
- 11.2.9.1. Overview
- 11.2.9.2. Products
- 11.2.9.3. SWOT Analysis
- 11.2.9.4. Recent Developments
- 11.2.9.5. Financials (Based on Availability)
- 11.2.10 ANKER
- 11.2.10.1. Overview
- 11.2.10.2. Products
- 11.2.10.3. SWOT Analysis
- 11.2.10.4. Recent Developments
- 11.2.10.5. Financials (Based on Availability)
- 11.2.11 Sbase
- 11.2.11.1. Overview
- 11.2.11.2. Products
- 11.2.11.3. SWOT Analysis
- 11.2.11.4. Recent Developments
- 11.2.11.5. Financials (Based on Availability)
- 11.2.12 Letsolar
- 11.2.12.1. Overview
- 11.2.12.2. Products
- 11.2.12.3. SWOT Analysis
- 11.2.12.4. Recent Developments
- 11.2.12.5. Financials (Based on Availability)
- 11.2.13 Yoobao
- 11.2.13.1. Overview
- 11.2.13.2. Products
- 11.2.13.3. SWOT Analysis
- 11.2.13.4. Recent Developments
- 11.2.13.5. Financials (Based on Availability)
- 11.2.14 Newsmy
- 11.2.14.1. Overview
- 11.2.14.2. Products
- 11.2.14.3. SWOT Analysis
- 11.2.14.4. Recent Developments
- 11.2.14.5. Financials (Based on Availability)
- 11.2.15 Orico
- 11.2.15.1. Overview
- 11.2.15.2. Products
- 11.2.15.3. SWOT Analysis
- 11.2.15.4. Recent Developments
- 11.2.15.5. Financials (Based on Availability)
- 11.2.16 Flashfish
- 11.2.16.1. Overview
- 11.2.16.2. Products
- 11.2.16.3. SWOT Analysis
- 11.2.16.4. Recent Developments
- 11.2.16.5. Financials (Based on Availability)
- 11.2.17 Pecron
- 11.2.17.1. Overview
- 11.2.17.2. Products
- 11.2.17.3. SWOT Analysis
- 11.2.17.4. Recent Developments
- 11.2.17.5. Financials (Based on Availability)
- 11.2.1 ECOFLOW
List of Figures
- Figure 1: Global Outdoor Power Supply Revenue Breakdown (billion, %) by Region 2025 & 2033
- Figure 2: Global Outdoor Power Supply Volume Breakdown (K, %) by Region 2025 & 2033
- Figure 3: North America Outdoor Power Supply Revenue (billion), by Application 2025 & 2033
- Figure 4: North America Outdoor Power Supply Volume (K), by Application 2025 & 2033
- Figure 5: North America Outdoor Power Supply Revenue Share (%), by Application 2025 & 2033
- Figure 6: North America Outdoor Power Supply Volume Share (%), by Application 2025 & 2033
- Figure 7: North America Outdoor Power Supply Revenue (billion), by Types 2025 & 2033
- Figure 8: North America Outdoor Power Supply Volume (K), by Types 2025 & 2033
- Figure 9: North America Outdoor Power Supply Revenue Share (%), by Types 2025 & 2033
- Figure 10: North America Outdoor Power Supply Volume Share (%), by Types 2025 & 2033
- Figure 11: North America Outdoor Power Supply Revenue (billion), by Country 2025 & 2033
- Figure 12: North America Outdoor Power Supply Volume (K), by Country 2025 & 2033
- Figure 13: North America Outdoor Power Supply Revenue Share (%), by Country 2025 & 2033
- Figure 14: North America Outdoor Power Supply Volume Share (%), by Country 2025 & 2033
- Figure 15: South America Outdoor Power Supply Revenue (billion), by Application 2025 & 2033
- Figure 16: South America Outdoor Power Supply Volume (K), by Application 2025 & 2033
- Figure 17: South America Outdoor Power Supply Revenue Share (%), by Application 2025 & 2033
- Figure 18: South America Outdoor Power Supply Volume Share (%), by Application 2025 & 2033
- Figure 19: South America Outdoor Power Supply Revenue (billion), by Types 2025 & 2033
- Figure 20: South America Outdoor Power Supply Volume (K), by Types 2025 & 2033
- Figure 21: South America Outdoor Power Supply Revenue Share (%), by Types 2025 & 2033
- Figure 22: South America Outdoor Power Supply Volume Share (%), by Types 2025 & 2033
- Figure 23: South America Outdoor Power Supply Revenue (billion), by Country 2025 & 2033
- Figure 24: South America Outdoor Power Supply Volume (K), by Country 2025 & 2033
- Figure 25: South America Outdoor Power Supply Revenue Share (%), by Country 2025 & 2033
- Figure 26: South America Outdoor Power Supply Volume Share (%), by Country 2025 & 2033
- Figure 27: Europe Outdoor Power Supply Revenue (billion), by Application 2025 & 2033
- Figure 28: Europe Outdoor Power Supply Volume (K), by Application 2025 & 2033
- Figure 29: Europe Outdoor Power Supply Revenue Share (%), by Application 2025 & 2033
- Figure 30: Europe Outdoor Power Supply Volume Share (%), by Application 2025 & 2033
- Figure 31: Europe Outdoor Power Supply Revenue (billion), by Types 2025 & 2033
- Figure 32: Europe Outdoor Power Supply Volume (K), by Types 2025 & 2033
- Figure 33: Europe Outdoor Power Supply Revenue Share (%), by Types 2025 & 2033
- Figure 34: Europe Outdoor Power Supply Volume Share (%), by Types 2025 & 2033
- Figure 35: Europe Outdoor Power Supply Revenue (billion), by Country 2025 & 2033
- Figure 36: Europe Outdoor Power Supply Volume (K), by Country 2025 & 2033
- Figure 37: Europe Outdoor Power Supply Revenue Share (%), by Country 2025 & 2033
- Figure 38: Europe Outdoor Power Supply Volume Share (%), by Country 2025 & 2033
- Figure 39: Middle East & Africa Outdoor Power Supply Revenue (billion), by Application 2025 & 2033
- Figure 40: Middle East & Africa Outdoor Power Supply Volume (K), by Application 2025 & 2033
- Figure 41: Middle East & Africa Outdoor Power Supply Revenue Share (%), by Application 2025 & 2033
- Figure 42: Middle East & Africa Outdoor Power Supply Volume Share (%), by Application 2025 & 2033
- Figure 43: Middle East & Africa Outdoor Power Supply Revenue (billion), by Types 2025 & 2033
- Figure 44: Middle East & Africa Outdoor Power Supply Volume (K), by Types 2025 & 2033
- Figure 45: Middle East & Africa Outdoor Power Supply Revenue Share (%), by Types 2025 & 2033
- Figure 46: Middle East & Africa Outdoor Power Supply Volume Share (%), by Types 2025 & 2033
- Figure 47: Middle East & Africa Outdoor Power Supply Revenue (billion), by Country 2025 & 2033
- Figure 48: Middle East & Africa Outdoor Power Supply Volume (K), by Country 2025 & 2033
- Figure 49: Middle East & Africa Outdoor Power Supply Revenue Share (%), by Country 2025 & 2033
- Figure 50: Middle East & Africa Outdoor Power Supply Volume Share (%), by Country 2025 & 2033
- Figure 51: Asia Pacific Outdoor Power Supply Revenue (billion), by Application 2025 & 2033
- Figure 52: Asia Pacific Outdoor Power Supply Volume (K), by Application 2025 & 2033
- Figure 53: Asia Pacific Outdoor Power Supply Revenue Share (%), by Application 2025 & 2033
- Figure 54: Asia Pacific Outdoor Power Supply Volume Share (%), by Application 2025 & 2033
- Figure 55: Asia Pacific Outdoor Power Supply Revenue (billion), by Types 2025 & 2033
- Figure 56: Asia Pacific Outdoor Power Supply Volume (K), by Types 2025 & 2033
- Figure 57: Asia Pacific Outdoor Power Supply Revenue Share (%), by Types 2025 & 2033
- Figure 58: Asia Pacific Outdoor Power Supply Volume Share (%), by Types 2025 & 2033
- Figure 59: Asia Pacific Outdoor Power Supply Revenue (billion), by Country 2025 & 2033
- Figure 60: Asia Pacific Outdoor Power Supply Volume (K), by Country 2025 & 2033
- Figure 61: Asia Pacific Outdoor Power Supply Revenue Share (%), by Country 2025 & 2033
- Figure 62: Asia Pacific Outdoor Power Supply Volume Share (%), by Country 2025 & 2033
List of Tables
- Table 1: Global Outdoor Power Supply Revenue billion Forecast, by Application 2020 & 2033
- Table 2: Global Outdoor Power Supply Volume K Forecast, by Application 2020 & 2033
- Table 3: Global Outdoor Power Supply Revenue billion Forecast, by Types 2020 & 2033
- Table 4: Global Outdoor Power Supply Volume K Forecast, by Types 2020 & 2033
- Table 5: Global Outdoor Power Supply Revenue billion Forecast, by Region 2020 & 2033
- Table 6: Global Outdoor Power Supply Volume K Forecast, by Region 2020 & 2033
- Table 7: Global Outdoor Power Supply Revenue billion Forecast, by Application 2020 & 2033
- Table 8: Global Outdoor Power Supply Volume K Forecast, by Application 2020 & 2033
- Table 9: Global Outdoor Power Supply Revenue billion Forecast, by Types 2020 & 2033
- Table 10: Global Outdoor Power Supply Volume K Forecast, by Types 2020 & 2033
- Table 11: Global Outdoor Power Supply Revenue billion Forecast, by Country 2020 & 2033
- Table 12: Global Outdoor Power Supply Volume K Forecast, by Country 2020 & 2033
- Table 13: United States Outdoor Power Supply Revenue (billion) Forecast, by Application 2020 & 2033
- Table 14: United States Outdoor Power Supply Volume (K) Forecast, by Application 2020 & 2033
- Table 15: Canada Outdoor Power Supply Revenue (billion) Forecast, by Application 2020 & 2033
- Table 16: Canada Outdoor Power Supply Volume (K) Forecast, by Application 2020 & 2033
- Table 17: Mexico Outdoor Power Supply Revenue (billion) Forecast, by Application 2020 & 2033
- Table 18: Mexico Outdoor Power Supply Volume (K) Forecast, by Application 2020 & 2033
- Table 19: Global Outdoor Power Supply Revenue billion Forecast, by Application 2020 & 2033
- Table 20: Global Outdoor Power Supply Volume K Forecast, by Application 2020 & 2033
- Table 21: Global Outdoor Power Supply Revenue billion Forecast, by Types 2020 & 2033
- Table 22: Global Outdoor Power Supply Volume K Forecast, by Types 2020 & 2033
- Table 23: Global Outdoor Power Supply Revenue billion Forecast, by Country 2020 & 2033
- Table 24: Global Outdoor Power Supply Volume K Forecast, by Country 2020 & 2033
- Table 25: Brazil Outdoor Power Supply Revenue (billion) Forecast, by Application 2020 & 2033
- Table 26: Brazil Outdoor Power Supply Volume (K) Forecast, by Application 2020 & 2033
- Table 27: Argentina Outdoor Power Supply Revenue (billion) Forecast, by Application 2020 & 2033
- Table 28: Argentina Outdoor Power Supply Volume (K) Forecast, by Application 2020 & 2033
- Table 29: Rest of South America Outdoor Power Supply Revenue (billion) Forecast, by Application 2020 & 2033
- Table 30: Rest of South America Outdoor Power Supply Volume (K) Forecast, by Application 2020 & 2033
- Table 31: Global Outdoor Power Supply Revenue billion Forecast, by Application 2020 & 2033
- Table 32: Global Outdoor Power Supply Volume K Forecast, by Application 2020 & 2033
- Table 33: Global Outdoor Power Supply Revenue billion Forecast, by Types 2020 & 2033
- Table 34: Global Outdoor Power Supply Volume K Forecast, by Types 2020 & 2033
- Table 35: Global Outdoor Power Supply Revenue billion Forecast, by Country 2020 & 2033
- Table 36: Global Outdoor Power Supply Volume K Forecast, by Country 2020 & 2033
- Table 37: United Kingdom Outdoor Power Supply Revenue (billion) Forecast, by Application 2020 & 2033
- Table 38: United Kingdom Outdoor Power Supply Volume (K) Forecast, by Application 2020 & 2033
- Table 39: Germany Outdoor Power Supply Revenue (billion) Forecast, by Application 2020 & 2033
- Table 40: Germany Outdoor Power Supply Volume (K) Forecast, by Application 2020 & 2033
- Table 41: France Outdoor Power Supply Revenue (billion) Forecast, by Application 2020 & 2033
- Table 42: France Outdoor Power Supply Volume (K) Forecast, by Application 2020 & 2033
- Table 43: Italy Outdoor Power Supply Revenue (billion) Forecast, by Application 2020 & 2033
- Table 44: Italy Outdoor Power Supply Volume (K) Forecast, by Application 2020 & 2033
- Table 45: Spain Outdoor Power Supply Revenue (billion) Forecast, by Application 2020 & 2033
- Table 46: Spain Outdoor Power Supply Volume (K) Forecast, by Application 2020 & 2033
- Table 47: Russia Outdoor Power Supply Revenue (billion) Forecast, by Application 2020 & 2033
- Table 48: Russia Outdoor Power Supply Volume (K) Forecast, by Application 2020 & 2033
- Table 49: Benelux Outdoor Power Supply Revenue (billion) Forecast, by Application 2020 & 2033
- Table 50: Benelux Outdoor Power Supply Volume (K) Forecast, by Application 2020 & 2033
- Table 51: Nordics Outdoor Power Supply Revenue (billion) Forecast, by Application 2020 & 2033
- Table 52: Nordics Outdoor Power Supply Volume (K) Forecast, by Application 2020 & 2033
- Table 53: Rest of Europe Outdoor Power Supply Revenue (billion) Forecast, by Application 2020 & 2033
- Table 54: Rest of Europe Outdoor Power Supply Volume (K) Forecast, by Application 2020 & 2033
- Table 55: Global Outdoor Power Supply Revenue billion Forecast, by Application 2020 & 2033
- Table 56: Global Outdoor Power Supply Volume K Forecast, by Application 2020 & 2033
- Table 57: Global Outdoor Power Supply Revenue billion Forecast, by Types 2020 & 2033
- Table 58: Global Outdoor Power Supply Volume K Forecast, by Types 2020 & 2033
- Table 59: Global Outdoor Power Supply Revenue billion Forecast, by Country 2020 & 2033
- Table 60: Global Outdoor Power Supply Volume K Forecast, by Country 2020 & 2033
- Table 61: Turkey Outdoor Power Supply Revenue (billion) Forecast, by Application 2020 & 2033
- Table 62: Turkey Outdoor Power Supply Volume (K) Forecast, by Application 2020 & 2033
- Table 63: Israel Outdoor Power Supply Revenue (billion) Forecast, by Application 2020 & 2033
- Table 64: Israel Outdoor Power Supply Volume (K) Forecast, by Application 2020 & 2033
- Table 65: GCC Outdoor Power Supply Revenue (billion) Forecast, by Application 2020 & 2033
- Table 66: GCC Outdoor Power Supply Volume (K) Forecast, by Application 2020 & 2033
- Table 67: North Africa Outdoor Power Supply Revenue (billion) Forecast, by Application 2020 & 2033
- Table 68: North Africa Outdoor Power Supply Volume (K) Forecast, by Application 2020 & 2033
- Table 69: South Africa Outdoor Power Supply Revenue (billion) Forecast, by Application 2020 & 2033
- Table 70: South Africa Outdoor Power Supply Volume (K) Forecast, by Application 2020 & 2033
- Table 71: Rest of Middle East & Africa Outdoor Power Supply Revenue (billion) Forecast, by Application 2020 & 2033
- Table 72: Rest of Middle East & Africa Outdoor Power Supply Volume (K) Forecast, by Application 2020 & 2033
- Table 73: Global Outdoor Power Supply Revenue billion Forecast, by Application 2020 & 2033
- Table 74: Global Outdoor Power Supply Volume K Forecast, by Application 2020 & 2033
- Table 75: Global Outdoor Power Supply Revenue billion Forecast, by Types 2020 & 2033
- Table 76: Global Outdoor Power Supply Volume K Forecast, by Types 2020 & 2033
- Table 77: Global Outdoor Power Supply Revenue billion Forecast, by Country 2020 & 2033
- Table 78: Global Outdoor Power Supply Volume K Forecast, by Country 2020 & 2033
- Table 79: China Outdoor Power Supply Revenue (billion) Forecast, by Application 2020 & 2033
- Table 80: China Outdoor Power Supply Volume (K) Forecast, by Application 2020 & 2033
- Table 81: India Outdoor Power Supply Revenue (billion) Forecast, by Application 2020 & 2033
- Table 82: India Outdoor Power Supply Volume (K) Forecast, by Application 2020 & 2033
- Table 83: Japan Outdoor Power Supply Revenue (billion) Forecast, by Application 2020 & 2033
- Table 84: Japan Outdoor Power Supply Volume (K) Forecast, by Application 2020 & 2033
- Table 85: South Korea Outdoor Power Supply Revenue (billion) Forecast, by Application 2020 & 2033
- Table 86: South Korea Outdoor Power Supply Volume (K) Forecast, by Application 2020 & 2033
- Table 87: ASEAN Outdoor Power Supply Revenue (billion) Forecast, by Application 2020 & 2033
- Table 88: ASEAN Outdoor Power Supply Volume (K) Forecast, by Application 2020 & 2033
- Table 89: Oceania Outdoor Power Supply Revenue (billion) Forecast, by Application 2020 & 2033
- Table 90: Oceania Outdoor Power Supply Volume (K) Forecast, by Application 2020 & 2033
- Table 91: Rest of Asia Pacific Outdoor Power Supply Revenue (billion) Forecast, by Application 2020 & 2033
- Table 92: Rest of Asia Pacific Outdoor Power Supply Volume (K) Forecast, by Application 2020 & 2033
Frequently Asked Questions
1. What is the projected Compound Annual Growth Rate (CAGR) of the Outdoor Power Supply?
The projected CAGR is approximately 5.33%.
2. Which companies are prominent players in the Outdoor Power Supply?
Key companies in the market include ECOFLOW, Shenzhen Hello Tech Energy, Shenzhen Poweroak Technology, GOAL ZERO, JVC, Allpowers, Westinghouse, DBK, PISEN, ANKER, Sbase, Letsolar, Yoobao, Newsmy, Orico, Flashfish, Pecron.
3. What are the main segments of the Outdoor Power Supply?
The market segments include Application, Types.
4. Can you provide details about the market size?
The market size is estimated to be USD 38.83 billion as of 2022.
5. What are some drivers contributing to market growth?
N/A
6. What are the notable trends driving market growth?
N/A
7. Are there any restraints impacting market growth?
N/A
8. Can you provide examples of recent developments in the market?
N/A
9. What pricing options are available for accessing the report?
Pricing options include single-user, multi-user, and enterprise licenses priced at USD 3950.00, USD 5925.00, and USD 7900.00 respectively.
10. Is the market size provided in terms of value or volume?
The market size is provided in terms of value, measured in billion and volume, measured in K.
11. Are there any specific market keywords associated with the report?
Yes, the market keyword associated with the report is "Outdoor Power Supply," which aids in identifying and referencing the specific market segment covered.
12. How do I determine which pricing option suits my needs best?
The pricing options vary based on user requirements and access needs. Individual users may opt for single-user licenses, while businesses requiring broader access may choose multi-user or enterprise licenses for cost-effective access to the report.
13. Are there any additional resources or data provided in the Outdoor Power Supply report?
While the report offers comprehensive insights, it's advisable to review the specific contents or supplementary materials provided to ascertain if additional resources or data are available.
14. How can I stay updated on further developments or reports in the Outdoor Power Supply?
To stay informed about further developments, trends, and reports in the Outdoor Power Supply, consider subscribing to industry newsletters, following relevant companies and organizations, or regularly checking reputable industry news sources and publications.
Methodology
Step 1 - Identification of Relevant Samples Size from Population Database


Step 2 - Approaches for Defining Global Market Size (Value, Volume* & Price*)

Note*: In applicable scenarios
Step 3 - Data Sources
Primary Research
- Web Analytics
- Survey Reports
- Research Institute
- Latest Research Reports
- Opinion Leaders
Secondary Research
- Annual Reports
- White Paper
- Latest Press Release
- Industry Association
- Paid Database
- Investor Presentations

Step 4 - Data Triangulation
Involves using different sources of information in order to increase the validity of a study
These sources are likely to be stakeholders in a program - participants, other researchers, program staff, other community members, and so on.
Then we put all data in single framework & apply various statistical tools to find out the dynamic on the market.
During the analysis stage, feedback from the stakeholder groups would be compared to determine areas of agreement as well as areas of divergence