
Key Insights
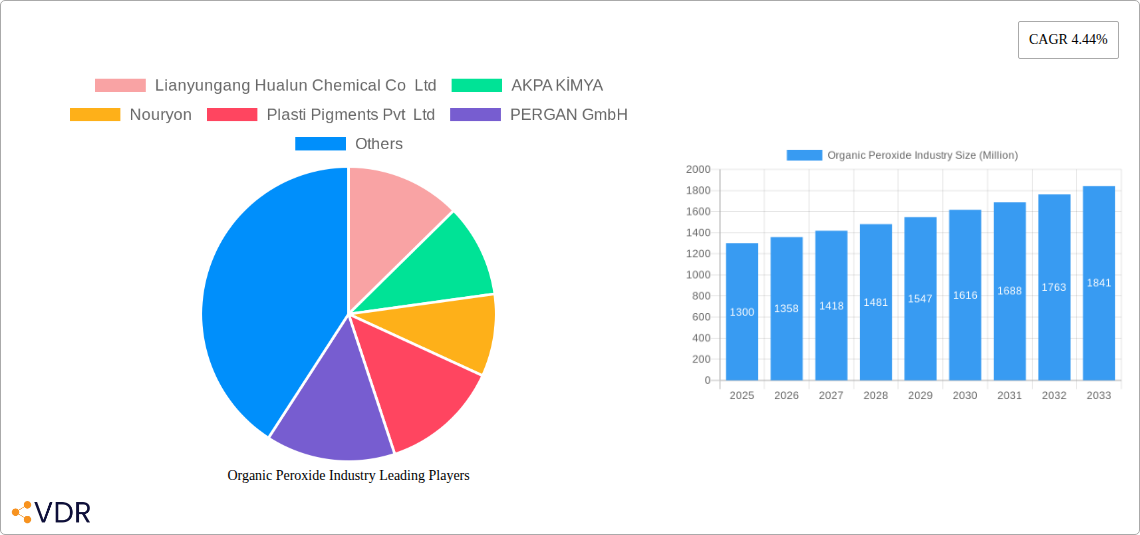
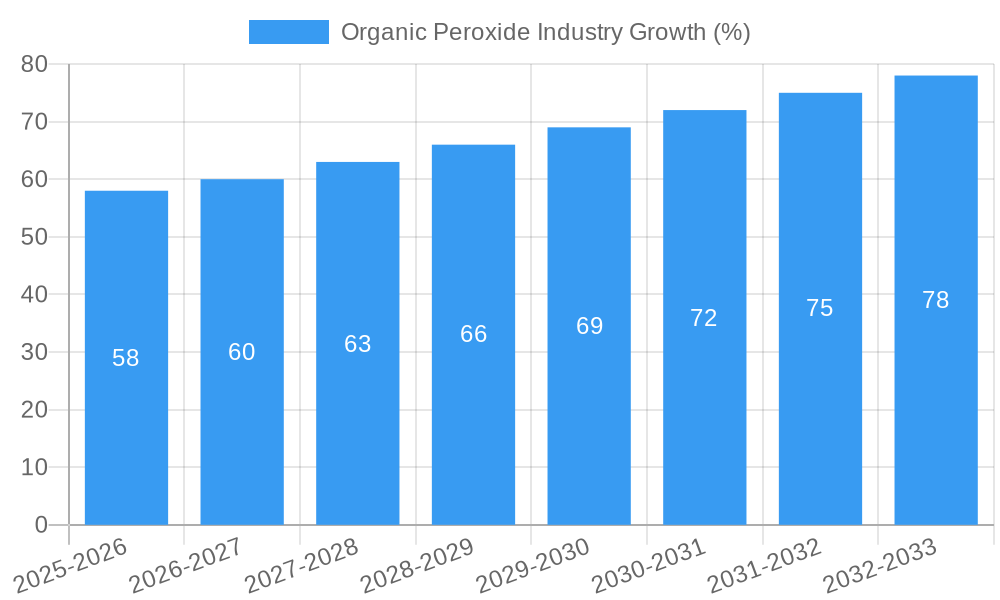
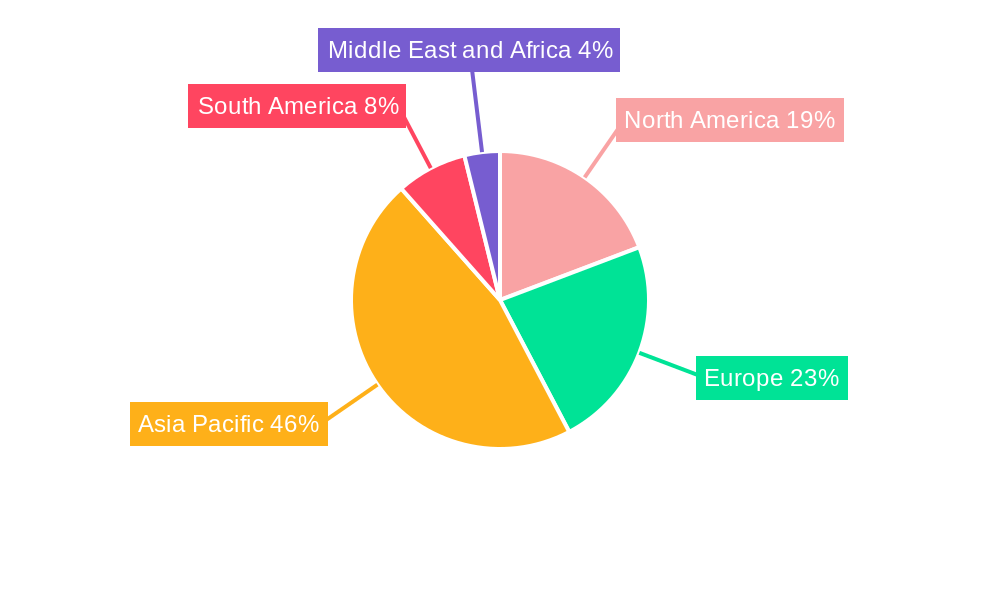
The global organic peroxide market, valued at $1.30 billion in 2025, is projected to experience robust growth, driven by increasing demand across diverse applications. A Compound Annual Growth Rate (CAGR) of 4.44% from 2025 to 2033 indicates a significant expansion, primarily fueled by the burgeoning polymers and rubber industry, where organic peroxides serve as crucial initiators in polymerization processes. The expanding construction, automotive, and packaging sectors further bolster market demand. Growth is also propelled by advancements in coatings and adhesives technology, necessitating high-performance, efficient curing agents. While the healthcare and cosmetics sectors represent niche applications, their increasing adoption of organic peroxides for specific formulations contributes to market growth. However, stringent safety regulations surrounding the handling and storage of these potent chemicals present a key restraint. Furthermore, the volatility of raw material prices and the potential for substitute technologies pose challenges to sustained market growth. The market segmentation reveals a diversified landscape, with diacyl peroxides and benzoyl peroxide dominating the type segment, reflecting their widespread use and established effectiveness. Geographically, the Asia-Pacific region, particularly China and India, is expected to lead market growth due to rapid industrialization and expanding manufacturing capacities.
The competitive landscape is marked by a mix of established multinational corporations and regional players. Key players are focused on strategic partnerships, mergers and acquisitions, and capacity expansions to enhance their market share and cater to the increasing demand. Innovation in product development, particularly in eco-friendly and high-performance formulations, is critical for sustained competitiveness. The forecast period (2025-2033) will likely witness further market consolidation, with larger players acquiring smaller companies to improve their technological capabilities and geographic reach. This will likely lead to further innovation in the types of organic peroxides available, potentially expanding into new applications and further driving market growth.
This comprehensive report provides a detailed analysis of the global organic peroxide industry, encompassing market dynamics, growth trends, regional segmentation, product landscape, key players, and future outlook. The study period covers 2019-2033, with 2025 as the base and estimated year. The report uses million units for all values.
Organic Peroxide Industry Market Dynamics & Structure
The organic peroxide market is characterized by moderate concentration, with several key players dominating different segments. Technological innovation, particularly in enhancing safety and efficiency of production and application, is a key driver. Stringent safety regulations concerning handling and transportation significantly influence market dynamics. Competitive pressure from substitute chemicals necessitates continuous product improvement. End-user demographics, especially in the polymers and rubber industries, heavily influence demand. M&A activity has been moderate, primarily focusing on expanding geographic reach and product portfolios.
- Market Concentration: Moderately concentrated, with top 10 players holding approximately xx% market share (2024).
- Technological Innovation: Focus on safer formulations, improved efficiency, and specialized applications.
- Regulatory Framework: Stringent safety and environmental regulations, varying by region.
- Competitive Substitutes: Certain applications face competition from alternative curing agents.
- End-User Demographics: Growth driven by demand from polymers, rubber, and coatings industries.
- M&A Trends: Moderate activity, driven by expansion and diversification strategies; xx deals recorded between 2019-2024.
Organic Peroxide Industry Growth Trends & Insights
The global organic peroxide market experienced steady growth during the historical period (2019-2024), driven by increasing demand from key end-use sectors. The market size reached xx million units in 2024, exhibiting a CAGR of xx% during this period. Technological advancements, particularly in the development of more efficient and environmentally friendly formulations, are expected to propel future growth. Increased adoption in emerging economies and shifting consumer preferences towards high-performance materials further contribute to market expansion. We project a CAGR of xx% from 2025 to 2033, reaching xx million units by 2033. Market penetration is expected to increase in developing regions, especially in Asia-Pacific.
Dominant Regions, Countries, or Segments in Organic Peroxide Industry
The Asia-Pacific region dominates the organic peroxide market, driven by robust growth in the polymers and rubber industries within countries like China and India. Strong economic growth, expanding infrastructure development, and increasing industrialization contribute to high demand. Within applications, Polymers and Rubber consistently demonstrates the largest market share, followed by Coatings and Adhesives. Benzoyl Peroxide and Dialkyl Peroxides represent significant segments in terms of type.
- Key Drivers (Asia-Pacific): Rapid industrialization, expanding infrastructure, increasing automotive and construction sectors.
- Dominance Factors: High demand from large manufacturing hubs, lower production costs in certain regions.
- Growth Potential: Continued expansion in emerging economies; innovation-driven growth in specialized applications.
Organic Peroxide Industry Product Landscape
Organic peroxide products are categorized by chemical type (e.g., benzoyl peroxide, dialkyl peroxides) and application. Innovations focus on improving safety, performance, and environmental profile. Unique selling propositions include enhanced reactivity, improved stability, and specialized formulations for specific applications. Technological advancements center on developing more efficient and environmentally benign production processes and formulations.
Key Drivers, Barriers & Challenges in Organic Peroxide Industry
Key Drivers:
- Growing demand from the construction, automotive, and packaging industries.
- Technological advancements leading to improved product performance.
- Government initiatives promoting industrial growth in developing countries.
Challenges:
- Stringent safety regulations and transportation costs impacting profitability.
- Competition from substitute chemicals and price fluctuations in raw materials.
- Supply chain disruptions potentially leading to production delays and increased costs (estimated xx% impact on 2024 production).
Emerging Opportunities in Organic Peroxide Industry
- Growing demand for sustainable and eco-friendly products.
- Expanding applications in niche markets like 3D printing and medical devices.
- Opportunities in emerging economies with high industrial growth potential.
Growth Accelerators in the Organic Peroxide Industry
Technological breakthroughs, particularly in improving the safety and efficiency of organic peroxide production and applications, are key drivers of long-term growth. Strategic partnerships and collaborations facilitate market expansion and access to new technologies. The increasing demand for advanced materials in diverse sectors, including renewable energy and electronics, creates additional growth opportunities.
Key Players Shaping the Organic Peroxide Industry Market
- Lianyungang Hualun Chemical Co Ltd
- AKPA KİMYA
- Nouryon
- Plasti Pigments Pvt Ltd
- PERGAN GmbH
- Novichem Spzoo
- United Initiators
- Kawaguchi Chemical Co Ltd
- MPI Chemie BV
- ACE CHEMICAL CORP
- Arkema Group
- NOF CORPORATION
- Chinasun Specialty Products Co Ltd
Notable Milestones in Organic Peroxide Industry Sector
- October 2022: Arkema reorganizes distribution of Luperox and Retic organic peroxides in Europe.
- July 2022: United Initiators completes new TBHP-TBA facility in China, expanding downstream peroxide production.
In-Depth Organic Peroxide Industry Market Outlook
The organic peroxide market is poised for continued growth, driven by expanding applications in key industries and technological advancements. Strategic investments in R&D, focusing on sustainable and high-performance products, will be critical for success. Companies focusing on expanding into emerging markets and developing innovative solutions will capture significant market share in the coming years. The projected growth trajectory indicates substantial potential for market expansion and attractive investment opportunities.
Organic Peroxide Industry Segmentation
-
1. Type
- 1.1. Diacyl Peroxides
- 1.2. Ketone Peroxides
- 1.3. Percarbonates
- 1.4. Benzoyl Peroxide
- 1.5. Dialkyl Peroxides
- 1.6. Hydro-Peroxides
- 1.7. Peroxyesters
- 1.8. Other Types
-
2. Application
- 2.1. Polymers and Rubber
- 2.2. Coatings and Adhesives
- 2.3. Paper and Textile
- 2.4. Cosmetics
- 2.5. Healthcare
- 2.6. Other Applications
Organic Peroxide Industry Segmentation By Geography
-
1. Asia Pacific
- 1.1. China
- 1.2. India
- 1.3. Japan
- 1.4. South Korea
- 1.5. Rest of Asia Pacific
-
2. North America
- 2.1. United States
- 2.2. Canada
- 2.3. Mexico
-
3. Europe
- 3.1. Germany
- 3.2. United Kingdom
- 3.3. Italy
- 3.4. France
- 3.5. Spain
- 3.6. Rest of Europe
-
4. South America
- 4.1. Brazil
- 4.2. Argentina
- 4.3. Rest of South America
-
5. Middle East and Africa
- 5.1. Saudi Arabia
- 5.2. South Africa
- 5.3. Rest of Middle East and Africa
Organic Peroxide Industry REPORT HIGHLIGHTS
| Aspects | Details |
|---|---|
| Study Period | 2019-2033 |
| Base Year | 2024 |
| Estimated Year | 2025 |
| Forecast Period | 2025-2033 |
| Historical Period | 2019-2024 |
| Growth Rate | CAGR of 4.44% from 2019-2033 |
| Segmentation |
|
Table of Contents
- 1. Introduction
- 1.1. Research Scope
- 1.2. Market Segmentation
- 1.3. Research Methodology
- 1.4. Definitions and Assumptions
- 2. Executive Summary
- 2.1. Introduction
- 3. Market Dynamics
- 3.1. Introduction
- 3.2. Market Drivers
- 3.2.1. Increasing Demand for Polymers from Various End-user Industries; Surging Utilization in Coating Applications
- 3.3. Market Restrains
- 3.3.1 Difficulty in Storage
- 3.3.2 Transport
- 3.3.3 and Handling Organic Peroxides
- 3.4. Market Trends
- 3.4.1. Polymers and Rubbers to Dominate the Market
- 4. Market Factor Analysis
- 4.1. Porters Five Forces
- 4.2. Supply/Value Chain
- 4.3. PESTEL analysis
- 4.4. Market Entropy
- 4.5. Patent/Trademark Analysis
- 5. Global Organic Peroxide Industry Analysis, Insights and Forecast, 2019-2031
- 5.1. Market Analysis, Insights and Forecast - by Type
- 5.1.1. Diacyl Peroxides
- 5.1.2. Ketone Peroxides
- 5.1.3. Percarbonates
- 5.1.4. Benzoyl Peroxide
- 5.1.5. Dialkyl Peroxides
- 5.1.6. Hydro-Peroxides
- 5.1.7. Peroxyesters
- 5.1.8. Other Types
- 5.2. Market Analysis, Insights and Forecast - by Application
- 5.2.1. Polymers and Rubber
- 5.2.2. Coatings and Adhesives
- 5.2.3. Paper and Textile
- 5.2.4. Cosmetics
- 5.2.5. Healthcare
- 5.2.6. Other Applications
- 5.3. Market Analysis, Insights and Forecast - by Region
- 5.3.1. Asia Pacific
- 5.3.2. North America
- 5.3.3. Europe
- 5.3.4. South America
- 5.3.5. Middle East and Africa
- 5.1. Market Analysis, Insights and Forecast - by Type
- 6. Asia Pacific Organic Peroxide Industry Analysis, Insights and Forecast, 2019-2031
- 6.1. Market Analysis, Insights and Forecast - by Type
- 6.1.1. Diacyl Peroxides
- 6.1.2. Ketone Peroxides
- 6.1.3. Percarbonates
- 6.1.4. Benzoyl Peroxide
- 6.1.5. Dialkyl Peroxides
- 6.1.6. Hydro-Peroxides
- 6.1.7. Peroxyesters
- 6.1.8. Other Types
- 6.2. Market Analysis, Insights and Forecast - by Application
- 6.2.1. Polymers and Rubber
- 6.2.2. Coatings and Adhesives
- 6.2.3. Paper and Textile
- 6.2.4. Cosmetics
- 6.2.5. Healthcare
- 6.2.6. Other Applications
- 6.1. Market Analysis, Insights and Forecast - by Type
- 7. North America Organic Peroxide Industry Analysis, Insights and Forecast, 2019-2031
- 7.1. Market Analysis, Insights and Forecast - by Type
- 7.1.1. Diacyl Peroxides
- 7.1.2. Ketone Peroxides
- 7.1.3. Percarbonates
- 7.1.4. Benzoyl Peroxide
- 7.1.5. Dialkyl Peroxides
- 7.1.6. Hydro-Peroxides
- 7.1.7. Peroxyesters
- 7.1.8. Other Types
- 7.2. Market Analysis, Insights and Forecast - by Application
- 7.2.1. Polymers and Rubber
- 7.2.2. Coatings and Adhesives
- 7.2.3. Paper and Textile
- 7.2.4. Cosmetics
- 7.2.5. Healthcare
- 7.2.6. Other Applications
- 7.1. Market Analysis, Insights and Forecast - by Type
- 8. Europe Organic Peroxide Industry Analysis, Insights and Forecast, 2019-2031
- 8.1. Market Analysis, Insights and Forecast - by Type
- 8.1.1. Diacyl Peroxides
- 8.1.2. Ketone Peroxides
- 8.1.3. Percarbonates
- 8.1.4. Benzoyl Peroxide
- 8.1.5. Dialkyl Peroxides
- 8.1.6. Hydro-Peroxides
- 8.1.7. Peroxyesters
- 8.1.8. Other Types
- 8.2. Market Analysis, Insights and Forecast - by Application
- 8.2.1. Polymers and Rubber
- 8.2.2. Coatings and Adhesives
- 8.2.3. Paper and Textile
- 8.2.4. Cosmetics
- 8.2.5. Healthcare
- 8.2.6. Other Applications
- 8.1. Market Analysis, Insights and Forecast - by Type
- 9. South America Organic Peroxide Industry Analysis, Insights and Forecast, 2019-2031
- 9.1. Market Analysis, Insights and Forecast - by Type
- 9.1.1. Diacyl Peroxides
- 9.1.2. Ketone Peroxides
- 9.1.3. Percarbonates
- 9.1.4. Benzoyl Peroxide
- 9.1.5. Dialkyl Peroxides
- 9.1.6. Hydro-Peroxides
- 9.1.7. Peroxyesters
- 9.1.8. Other Types
- 9.2. Market Analysis, Insights and Forecast - by Application
- 9.2.1. Polymers and Rubber
- 9.2.2. Coatings and Adhesives
- 9.2.3. Paper and Textile
- 9.2.4. Cosmetics
- 9.2.5. Healthcare
- 9.2.6. Other Applications
- 9.1. Market Analysis, Insights and Forecast - by Type
- 10. Middle East and Africa Organic Peroxide Industry Analysis, Insights and Forecast, 2019-2031
- 10.1. Market Analysis, Insights and Forecast - by Type
- 10.1.1. Diacyl Peroxides
- 10.1.2. Ketone Peroxides
- 10.1.3. Percarbonates
- 10.1.4. Benzoyl Peroxide
- 10.1.5. Dialkyl Peroxides
- 10.1.6. Hydro-Peroxides
- 10.1.7. Peroxyesters
- 10.1.8. Other Types
- 10.2. Market Analysis, Insights and Forecast - by Application
- 10.2.1. Polymers and Rubber
- 10.2.2. Coatings and Adhesives
- 10.2.3. Paper and Textile
- 10.2.4. Cosmetics
- 10.2.5. Healthcare
- 10.2.6. Other Applications
- 10.1. Market Analysis, Insights and Forecast - by Type
- 11. Asia Pacific Organic Peroxide Industry Analysis, Insights and Forecast, 2019-2031
- 11.1. Market Analysis, Insights and Forecast - By Country/Sub-region
- 11.1.1 China
- 11.1.2 India
- 11.1.3 Japan
- 11.1.4 South Korea
- 11.1.5 Rest of Asia Pacific
- 12. North America Organic Peroxide Industry Analysis, Insights and Forecast, 2019-2031
- 12.1. Market Analysis, Insights and Forecast - By Country/Sub-region
- 12.1.1 United States
- 12.1.2 Canada
- 12.1.3 Mexico
- 13. Europe Organic Peroxide Industry Analysis, Insights and Forecast, 2019-2031
- 13.1. Market Analysis, Insights and Forecast - By Country/Sub-region
- 13.1.1 Germany
- 13.1.2 United Kingdom
- 13.1.3 Italy
- 13.1.4 France
- 13.1.5 Spain
- 13.1.6 Rest of Europe
- 14. South America Organic Peroxide Industry Analysis, Insights and Forecast, 2019-2031
- 14.1. Market Analysis, Insights and Forecast - By Country/Sub-region
- 14.1.1 Brazil
- 14.1.2 Argentina
- 14.1.3 Rest of South America
- 15. Middle East and Africa Organic Peroxide Industry Analysis, Insights and Forecast, 2019-2031
- 15.1. Market Analysis, Insights and Forecast - By Country/Sub-region
- 15.1.1 Saudi Arabia
- 15.1.2 South Africa
- 15.1.3 Rest of Middle East and Africa
- 16. Competitive Analysis
- 16.1. Global Market Share Analysis 2024
- 16.2. Company Profiles
- 16.2.1 Lianyungang Hualun Chemical Co Ltd
- 16.2.1.1. Overview
- 16.2.1.2. Products
- 16.2.1.3. SWOT Analysis
- 16.2.1.4. Recent Developments
- 16.2.1.5. Financials (Based on Availability)
- 16.2.2 AKPA KİMYA
- 16.2.2.1. Overview
- 16.2.2.2. Products
- 16.2.2.3. SWOT Analysis
- 16.2.2.4. Recent Developments
- 16.2.2.5. Financials (Based on Availability)
- 16.2.3 Nouryon
- 16.2.3.1. Overview
- 16.2.3.2. Products
- 16.2.3.3. SWOT Analysis
- 16.2.3.4. Recent Developments
- 16.2.3.5. Financials (Based on Availability)
- 16.2.4 Plasti Pigments Pvt Ltd
- 16.2.4.1. Overview
- 16.2.4.2. Products
- 16.2.4.3. SWOT Analysis
- 16.2.4.4. Recent Developments
- 16.2.4.5. Financials (Based on Availability)
- 16.2.5 PERGAN GmbH
- 16.2.5.1. Overview
- 16.2.5.2. Products
- 16.2.5.3. SWOT Analysis
- 16.2.5.4. Recent Developments
- 16.2.5.5. Financials (Based on Availability)
- 16.2.6 Novichem Spzoo
- 16.2.6.1. Overview
- 16.2.6.2. Products
- 16.2.6.3. SWOT Analysis
- 16.2.6.4. Recent Developments
- 16.2.6.5. Financials (Based on Availability)
- 16.2.7 United Initiators*List Not Exhaustive
- 16.2.7.1. Overview
- 16.2.7.2. Products
- 16.2.7.3. SWOT Analysis
- 16.2.7.4. Recent Developments
- 16.2.7.5. Financials (Based on Availability)
- 16.2.8 Kawaguchi Chemical Co Ltd
- 16.2.8.1. Overview
- 16.2.8.2. Products
- 16.2.8.3. SWOT Analysis
- 16.2.8.4. Recent Developments
- 16.2.8.5. Financials (Based on Availability)
- 16.2.9 MPI Chemie BV
- 16.2.9.1. Overview
- 16.2.9.2. Products
- 16.2.9.3. SWOT Analysis
- 16.2.9.4. Recent Developments
- 16.2.9.5. Financials (Based on Availability)
- 16.2.10 ACE CHEMICAL CORP
- 16.2.10.1. Overview
- 16.2.10.2. Products
- 16.2.10.3. SWOT Analysis
- 16.2.10.4. Recent Developments
- 16.2.10.5. Financials (Based on Availability)
- 16.2.11 Arkema Group
- 16.2.11.1. Overview
- 16.2.11.2. Products
- 16.2.11.3. SWOT Analysis
- 16.2.11.4. Recent Developments
- 16.2.11.5. Financials (Based on Availability)
- 16.2.12 NOF CORPORATION
- 16.2.12.1. Overview
- 16.2.12.2. Products
- 16.2.12.3. SWOT Analysis
- 16.2.12.4. Recent Developments
- 16.2.12.5. Financials (Based on Availability)
- 16.2.13 Chinasun Specialty Products Co Ltd
- 16.2.13.1. Overview
- 16.2.13.2. Products
- 16.2.13.3. SWOT Analysis
- 16.2.13.4. Recent Developments
- 16.2.13.5. Financials (Based on Availability)
- 16.2.1 Lianyungang Hualun Chemical Co Ltd
List of Figures
- Figure 1: Global Organic Peroxide Industry Revenue Breakdown (Million, %) by Region 2024 & 2032
- Figure 2: Asia Pacific Organic Peroxide Industry Revenue (Million), by Country 2024 & 2032
- Figure 3: Asia Pacific Organic Peroxide Industry Revenue Share (%), by Country 2024 & 2032
- Figure 4: North America Organic Peroxide Industry Revenue (Million), by Country 2024 & 2032
- Figure 5: North America Organic Peroxide Industry Revenue Share (%), by Country 2024 & 2032
- Figure 6: Europe Organic Peroxide Industry Revenue (Million), by Country 2024 & 2032
- Figure 7: Europe Organic Peroxide Industry Revenue Share (%), by Country 2024 & 2032
- Figure 8: South America Organic Peroxide Industry Revenue (Million), by Country 2024 & 2032
- Figure 9: South America Organic Peroxide Industry Revenue Share (%), by Country 2024 & 2032
- Figure 10: Middle East and Africa Organic Peroxide Industry Revenue (Million), by Country 2024 & 2032
- Figure 11: Middle East and Africa Organic Peroxide Industry Revenue Share (%), by Country 2024 & 2032
- Figure 12: Asia Pacific Organic Peroxide Industry Revenue (Million), by Type 2024 & 2032
- Figure 13: Asia Pacific Organic Peroxide Industry Revenue Share (%), by Type 2024 & 2032
- Figure 14: Asia Pacific Organic Peroxide Industry Revenue (Million), by Application 2024 & 2032
- Figure 15: Asia Pacific Organic Peroxide Industry Revenue Share (%), by Application 2024 & 2032
- Figure 16: Asia Pacific Organic Peroxide Industry Revenue (Million), by Country 2024 & 2032
- Figure 17: Asia Pacific Organic Peroxide Industry Revenue Share (%), by Country 2024 & 2032
- Figure 18: North America Organic Peroxide Industry Revenue (Million), by Type 2024 & 2032
- Figure 19: North America Organic Peroxide Industry Revenue Share (%), by Type 2024 & 2032
- Figure 20: North America Organic Peroxide Industry Revenue (Million), by Application 2024 & 2032
- Figure 21: North America Organic Peroxide Industry Revenue Share (%), by Application 2024 & 2032
- Figure 22: North America Organic Peroxide Industry Revenue (Million), by Country 2024 & 2032
- Figure 23: North America Organic Peroxide Industry Revenue Share (%), by Country 2024 & 2032
- Figure 24: Europe Organic Peroxide Industry Revenue (Million), by Type 2024 & 2032
- Figure 25: Europe Organic Peroxide Industry Revenue Share (%), by Type 2024 & 2032
- Figure 26: Europe Organic Peroxide Industry Revenue (Million), by Application 2024 & 2032
- Figure 27: Europe Organic Peroxide Industry Revenue Share (%), by Application 2024 & 2032
- Figure 28: Europe Organic Peroxide Industry Revenue (Million), by Country 2024 & 2032
- Figure 29: Europe Organic Peroxide Industry Revenue Share (%), by Country 2024 & 2032
- Figure 30: South America Organic Peroxide Industry Revenue (Million), by Type 2024 & 2032
- Figure 31: South America Organic Peroxide Industry Revenue Share (%), by Type 2024 & 2032
- Figure 32: South America Organic Peroxide Industry Revenue (Million), by Application 2024 & 2032
- Figure 33: South America Organic Peroxide Industry Revenue Share (%), by Application 2024 & 2032
- Figure 34: South America Organic Peroxide Industry Revenue (Million), by Country 2024 & 2032
- Figure 35: South America Organic Peroxide Industry Revenue Share (%), by Country 2024 & 2032
- Figure 36: Middle East and Africa Organic Peroxide Industry Revenue (Million), by Type 2024 & 2032
- Figure 37: Middle East and Africa Organic Peroxide Industry Revenue Share (%), by Type 2024 & 2032
- Figure 38: Middle East and Africa Organic Peroxide Industry Revenue (Million), by Application 2024 & 2032
- Figure 39: Middle East and Africa Organic Peroxide Industry Revenue Share (%), by Application 2024 & 2032
- Figure 40: Middle East and Africa Organic Peroxide Industry Revenue (Million), by Country 2024 & 2032
- Figure 41: Middle East and Africa Organic Peroxide Industry Revenue Share (%), by Country 2024 & 2032
List of Tables
- Table 1: Global Organic Peroxide Industry Revenue Million Forecast, by Region 2019 & 2032
- Table 2: Global Organic Peroxide Industry Revenue Million Forecast, by Type 2019 & 2032
- Table 3: Global Organic Peroxide Industry Revenue Million Forecast, by Application 2019 & 2032
- Table 4: Global Organic Peroxide Industry Revenue Million Forecast, by Region 2019 & 2032
- Table 5: Global Organic Peroxide Industry Revenue Million Forecast, by Country 2019 & 2032
- Table 6: China Organic Peroxide Industry Revenue (Million) Forecast, by Application 2019 & 2032
- Table 7: India Organic Peroxide Industry Revenue (Million) Forecast, by Application 2019 & 2032
- Table 8: Japan Organic Peroxide Industry Revenue (Million) Forecast, by Application 2019 & 2032
- Table 9: South Korea Organic Peroxide Industry Revenue (Million) Forecast, by Application 2019 & 2032
- Table 10: Rest of Asia Pacific Organic Peroxide Industry Revenue (Million) Forecast, by Application 2019 & 2032
- Table 11: Global Organic Peroxide Industry Revenue Million Forecast, by Country 2019 & 2032
- Table 12: United States Organic Peroxide Industry Revenue (Million) Forecast, by Application 2019 & 2032
- Table 13: Canada Organic Peroxide Industry Revenue (Million) Forecast, by Application 2019 & 2032
- Table 14: Mexico Organic Peroxide Industry Revenue (Million) Forecast, by Application 2019 & 2032
- Table 15: Global Organic Peroxide Industry Revenue Million Forecast, by Country 2019 & 2032
- Table 16: Germany Organic Peroxide Industry Revenue (Million) Forecast, by Application 2019 & 2032
- Table 17: United Kingdom Organic Peroxide Industry Revenue (Million) Forecast, by Application 2019 & 2032
- Table 18: Italy Organic Peroxide Industry Revenue (Million) Forecast, by Application 2019 & 2032
- Table 19: France Organic Peroxide Industry Revenue (Million) Forecast, by Application 2019 & 2032
- Table 20: Spain Organic Peroxide Industry Revenue (Million) Forecast, by Application 2019 & 2032
- Table 21: Rest of Europe Organic Peroxide Industry Revenue (Million) Forecast, by Application 2019 & 2032
- Table 22: Global Organic Peroxide Industry Revenue Million Forecast, by Country 2019 & 2032
- Table 23: Brazil Organic Peroxide Industry Revenue (Million) Forecast, by Application 2019 & 2032
- Table 24: Argentina Organic Peroxide Industry Revenue (Million) Forecast, by Application 2019 & 2032
- Table 25: Rest of South America Organic Peroxide Industry Revenue (Million) Forecast, by Application 2019 & 2032
- Table 26: Global Organic Peroxide Industry Revenue Million Forecast, by Country 2019 & 2032
- Table 27: Saudi Arabia Organic Peroxide Industry Revenue (Million) Forecast, by Application 2019 & 2032
- Table 28: South Africa Organic Peroxide Industry Revenue (Million) Forecast, by Application 2019 & 2032
- Table 29: Rest of Middle East and Africa Organic Peroxide Industry Revenue (Million) Forecast, by Application 2019 & 2032
- Table 30: Global Organic Peroxide Industry Revenue Million Forecast, by Type 2019 & 2032
- Table 31: Global Organic Peroxide Industry Revenue Million Forecast, by Application 2019 & 2032
- Table 32: Global Organic Peroxide Industry Revenue Million Forecast, by Country 2019 & 2032
- Table 33: China Organic Peroxide Industry Revenue (Million) Forecast, by Application 2019 & 2032
- Table 34: India Organic Peroxide Industry Revenue (Million) Forecast, by Application 2019 & 2032
- Table 35: Japan Organic Peroxide Industry Revenue (Million) Forecast, by Application 2019 & 2032
- Table 36: South Korea Organic Peroxide Industry Revenue (Million) Forecast, by Application 2019 & 2032
- Table 37: Rest of Asia Pacific Organic Peroxide Industry Revenue (Million) Forecast, by Application 2019 & 2032
- Table 38: Global Organic Peroxide Industry Revenue Million Forecast, by Type 2019 & 2032
- Table 39: Global Organic Peroxide Industry Revenue Million Forecast, by Application 2019 & 2032
- Table 40: Global Organic Peroxide Industry Revenue Million Forecast, by Country 2019 & 2032
- Table 41: United States Organic Peroxide Industry Revenue (Million) Forecast, by Application 2019 & 2032
- Table 42: Canada Organic Peroxide Industry Revenue (Million) Forecast, by Application 2019 & 2032
- Table 43: Mexico Organic Peroxide Industry Revenue (Million) Forecast, by Application 2019 & 2032
- Table 44: Global Organic Peroxide Industry Revenue Million Forecast, by Type 2019 & 2032
- Table 45: Global Organic Peroxide Industry Revenue Million Forecast, by Application 2019 & 2032
- Table 46: Global Organic Peroxide Industry Revenue Million Forecast, by Country 2019 & 2032
- Table 47: Germany Organic Peroxide Industry Revenue (Million) Forecast, by Application 2019 & 2032
- Table 48: United Kingdom Organic Peroxide Industry Revenue (Million) Forecast, by Application 2019 & 2032
- Table 49: Italy Organic Peroxide Industry Revenue (Million) Forecast, by Application 2019 & 2032
- Table 50: France Organic Peroxide Industry Revenue (Million) Forecast, by Application 2019 & 2032
- Table 51: Spain Organic Peroxide Industry Revenue (Million) Forecast, by Application 2019 & 2032
- Table 52: Rest of Europe Organic Peroxide Industry Revenue (Million) Forecast, by Application 2019 & 2032
- Table 53: Global Organic Peroxide Industry Revenue Million Forecast, by Type 2019 & 2032
- Table 54: Global Organic Peroxide Industry Revenue Million Forecast, by Application 2019 & 2032
- Table 55: Global Organic Peroxide Industry Revenue Million Forecast, by Country 2019 & 2032
- Table 56: Brazil Organic Peroxide Industry Revenue (Million) Forecast, by Application 2019 & 2032
- Table 57: Argentina Organic Peroxide Industry Revenue (Million) Forecast, by Application 2019 & 2032
- Table 58: Rest of South America Organic Peroxide Industry Revenue (Million) Forecast, by Application 2019 & 2032
- Table 59: Global Organic Peroxide Industry Revenue Million Forecast, by Type 2019 & 2032
- Table 60: Global Organic Peroxide Industry Revenue Million Forecast, by Application 2019 & 2032
- Table 61: Global Organic Peroxide Industry Revenue Million Forecast, by Country 2019 & 2032
- Table 62: Saudi Arabia Organic Peroxide Industry Revenue (Million) Forecast, by Application 2019 & 2032
- Table 63: South Africa Organic Peroxide Industry Revenue (Million) Forecast, by Application 2019 & 2032
- Table 64: Rest of Middle East and Africa Organic Peroxide Industry Revenue (Million) Forecast, by Application 2019 & 2032
Frequently Asked Questions
1. What is the projected Compound Annual Growth Rate (CAGR) of the Organic Peroxide Industry?
The projected CAGR is approximately 4.44%.
2. Which companies are prominent players in the Organic Peroxide Industry?
Key companies in the market include Lianyungang Hualun Chemical Co Ltd, AKPA KİMYA, Nouryon, Plasti Pigments Pvt Ltd, PERGAN GmbH, Novichem Spzoo, United Initiators*List Not Exhaustive, Kawaguchi Chemical Co Ltd, MPI Chemie BV, ACE CHEMICAL CORP, Arkema Group, NOF CORPORATION, Chinasun Specialty Products Co Ltd.
3. What are the main segments of the Organic Peroxide Industry?
The market segments include Type, Application.
4. Can you provide details about the market size?
The market size is estimated to be USD 1.30 Million as of 2022.
5. What are some drivers contributing to market growth?
Increasing Demand for Polymers from Various End-user Industries; Surging Utilization in Coating Applications.
6. What are the notable trends driving market growth?
Polymers and Rubbers to Dominate the Market.
7. Are there any restraints impacting market growth?
Difficulty in Storage. Transport. and Handling Organic Peroxides.
8. Can you provide examples of recent developments in the market?
In October 2022, Arkema announced that the company will reorganize the distribution of its Luperox and Retic organic peroxides, with Weber and Schaer, The Dolder company, and Univar Solutions, for the crosslinking market in several European countries as of January 1st, 2023.
9. What pricing options are available for accessing the report?
Pricing options include single-user, multi-user, and enterprise licenses priced at USD 4750, USD 5250, and USD 8750 respectively.
10. Is the market size provided in terms of value or volume?
The market size is provided in terms of value, measured in Million.
11. Are there any specific market keywords associated with the report?
Yes, the market keyword associated with the report is "Organic Peroxide Industry," which aids in identifying and referencing the specific market segment covered.
12. How do I determine which pricing option suits my needs best?
The pricing options vary based on user requirements and access needs. Individual users may opt for single-user licenses, while businesses requiring broader access may choose multi-user or enterprise licenses for cost-effective access to the report.
13. Are there any additional resources or data provided in the Organic Peroxide Industry report?
While the report offers comprehensive insights, it's advisable to review the specific contents or supplementary materials provided to ascertain if additional resources or data are available.
14. How can I stay updated on further developments or reports in the Organic Peroxide Industry?
To stay informed about further developments, trends, and reports in the Organic Peroxide Industry, consider subscribing to industry newsletters, following relevant companies and organizations, or regularly checking reputable industry news sources and publications.
Methodology
Step 1 - Identification of Relevant Samples Size from Population Database


Step 2 - Approaches for Defining Global Market Size (Value, Volume* & Price*)

Note*: In applicable scenarios
Step 3 - Data Sources
Primary Research
- Web Analytics
- Survey Reports
- Research Institute
- Latest Research Reports
- Opinion Leaders
Secondary Research
- Annual Reports
- White Paper
- Latest Press Release
- Industry Association
- Paid Database
- Investor Presentations

Step 4 - Data Triangulation
Involves using different sources of information in order to increase the validity of a study
These sources are likely to be stakeholders in a program - participants, other researchers, program staff, other community members, and so on.
Then we put all data in single framework & apply various statistical tools to find out the dynamic on the market.
During the analysis stage, feedback from the stakeholder groups would be compared to determine areas of agreement as well as areas of divergence


