
Key Insights
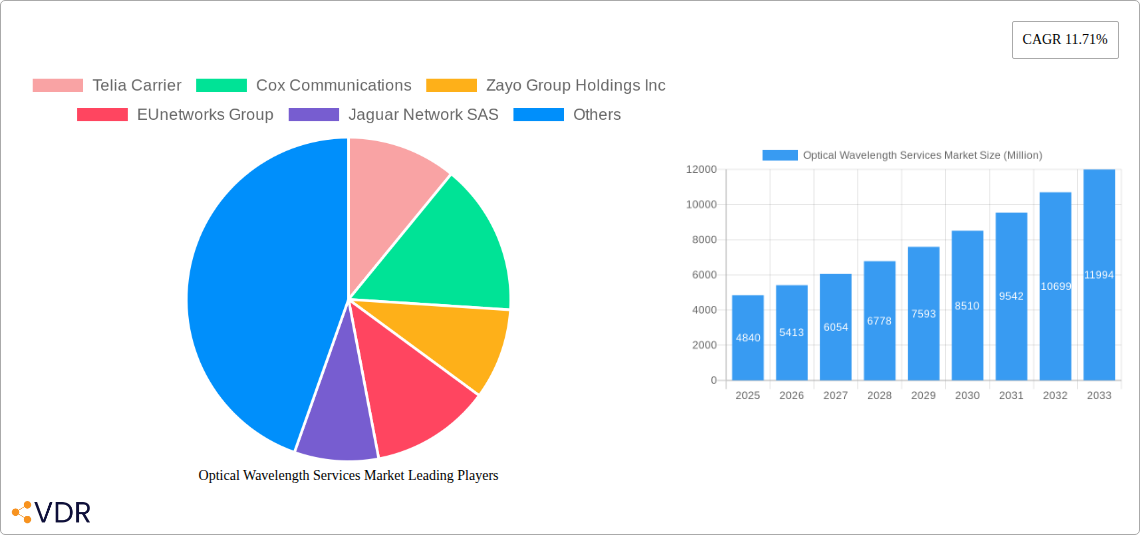
The Optical Wavelength Services market is experiencing robust growth, projected to reach $4.84 billion in 2025 and maintain a Compound Annual Growth Rate (CAGR) of 11.71% from 2025 to 2033. This expansion is driven primarily by the increasing demand for high-bandwidth connectivity across various sectors, including cloud computing, data centers, and 5G network infrastructure. The surge in data traffic necessitates faster and more reliable optical transmission solutions, fueling the adoption of 100 Gbps and higher bandwidth services. Furthermore, the ongoing expansion of global internet infrastructure and the rise of Internet of Things (IoT) applications contribute significantly to market growth. Technological advancements, such as the development of coherent optical technologies and Software Defined Networking (SDN), are enhancing network efficiency and scalability, further stimulating market expansion. Competition among established players like AT&T, Verizon, and Lumen Technologies, alongside emerging providers, is intensifying, leading to price optimization and service innovation. However, challenges remain, including the high initial investment required for network upgrades and the complexities of managing and maintaining extensive fiber optic networks.
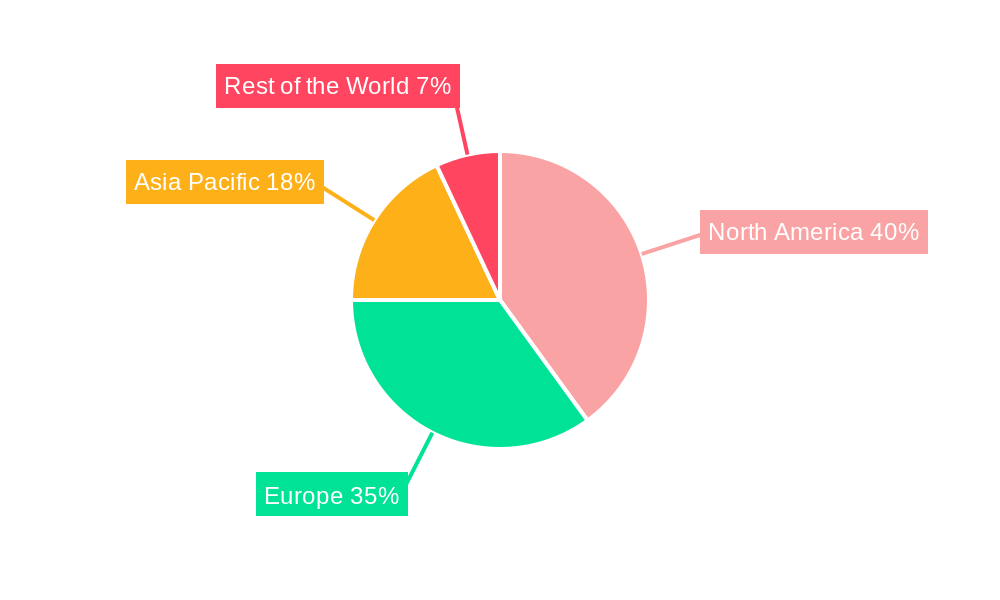
The market segmentation by bandwidth highlights a clear trend toward higher capacities. While lower bandwidth segments (less than 10 Gbps) remain relevant, the fastest growth is observed in the 100 Gbps and above category, reflecting the insatiable appetite for higher data throughput. Geographically, North America and Europe currently hold significant market shares, driven by advanced technological adoption and a well-established infrastructure. However, the Asia-Pacific region is expected to witness substantial growth in the forecast period, fueled by increasing digitalization and infrastructure development. Strategies for market participants include focusing on innovative solutions catering to specific customer needs, strengthening partnerships to expand reach, and investing in research and development to stay ahead in technological advancements. Effective network management and security solutions will also be crucial to retain market share and build trust.
Optical Wavelength Services Market: A Comprehensive Report (2019-2033)
This comprehensive report provides an in-depth analysis of the Optical Wavelength Services Market, encompassing market dynamics, growth trends, regional dominance, product landscape, key players, and future outlook. The report covers the period from 2019 to 2033, with a focus on the forecast period of 2025-2033 and a base year of 2025. The parent market is the Telecommunications Services market, and the child market is Optical Wavelength Services. This report is crucial for industry professionals, investors, and strategists seeking to understand and capitalize on the growth opportunities within this dynamic sector. The market size is projected to reach xx Million by 2033.
Optical Wavelength Services Market Dynamics & Structure
The Optical Wavelength Services market is characterized by a moderately concentrated landscape, with key players such as Telia Carrier, Verizon Communications Inc, and Lumen Technologies holding significant market share. Technological innovation, particularly in higher bandwidth capacities (400Gbps and beyond), is a primary growth driver. Regulatory frameworks concerning network infrastructure and spectrum allocation significantly influence market expansion. Competitive substitutes include other high-bandwidth data transmission technologies, but optical wavelengths maintain an edge due to their superior capacity and long-haul capabilities. The end-user demographic is diverse, encompassing telecommunication carriers, enterprises, and cloud providers. M&A activity has been relatively moderate in recent years, with xx deals recorded between 2019 and 2024, representing a total transaction value of xx Million.
- Market Concentration: Moderately concentrated, with top 5 players holding approximately xx% market share (2024).
- Technological Innovation: Focus on 400Gbps and beyond, driving higher capacity and efficiency.
- Regulatory Framework: Influences infrastructure investment and spectrum allocation.
- Competitive Substitutes: Other high-bandwidth technologies, but optical wavelengths remain dominant.
- End-User Demographics: Telecommunication carriers, enterprises, cloud providers, and government entities.
- M&A Trends: xx deals between 2019-2024, totaling xx Million in value. Further consolidation expected.
- Innovation Barriers: High capital expenditure for network upgrades and skilled workforce availability.
Optical Wavelength Services Market Growth Trends & Insights
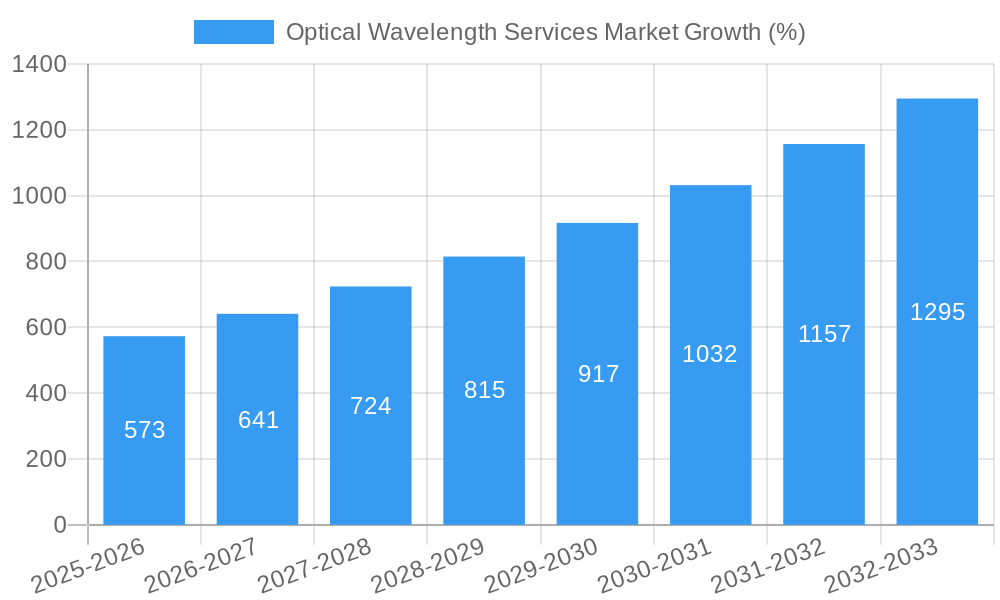
The Optical Wavelength Services market experienced significant growth during the historical period (2019-2024), expanding at a CAGR of xx%. This growth is primarily fueled by increasing demand for high-bandwidth connectivity driven by cloud computing, video streaming, and the Internet of Things (IoT). The market is expected to continue its robust expansion during the forecast period (2025-2033), with a projected CAGR of xx%, reaching xx Million by 2033. This growth will be driven by ongoing technological advancements, increasing adoption rates across various industries, and the growing need for low-latency, high-capacity networks. The market penetration rate is currently at xx% and is projected to increase to xx% by 2033. The shift in consumer behavior towards higher bandwidth consumption and the rise of 5G networks further accelerate market growth.
Dominant Regions, Countries, or Segments in Optical Wavelength Services Market
North America currently dominates the Optical Wavelength Services market, accounting for approximately xx% of the global market share in 2024, followed by Europe and Asia-Pacific. This dominance is primarily attributed to robust infrastructure development, substantial investments in fiber optic networks, and a high concentration of major telecommunication carriers and data centers. Within the bandwidth segments, the demand for 100 Gbps and above is driving growth. The ‘More Than 100 Gbps’ segment is experiencing the highest growth rate, driven by increasing adoption in hyperscale data centers and the proliferation of bandwidth-intensive applications.
- Key Drivers in North America: Advanced infrastructure, high concentration of data centers, significant investments in fiber optic networks.
- Key Drivers in Europe: Growing demand for high-bandwidth connectivity, supportive government policies for digital infrastructure development.
- Key Drivers in Asia-Pacific: Rapid economic growth, increasing urbanization, and rising adoption of cloud services.
- Bandwidth Segment Dominance: 'More Than 100 Gbps' segment exhibiting the highest growth, followed by 100 Gbps and 40 Gbps.
Optical Wavelength Services Market Product Landscape
The Optical Wavelength Services market offers a range of products catering to diverse bandwidth needs. These services range from less than 10 Gbps to over 100 Gbps, each with specific applications and performance metrics. Key features include high reliability, low latency, and scalability. Technological advancements focus on increasing capacity and efficiency, such as the introduction of 400 Gbps wavelength networks. Unique selling propositions often center on network reach, service level agreements, and the provision of managed services.
Key Drivers, Barriers & Challenges in Optical Wavelength Services Market
Key Drivers:
- Growing demand for high-bandwidth applications (cloud, video streaming).
- Technological advancements (higher bandwidth capacities, improved network efficiency).
- Increased investments in fiber optic infrastructure.
Challenges:
- High capital expenditure for infrastructure upgrades.
- Competition from alternative transmission technologies.
- Regulatory hurdles and spectrum allocation complexities.
- Supply chain disruptions impacting equipment availability. This resulted in a xx% increase in equipment costs in 2022.
Emerging Opportunities in Optical Wavelength Services Market
- Expanding into underserved markets (rural areas, emerging economies).
- Development of innovative applications for 5G and IoT.
- Integration with edge computing to reduce latency.
- Growing demand for secure and reliable wavelength services for critical infrastructure.
Growth Accelerators in the Optical Wavelength Services Market Industry
Technological breakthroughs in optical transmission, particularly the development and deployment of coherent optical systems with higher spectral efficiency, are pivotal growth accelerators. Strategic partnerships between network operators and technology providers will also play a vital role in expanding market reach and enhancing service offerings. Market expansion strategies targeting underserved regions and emerging economies will unlock further growth.
Key Players Shaping the Optical Wavelength Services Market Market
- Telia Carrier
- Cox Communications
- Zayo Group Holdings Inc
- EUnetworks Group
- Jaguar Network SAS
- Charter Communications
- Comcast Corporation
- Exascale Limite
- Verizon Communications Inc
- GTT Communications Inc
- Crown Castle Inc
- CarrierBid Communications
- Colt Technology Services Group Limited
- Nokia Corporation
- Lumen Technologies Inc
- Windstream Holdings Inc
- AT&T Inc
- T-Mobile US Inc
Notable Milestones in Optical Wavelength Services Market Sector
- January 2023: Lumen Technologies launched 400 Gbps wavelength networks in 70 US markets, covering 240 data centers.
- October 2022: LOGIX Fiber Networks and Ciena launched joint 100G wavelength services for enterprise and carrier customers.
In-Depth Optical Wavelength Services Market Market Outlook
The Optical Wavelength Services market is poised for sustained growth driven by technological innovation, increasing demand for high-bandwidth applications, and expansion into new markets. Strategic partnerships and investments in infrastructure development will further fuel market expansion. Opportunities abound for companies that can offer innovative solutions, superior service quality, and cost-effective options. The market is expected to witness substantial growth, with significant potential for new entrants and existing players alike.
Optical Wavelength Services Market Segmentation
-
1. Bandwidth
- 1.1. Less than 10 Gbps
- 1.2. 40 Gbps
- 1.3. 100 Gbps
- 1.4. More Than 100 Gbps
Optical Wavelength Services Market Segmentation By Geography
- 1. North America
- 2. Europe
- 3. Asia Pacific
- 4. Rest of the World
Optical Wavelength Services Market REPORT HIGHLIGHTS
| Aspects | Details |
|---|---|
| Study Period | 2019-2033 |
| Base Year | 2024 |
| Estimated Year | 2025 |
| Forecast Period | 2025-2033 |
| Historical Period | 2019-2024 |
| Growth Rate | CAGR of 11.71% from 2019-2033 |
| Segmentation |
|
Table of Contents
- 1. Introduction
- 1.1. Research Scope
- 1.2. Market Segmentation
- 1.3. Research Methodology
- 1.4. Definitions and Assumptions
- 2. Executive Summary
- 2.1. Introduction
- 3. Market Dynamics
- 3.1. Introduction
- 3.2. Market Drivers
- 3.2.1. Growing Demand for the Internet; Accelerated Bandwidth-intensive Applications
- 3.3. Market Restrains
- 3.3.1. Limited Availability of Incremental Bandwidth; Increasing Demand for Virtual Connectivity
- 3.4. Market Trends
- 3.4.1. Less than 10 Gbps Bandwidth Segment is Expected to Hold Significant Market Share
- 4. Market Factor Analysis
- 4.1. Porters Five Forces
- 4.2. Supply/Value Chain
- 4.3. PESTEL analysis
- 4.4. Market Entropy
- 4.5. Patent/Trademark Analysis
- 5. Global Optical Wavelength Services Market Analysis, Insights and Forecast, 2019-2031
- 5.1. Market Analysis, Insights and Forecast - by Bandwidth
- 5.1.1. Less than 10 Gbps
- 5.1.2. 40 Gbps
- 5.1.3. 100 Gbps
- 5.1.4. More Than 100 Gbps
- 5.2. Market Analysis, Insights and Forecast - by Region
- 5.2.1. North America
- 5.2.2. Europe
- 5.2.3. Asia Pacific
- 5.2.4. Rest of the World
- 5.1. Market Analysis, Insights and Forecast - by Bandwidth
- 6. North America Optical Wavelength Services Market Analysis, Insights and Forecast, 2019-2031
- 6.1. Market Analysis, Insights and Forecast - by Bandwidth
- 6.1.1. Less than 10 Gbps
- 6.1.2. 40 Gbps
- 6.1.3. 100 Gbps
- 6.1.4. More Than 100 Gbps
- 6.1. Market Analysis, Insights and Forecast - by Bandwidth
- 7. Europe Optical Wavelength Services Market Analysis, Insights and Forecast, 2019-2031
- 7.1. Market Analysis, Insights and Forecast - by Bandwidth
- 7.1.1. Less than 10 Gbps
- 7.1.2. 40 Gbps
- 7.1.3. 100 Gbps
- 7.1.4. More Than 100 Gbps
- 7.1. Market Analysis, Insights and Forecast - by Bandwidth
- 8. Asia Pacific Optical Wavelength Services Market Analysis, Insights and Forecast, 2019-2031
- 8.1. Market Analysis, Insights and Forecast - by Bandwidth
- 8.1.1. Less than 10 Gbps
- 8.1.2. 40 Gbps
- 8.1.3. 100 Gbps
- 8.1.4. More Than 100 Gbps
- 8.1. Market Analysis, Insights and Forecast - by Bandwidth
- 9. Rest of the World Optical Wavelength Services Market Analysis, Insights and Forecast, 2019-2031
- 9.1. Market Analysis, Insights and Forecast - by Bandwidth
- 9.1.1. Less than 10 Gbps
- 9.1.2. 40 Gbps
- 9.1.3. 100 Gbps
- 9.1.4. More Than 100 Gbps
- 9.1. Market Analysis, Insights and Forecast - by Bandwidth
- 10. North America Optical Wavelength Services Market Analysis, Insights and Forecast, 2019-2031
- 10.1. Market Analysis, Insights and Forecast - By Country/Sub-region
- 10.1.1.
- 11. Europe Optical Wavelength Services Market Analysis, Insights and Forecast, 2019-2031
- 11.1. Market Analysis, Insights and Forecast - By Country/Sub-region
- 11.1.1.
- 12. Asia Pacific Optical Wavelength Services Market Analysis, Insights and Forecast, 2019-2031
- 12.1. Market Analysis, Insights and Forecast - By Country/Sub-region
- 12.1.1.
- 13. Rest of the World Optical Wavelength Services Market Analysis, Insights and Forecast, 2019-2031
- 13.1. Market Analysis, Insights and Forecast - By Country/Sub-region
- 13.1.1.
- 14. Competitive Analysis
- 14.1. Global Market Share Analysis 2024
- 14.2. Company Profiles
- 14.2.1 Telia Carrier
- 14.2.1.1. Overview
- 14.2.1.2. Products
- 14.2.1.3. SWOT Analysis
- 14.2.1.4. Recent Developments
- 14.2.1.5. Financials (Based on Availability)
- 14.2.2 Cox Communications
- 14.2.2.1. Overview
- 14.2.2.2. Products
- 14.2.2.3. SWOT Analysis
- 14.2.2.4. Recent Developments
- 14.2.2.5. Financials (Based on Availability)
- 14.2.3 Zayo Group Holdings Inc
- 14.2.3.1. Overview
- 14.2.3.2. Products
- 14.2.3.3. SWOT Analysis
- 14.2.3.4. Recent Developments
- 14.2.3.5. Financials (Based on Availability)
- 14.2.4 EUnetworks Group
- 14.2.4.1. Overview
- 14.2.4.2. Products
- 14.2.4.3. SWOT Analysis
- 14.2.4.4. Recent Developments
- 14.2.4.5. Financials (Based on Availability)
- 14.2.5 Jaguar Network SAS
- 14.2.5.1. Overview
- 14.2.5.2. Products
- 14.2.5.3. SWOT Analysis
- 14.2.5.4. Recent Developments
- 14.2.5.5. Financials (Based on Availability)
- 14.2.6 Charter Communications
- 14.2.6.1. Overview
- 14.2.6.2. Products
- 14.2.6.3. SWOT Analysis
- 14.2.6.4. Recent Developments
- 14.2.6.5. Financials (Based on Availability)
- 14.2.7 Comcast Corporation
- 14.2.7.1. Overview
- 14.2.7.2. Products
- 14.2.7.3. SWOT Analysis
- 14.2.7.4. Recent Developments
- 14.2.7.5. Financials (Based on Availability)
- 14.2.8 Exascale Limite
- 14.2.8.1. Overview
- 14.2.8.2. Products
- 14.2.8.3. SWOT Analysis
- 14.2.8.4. Recent Developments
- 14.2.8.5. Financials (Based on Availability)
- 14.2.9 Verizon Communications Inc
- 14.2.9.1. Overview
- 14.2.9.2. Products
- 14.2.9.3. SWOT Analysis
- 14.2.9.4. Recent Developments
- 14.2.9.5. Financials (Based on Availability)
- 14.2.10 GTT Communications Inc
- 14.2.10.1. Overview
- 14.2.10.2. Products
- 14.2.10.3. SWOT Analysis
- 14.2.10.4. Recent Developments
- 14.2.10.5. Financials (Based on Availability)
- 14.2.11 Crown Castle Inc
- 14.2.11.1. Overview
- 14.2.11.2. Products
- 14.2.11.3. SWOT Analysis
- 14.2.11.4. Recent Developments
- 14.2.11.5. Financials (Based on Availability)
- 14.2.12 CarrierBid Communications
- 14.2.12.1. Overview
- 14.2.12.2. Products
- 14.2.12.3. SWOT Analysis
- 14.2.12.4. Recent Developments
- 14.2.12.5. Financials (Based on Availability)
- 14.2.13 Colt Technology Services Group Limited
- 14.2.13.1. Overview
- 14.2.13.2. Products
- 14.2.13.3. SWOT Analysis
- 14.2.13.4. Recent Developments
- 14.2.13.5. Financials (Based on Availability)
- 14.2.14 Nokia Corporation
- 14.2.14.1. Overview
- 14.2.14.2. Products
- 14.2.14.3. SWOT Analysis
- 14.2.14.4. Recent Developments
- 14.2.14.5. Financials (Based on Availability)
- 14.2.15 Lumen Technologies Inc
- 14.2.15.1. Overview
- 14.2.15.2. Products
- 14.2.15.3. SWOT Analysis
- 14.2.15.4. Recent Developments
- 14.2.15.5. Financials (Based on Availability)
- 14.2.16 Windstream Holdings Inc
- 14.2.16.1. Overview
- 14.2.16.2. Products
- 14.2.16.3. SWOT Analysis
- 14.2.16.4. Recent Developments
- 14.2.16.5. Financials (Based on Availability)
- 14.2.17 AT&T Inc
- 14.2.17.1. Overview
- 14.2.17.2. Products
- 14.2.17.3. SWOT Analysis
- 14.2.17.4. Recent Developments
- 14.2.17.5. Financials (Based on Availability)
- 14.2.18 T-Mobile US Inc
- 14.2.18.1. Overview
- 14.2.18.2. Products
- 14.2.18.3. SWOT Analysis
- 14.2.18.4. Recent Developments
- 14.2.18.5. Financials (Based on Availability)
- 14.2.1 Telia Carrier
List of Figures
- Figure 1: Global Optical Wavelength Services Market Revenue Breakdown (Million, %) by Region 2024 & 2032
- Figure 2: North America Optical Wavelength Services Market Revenue (Million), by Country 2024 & 2032
- Figure 3: North America Optical Wavelength Services Market Revenue Share (%), by Country 2024 & 2032
- Figure 4: Europe Optical Wavelength Services Market Revenue (Million), by Country 2024 & 2032
- Figure 5: Europe Optical Wavelength Services Market Revenue Share (%), by Country 2024 & 2032
- Figure 6: Asia Pacific Optical Wavelength Services Market Revenue (Million), by Country 2024 & 2032
- Figure 7: Asia Pacific Optical Wavelength Services Market Revenue Share (%), by Country 2024 & 2032
- Figure 8: Rest of the World Optical Wavelength Services Market Revenue (Million), by Country 2024 & 2032
- Figure 9: Rest of the World Optical Wavelength Services Market Revenue Share (%), by Country 2024 & 2032
- Figure 10: North America Optical Wavelength Services Market Revenue (Million), by Bandwidth 2024 & 2032
- Figure 11: North America Optical Wavelength Services Market Revenue Share (%), by Bandwidth 2024 & 2032
- Figure 12: North America Optical Wavelength Services Market Revenue (Million), by Country 2024 & 2032
- Figure 13: North America Optical Wavelength Services Market Revenue Share (%), by Country 2024 & 2032
- Figure 14: Europe Optical Wavelength Services Market Revenue (Million), by Bandwidth 2024 & 2032
- Figure 15: Europe Optical Wavelength Services Market Revenue Share (%), by Bandwidth 2024 & 2032
- Figure 16: Europe Optical Wavelength Services Market Revenue (Million), by Country 2024 & 2032
- Figure 17: Europe Optical Wavelength Services Market Revenue Share (%), by Country 2024 & 2032
- Figure 18: Asia Pacific Optical Wavelength Services Market Revenue (Million), by Bandwidth 2024 & 2032
- Figure 19: Asia Pacific Optical Wavelength Services Market Revenue Share (%), by Bandwidth 2024 & 2032
- Figure 20: Asia Pacific Optical Wavelength Services Market Revenue (Million), by Country 2024 & 2032
- Figure 21: Asia Pacific Optical Wavelength Services Market Revenue Share (%), by Country 2024 & 2032
- Figure 22: Rest of the World Optical Wavelength Services Market Revenue (Million), by Bandwidth 2024 & 2032
- Figure 23: Rest of the World Optical Wavelength Services Market Revenue Share (%), by Bandwidth 2024 & 2032
- Figure 24: Rest of the World Optical Wavelength Services Market Revenue (Million), by Country 2024 & 2032
- Figure 25: Rest of the World Optical Wavelength Services Market Revenue Share (%), by Country 2024 & 2032
List of Tables
- Table 1: Global Optical Wavelength Services Market Revenue Million Forecast, by Region 2019 & 2032
- Table 2: Global Optical Wavelength Services Market Revenue Million Forecast, by Bandwidth 2019 & 2032
- Table 3: Global Optical Wavelength Services Market Revenue Million Forecast, by Region 2019 & 2032
- Table 4: Global Optical Wavelength Services Market Revenue Million Forecast, by Country 2019 & 2032
- Table 5: Optical Wavelength Services Market Revenue (Million) Forecast, by Application 2019 & 2032
- Table 6: Global Optical Wavelength Services Market Revenue Million Forecast, by Country 2019 & 2032
- Table 7: Optical Wavelength Services Market Revenue (Million) Forecast, by Application 2019 & 2032
- Table 8: Global Optical Wavelength Services Market Revenue Million Forecast, by Country 2019 & 2032
- Table 9: Optical Wavelength Services Market Revenue (Million) Forecast, by Application 2019 & 2032
- Table 10: Global Optical Wavelength Services Market Revenue Million Forecast, by Country 2019 & 2032
- Table 11: Optical Wavelength Services Market Revenue (Million) Forecast, by Application 2019 & 2032
- Table 12: Global Optical Wavelength Services Market Revenue Million Forecast, by Bandwidth 2019 & 2032
- Table 13: Global Optical Wavelength Services Market Revenue Million Forecast, by Country 2019 & 2032
- Table 14: Global Optical Wavelength Services Market Revenue Million Forecast, by Bandwidth 2019 & 2032
- Table 15: Global Optical Wavelength Services Market Revenue Million Forecast, by Country 2019 & 2032
- Table 16: Global Optical Wavelength Services Market Revenue Million Forecast, by Bandwidth 2019 & 2032
- Table 17: Global Optical Wavelength Services Market Revenue Million Forecast, by Country 2019 & 2032
- Table 18: Global Optical Wavelength Services Market Revenue Million Forecast, by Bandwidth 2019 & 2032
- Table 19: Global Optical Wavelength Services Market Revenue Million Forecast, by Country 2019 & 2032
Frequently Asked Questions
1. What is the projected Compound Annual Growth Rate (CAGR) of the Optical Wavelength Services Market?
The projected CAGR is approximately 11.71%.
2. Which companies are prominent players in the Optical Wavelength Services Market?
Key companies in the market include Telia Carrier, Cox Communications, Zayo Group Holdings Inc, EUnetworks Group, Jaguar Network SAS, Charter Communications, Comcast Corporation, Exascale Limite, Verizon Communications Inc, GTT Communications Inc, Crown Castle Inc, CarrierBid Communications, Colt Technology Services Group Limited, Nokia Corporation, Lumen Technologies Inc, Windstream Holdings Inc, AT&T Inc, T-Mobile US Inc.
3. What are the main segments of the Optical Wavelength Services Market?
The market segments include Bandwidth.
4. Can you provide details about the market size?
The market size is estimated to be USD 4.84 Million as of 2022.
5. What are some drivers contributing to market growth?
Growing Demand for the Internet; Accelerated Bandwidth-intensive Applications.
6. What are the notable trends driving market growth?
Less than 10 Gbps Bandwidth Segment is Expected to Hold Significant Market Share.
7. Are there any restraints impacting market growth?
Limited Availability of Incremental Bandwidth; Increasing Demand for Virtual Connectivity.
8. Can you provide examples of recent developments in the market?
January 2023: Lumen Technologies started distributing 400 Gbps wavelength networks in the United States. The company will serve 70 markets across the country, covering 240 data centers with more than 50 TB of 400 G wavelengths. Additionally, Lumen will provide its clients with a self-service tool that allows them to quote, design, and build their wavelengths across Lumen's North American Network.
9. What pricing options are available for accessing the report?
Pricing options include single-user, multi-user, and enterprise licenses priced at USD 4750, USD 5250, and USD 8750 respectively.
10. Is the market size provided in terms of value or volume?
The market size is provided in terms of value, measured in Million.
11. Are there any specific market keywords associated with the report?
Yes, the market keyword associated with the report is "Optical Wavelength Services Market," which aids in identifying and referencing the specific market segment covered.
12. How do I determine which pricing option suits my needs best?
The pricing options vary based on user requirements and access needs. Individual users may opt for single-user licenses, while businesses requiring broader access may choose multi-user or enterprise licenses for cost-effective access to the report.
13. Are there any additional resources or data provided in the Optical Wavelength Services Market report?
While the report offers comprehensive insights, it's advisable to review the specific contents or supplementary materials provided to ascertain if additional resources or data are available.
14. How can I stay updated on further developments or reports in the Optical Wavelength Services Market?
To stay informed about further developments, trends, and reports in the Optical Wavelength Services Market, consider subscribing to industry newsletters, following relevant companies and organizations, or regularly checking reputable industry news sources and publications.
Methodology
Step 1 - Identification of Relevant Samples Size from Population Database


Step 2 - Approaches for Defining Global Market Size (Value, Volume* & Price*)

Note*: In applicable scenarios
Step 3 - Data Sources
Primary Research
- Web Analytics
- Survey Reports
- Research Institute
- Latest Research Reports
- Opinion Leaders
Secondary Research
- Annual Reports
- White Paper
- Latest Press Release
- Industry Association
- Paid Database
- Investor Presentations

Step 4 - Data Triangulation
Involves using different sources of information in order to increase the validity of a study
These sources are likely to be stakeholders in a program - participants, other researchers, program staff, other community members, and so on.
Then we put all data in single framework & apply various statistical tools to find out the dynamic on the market.
During the analysis stage, feedback from the stakeholder groups would be compared to determine areas of agreement as well as areas of divergence


