
Key Insights
The Optical Fiber Composite Phase Conductor (OPPC) market is poised for robust expansion, projected to reach a substantial market size of approximately USD 8,500 million by 2033. This growth is underpinned by a compelling Compound Annual Growth Rate (CAGR) of around 6.5% from the base year of 2025. The primary impetus for this surge is the escalating global demand for high-speed data transmission and the critical need for enhanced grid reliability and efficiency. As power grids worldwide undergo modernization and smart grid initiatives gain traction, the integration of OPPC cables becomes increasingly vital. These cables offer a dual advantage: they serve as essential phase conductors in power transmission while simultaneously housing optical fibers for data communication. This integrated solution significantly reduces the need for separate communication infrastructure, leading to cost savings, streamlined installation, and a smaller environmental footprint. The continuous expansion of telecommunications networks, the burgeoning Internet of Things (IoT) ecosystem, and the increasing deployment of renewable energy sources further fuel the adoption of OPPC, which facilitates the seamless transfer of both power and data across vast distances.
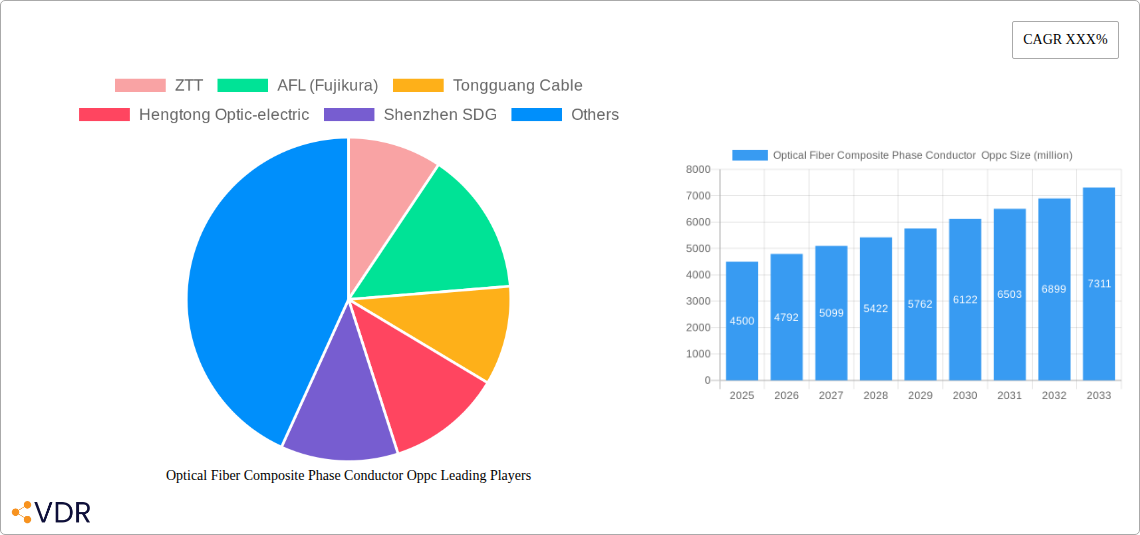
Optical Fiber Composite Phase Conductor Oppc Market Size (In Billion)

The OPPC market is characterized by significant segmentation, catering to diverse application needs and technological advancements. Key applications include power transmission and distribution, telecommunications backhaul, and smart grid infrastructure development. Within these applications, different types of OPPC are gaining prominence, driven by factors such as fiber count, conductor material, and specialized protective coatings designed for harsh environmental conditions. While the market is broadly driven by technological integration and infrastructure upgrades, certain restraints, such as initial installation costs and the need for specialized expertise, could temper the pace of adoption in some regions. However, the long-term benefits of reduced operational expenditure, enhanced data carrying capacity, and improved grid resilience are expected to outweigh these challenges. Leading companies such as ZTT, AFL (Fujikura), Tongguang Cable, Hengtong Optic-electric, Shenzhen SDG, Prysmian Group, and Furukawa are at the forefront of innovation, investing in research and development to offer more advanced and cost-effective OPPC solutions. The competitive landscape suggests a strong focus on product innovation, strategic partnerships, and market expansion to capture a significant share of this rapidly growing sector.

Optical Fiber Composite Phase Conductor Oppc Company Market Share
This comprehensive report offers an in-depth analysis of the Optical Fiber Composite Phase Conductor (OPPC) market, providing critical insights into its dynamics, growth trajectory, and future outlook. Spanning from 2019 to 2033, with a base year of 2025 and a forecast period of 2025-2033, this report is an essential resource for stakeholders seeking to understand the evolving landscape of power transmission and telecommunication infrastructure. We delve into the market's structure, key growth drivers, regional dominance, product innovations, and the strategies of leading companies. This report also explores parent and child market interdependencies, offering a holistic view of the OPPC ecosystem.
Optical Fiber Composite Phase Conductor Oppc Market Dynamics & Structure
The Optical Fiber Composite Phase Conductor (OPPC) market is characterized by a moderately concentrated structure, with a few key global players dominating production and innovation. Technological advancements in optical fiber integration and conductor design are the primary drivers of market expansion. These innovations are fueled by the increasing demand for high-speed data transmission alongside robust power delivery, particularly in smart grid initiatives and the expansion of renewable energy infrastructure. Regulatory frameworks, largely focused on grid modernization, network security, and environmental sustainability, are shaping product development and deployment strategies. While direct competitive product substitutes are limited, advancements in alternative communication technologies and traditional conductor upgrades present indirect competition. End-user demographics are shifting towards utility companies, telecommunication providers, and industrial conglomerates seeking integrated solutions for enhanced grid management and data communication. Mergers and acquisitions (M&A) are a notable trend, with companies consolidating to enhance R&D capabilities, expand geographical reach, and secure market share. For instance, the market has witnessed several strategic acquisitions by major players aiming to bolster their portfolios in the OPPC segment. Innovation barriers include the high capital investment required for advanced manufacturing and the need for specialized installation expertise. The market's value is projected to reach approximately $2,200 million by 2025, with a notable portion attributed to investments in critical infrastructure upgrades.
Optical Fiber Composite Phase Conductor Oppc Growth Trends & Insights
The Optical Fiber Composite Phase Conductor (OPPC) market is experiencing robust growth, driven by the escalating global demand for integrated power and communication solutions. The market size is estimated to have grown from approximately $1,500 million in 2019 to an estimated $2,200 million in 2025. This expansion is underpinned by a compound annual growth rate (CAGR) of approximately 6.5% during the historical period and is projected to maintain a strong CAGR of around 7.2% during the forecast period of 2025–2033. Adoption rates are accelerating as utilities worldwide recognize the dual benefits of OPPC in optimizing grid performance and enabling high-speed data transmission without the need for separate fiber optic cables. Technological disruptions are primarily centered around enhancing the durability, thermal performance, and data-carrying capacity of OPPC. Innovations include advanced optical fiber coatings, improved conductor materials for greater conductivity and strength, and streamlined integration processes. Consumer behavior shifts are evident in the increasing preference for single-solution infrastructure upgrades that offer both power reliability and advanced communication capabilities, reducing installation complexity and long-term maintenance costs. The penetration of OPPC technology is steadily increasing in developed and emerging economies alike, fueled by government initiatives promoting smart grids and digital transformation. Market penetration, which stood at approximately 18% in 2019, is expected to reach over 35% by 2033. Furthermore, the increasing investments in smart metering, real-time grid monitoring, and the deployment of 5G infrastructure are significantly boosting the demand for OPPC. The parent market, encompassing high-voltage power transmission lines, is expanding due to grid modernization efforts, while the child market for integrated communication within these lines is experiencing exponential growth, making OPPC a crucial component in this symbiotic relationship. The estimated market revenue for 2025 is anticipated to be $2,200 million.
Dominant Regions, Countries, or Segments in Optical Fiber Composite Phase Conductor Oppc
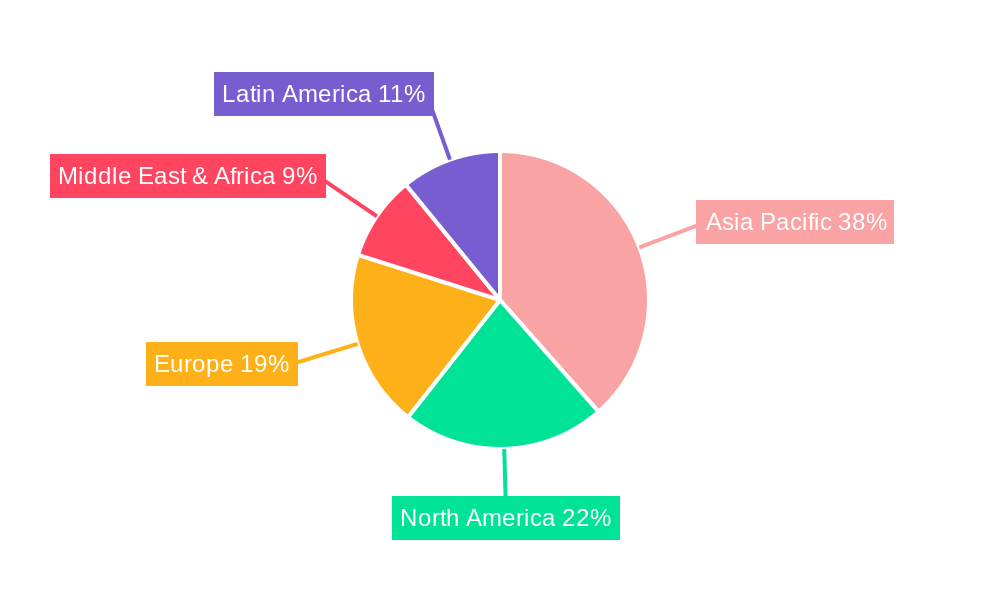
The Asia-Pacific region currently stands as the dominant force in the Optical Fiber Composite Phase Conductor (OPPC) market, driven by a confluence of robust infrastructure development, burgeoning economies, and proactive government investments. Countries like China and India are spearheading this growth, significantly contributing to the global market share. The primary driver for OPPC adoption in this region stems from the Application: Power Transmission and Distribution, where massive investments are being channeled into modernizing aging grids and expanding electricity access to remote areas. This segment accounted for an estimated 75% of the regional market share in 2025. The Type: ACSR/OPPC (Aluminum Conductor Steel Reinforced / Optical Fiber Composite Phase Conductor) is the most prevalent configuration due to its established reliability and cost-effectiveness for high-voltage applications.
Key drivers for dominance in Asia-Pacific include:
- Economic Policies & Infrastructure Spending: Governments in countries like China have implemented ambitious Five-Year Plans that heavily emphasize infrastructure development, including the expansion and upgrading of the national power grid. These policies directly translate into substantial demand for OPPC.
- Rapid Urbanization and Industrialization: The continuous growth of urban centers and industrial hubs necessitates a more robust and intelligent power infrastructure, making OPPC an ideal solution for reliable power delivery and real-time grid monitoring.
- Smart Grid Initiatives: Proactive adoption of smart grid technologies, including advanced metering infrastructure (AMI) and supervisory control and data acquisition (SCADA) systems, fuels the demand for OPPC's integrated data transmission capabilities.
- Growth Potential: The sheer scale of ongoing projects and the potential for further electrification and digitalization in countries like India and Southeast Asian nations present immense growth opportunities, positioning Asia-Pacific to maintain its leadership for the foreseeable future. The estimated market share for this region is expected to be around 45% of the global OPPC market by 2025.
Optical Fiber Composite Phase Conductor Oppc Product Landscape
The Optical Fiber Composite Phase Conductor (OPPC) product landscape is characterized by continuous innovation focused on enhancing performance and expanding applications. Manufacturers are developing OPPC solutions with increased tensile strength, superior corrosion resistance, and improved thermal management capabilities to withstand demanding environmental conditions. Innovations include specialized fiber optic buffering technologies for enhanced protection against mechanical stress and environmental factors, as well as advanced conductor stranding techniques for optimized conductivity and reduced electrical resistance. Applications extend beyond traditional power transmission to include grid automation, real-time fault detection, and the integration of renewable energy sources. The unique selling proposition lies in its dual functionality, enabling the simultaneous transmission of electrical power and high-bandwidth data over a single conductor, thereby reducing infrastructure costs and complexity. Technological advancements are also focusing on lightweight designs for easier installation and longer span capabilities.
Key Drivers, Barriers & Challenges in Optical Fiber Composite Phase Conductor Oppc
Key Drivers:
- Demand for Smart Grids: The global push for smart grid modernization, requiring real-time data for efficient monitoring, control, and automation, is the primary catalyst for OPPC adoption.
- Growth of Renewable Energy: The integration of decentralized renewable energy sources necessitates robust and high-bandwidth communication for grid stability, making OPPC indispensable.
- Infrastructure Upgrades: Aging power infrastructure in developed economies requires replacement and upgrading, presenting a significant market opportunity.
- Cost-Effectiveness: The combined functionality of power and communication in a single conductor offers a more economical solution compared to separate installations, especially in new projects.
Barriers & Challenges:
- High Initial Investment: The upfront cost of OPPC and its associated installation equipment can be a deterrent for some utilities, particularly in regions with budget constraints.
- Specialized Installation Expertise: The installation of OPPC requires specialized training and equipment, which may not be readily available in all areas.
- Regulatory Hurdles: While generally supportive, evolving regulations concerning grid interconnection and data security can sometimes pose challenges.
- Supply Chain Disruptions: Global supply chain volatility can impact the availability and cost of raw materials, affecting production timelines and pricing. The impact of supply chain issues is estimated to increase operational costs by up to 5% in specific scenarios.
Emerging Opportunities in Optical Fiber Composite Phase Conductor Oppc
Emerging opportunities in the OPPC market are largely driven by the expansion of digital infrastructure and the increasing demand for high-speed connectivity in underserved areas. The development of "Fiber-to-the-Premises" (FTTP) over existing power lines, leveraging OPPC's communication capabilities, presents a significant untapped market. Furthermore, the integration of OPPC with emerging technologies like artificial intelligence (AI) for predictive maintenance of power grids and the deployment of advanced sensor networks offer new avenues for growth. The evolving consumer preference for seamless connectivity and smart home solutions also indirectly boosts the demand for reliable and high-capacity communication infrastructure facilitated by OPPC. The burgeoning renewable energy sector, particularly offshore wind farms, also presents unique installation opportunities for robust and resilient OPPC solutions.
Growth Accelerators in the Optical Fiber Composite Phase Conductor Oppc Industry
Several factors are acting as growth accelerators for the OPPC industry. Technological breakthroughs in optical fiber technology, leading to higher bandwidth and increased durability, are continuously expanding the conductor's capabilities. Strategic partnerships between power utility companies and telecommunication providers are fostering collaborative projects that showcase the benefits of integrated infrastructure, driving wider adoption. Market expansion strategies, particularly in emerging economies where grid modernization and digitalization are key priorities, are unlocking significant growth potential. The increasing governmental focus on energy security and digital sovereignty is also propelling investments in domestic manufacturing and deployment of OPPC, further accelerating industry growth.
Key Players Shaping the Optical Fiber Composite Phase Conductor Oppc Market
- ZTT
- AFL (Fujikura)
- Tongguang Cable
- Hengtong Optic-electric
- Shenzhen SDG
- Prysmian Group
- Furukawa
- LS Cable & System
- Jiangsu Hongtu
- Taihan
- Sichuan Huiyuan
- Wuhan Horizon Technology
- Henan Qingzhou Group
Notable Milestones in Optical Fiber Composite Phase Conductor Oppc Sector
- 2019: Increased global investment in smart grid technologies and renewable energy integration.
- 2020: Major cable manufacturers expand production capacity to meet rising demand for high-performance conductors.
- 2021: Advancement in fiber optic technology leads to higher data transmission rates achievable with OPPC.
- 2022: Growing emphasis on grid resilience and cybersecurity spurs demand for integrated communication solutions.
- 2023: Several key players announce strategic partnerships to develop next-generation OPPC for 5G infrastructure deployment.
- 2024: Introduction of more environmentally friendly manufacturing processes for OPPC production.
In-Depth Optical Fiber Composite Phase Conductor Oppc Market Outlook
The future outlook for the Optical Fiber Composite Phase Conductor (OPPC) market is exceptionally bright, driven by the persistent global imperative for smarter, more resilient, and interconnected infrastructure. Growth accelerators such as continuous technological innovation in fiber optics and conductor materials, coupled with strategic alliances between key industry players, will continue to propel market expansion. The increasing penetration of renewable energy sources and the widespread adoption of smart grid technologies across both developed and developing economies will ensure sustained demand. Furthermore, the evolving telecommunications landscape, with the rollout of 5G and beyond, will further necessitate the high-capacity data transmission capabilities offered by OPPC. Strategic opportunities lie in expanding into nascent markets and developing specialized OPPC solutions for niche applications, such as industrial automation and smart city projects. The market is projected to witness sustained growth, solidifying OPPC's position as a critical component in the global energy and telecommunications ecosystem.
Optical Fiber Composite Phase Conductor Oppc Segmentation
-
1. Application
- 1.1. undefined
-
2. Type
- 2.1. undefined
Optical Fiber Composite Phase Conductor Oppc Segmentation By Geography
- 1. undefined
- 2. undefined
- 3. undefined
- 4. undefined
- 5. undefined
Optical Fiber Composite Phase Conductor Oppc Regional Market Share
Geographic Coverage of Optical Fiber Composite Phase Conductor Oppc
Optical Fiber Composite Phase Conductor Oppc REPORT HIGHLIGHTS
| Aspects | Details |
|---|---|
| Study Period | 2020-2034 |
| Base Year | 2025 |
| Estimated Year | 2026 |
| Forecast Period | 2026-2034 |
| Historical Period | 2020-2025 |
| Growth Rate | CAGR of XXX% from 2020-2034 |
| Segmentation |
|
Table of Contents
- 1. Introduction
- 1.1. Research Scope
- 1.2. Market Segmentation
- 1.3. Research Methodology
- 1.4. Definitions and Assumptions
- 2. Executive Summary
- 2.1. Introduction
- 3. Market Dynamics
- 3.1. Introduction
- 3.2. Market Drivers
- 3.3. Market Restrains
- 3.4. Market Trends
- 4. Market Factor Analysis
- 4.1. Porters Five Forces
- 4.2. Supply/Value Chain
- 4.3. PESTEL analysis
- 4.4. Market Entropy
- 4.5. Patent/Trademark Analysis
- 5. Global Optical Fiber Composite Phase Conductor Oppc Analysis, Insights and Forecast, 2020-2032
- 5.1. Market Analysis, Insights and Forecast - by Application
- 5.1.1.
- 5.2. Market Analysis, Insights and Forecast - by Type
- 5.2.1.
- 5.3. Market Analysis, Insights and Forecast - by Region
- 5.3.1.
- 5.3.2.
- 5.3.3.
- 5.3.4.
- 5.3.5.
- 5.1. Market Analysis, Insights and Forecast - by Application
- 6. undefined Optical Fiber Composite Phase Conductor Oppc Analysis, Insights and Forecast, 2020-2032
- 6.1. Market Analysis, Insights and Forecast - by Application
- 6.1.1.
- 6.2. Market Analysis, Insights and Forecast - by Type
- 6.2.1.
- 6.1. Market Analysis, Insights and Forecast - by Application
- 7. undefined Optical Fiber Composite Phase Conductor Oppc Analysis, Insights and Forecast, 2020-2032
- 7.1. Market Analysis, Insights and Forecast - by Application
- 7.1.1.
- 7.2. Market Analysis, Insights and Forecast - by Type
- 7.2.1.
- 7.1. Market Analysis, Insights and Forecast - by Application
- 8. undefined Optical Fiber Composite Phase Conductor Oppc Analysis, Insights and Forecast, 2020-2032
- 8.1. Market Analysis, Insights and Forecast - by Application
- 8.1.1.
- 8.2. Market Analysis, Insights and Forecast - by Type
- 8.2.1.
- 8.1. Market Analysis, Insights and Forecast - by Application
- 9. undefined Optical Fiber Composite Phase Conductor Oppc Analysis, Insights and Forecast, 2020-2032
- 9.1. Market Analysis, Insights and Forecast - by Application
- 9.1.1.
- 9.2. Market Analysis, Insights and Forecast - by Type
- 9.2.1.
- 9.1. Market Analysis, Insights and Forecast - by Application
- 10. undefined Optical Fiber Composite Phase Conductor Oppc Analysis, Insights and Forecast, 2020-2032
- 10.1. Market Analysis, Insights and Forecast - by Application
- 10.1.1.
- 10.2. Market Analysis, Insights and Forecast - by Type
- 10.2.1.
- 10.1. Market Analysis, Insights and Forecast - by Application
- 11. Competitive Analysis
- 11.1. Global Market Share Analysis 2025
- 11.2. Company Profiles
- 11.2.1 ZTT
- 11.2.1.1. Overview
- 11.2.1.2. Products
- 11.2.1.3. SWOT Analysis
- 11.2.1.4. Recent Developments
- 11.2.1.5. Financials (Based on Availability)
- 11.2.2 AFL (Fujikura)
- 11.2.2.1. Overview
- 11.2.2.2. Products
- 11.2.2.3. SWOT Analysis
- 11.2.2.4. Recent Developments
- 11.2.2.5. Financials (Based on Availability)
- 11.2.3 Tongguang Cable
- 11.2.3.1. Overview
- 11.2.3.2. Products
- 11.2.3.3. SWOT Analysis
- 11.2.3.4. Recent Developments
- 11.2.3.5. Financials (Based on Availability)
- 11.2.4 Hengtong Optic-electric
- 11.2.4.1. Overview
- 11.2.4.2. Products
- 11.2.4.3. SWOT Analysis
- 11.2.4.4. Recent Developments
- 11.2.4.5. Financials (Based on Availability)
- 11.2.5 Shenzhen SDG
- 11.2.5.1. Overview
- 11.2.5.2. Products
- 11.2.5.3. SWOT Analysis
- 11.2.5.4. Recent Developments
- 11.2.5.5. Financials (Based on Availability)
- 11.2.6 Prysmian Group
- 11.2.6.1. Overview
- 11.2.6.2. Products
- 11.2.6.3. SWOT Analysis
- 11.2.6.4. Recent Developments
- 11.2.6.5. Financials (Based on Availability)
- 11.2.7 Furukawa
- 11.2.7.1. Overview
- 11.2.7.2. Products
- 11.2.7.3. SWOT Analysis
- 11.2.7.4. Recent Developments
- 11.2.7.5. Financials (Based on Availability)
- 11.2.8 LS Cable & System
- 11.2.8.1. Overview
- 11.2.8.2. Products
- 11.2.8.3. SWOT Analysis
- 11.2.8.4. Recent Developments
- 11.2.8.5. Financials (Based on Availability)
- 11.2.9 Jiangsu Hongtu
- 11.2.9.1. Overview
- 11.2.9.2. Products
- 11.2.9.3. SWOT Analysis
- 11.2.9.4. Recent Developments
- 11.2.9.5. Financials (Based on Availability)
- 11.2.10 Taihan
- 11.2.10.1. Overview
- 11.2.10.2. Products
- 11.2.10.3. SWOT Analysis
- 11.2.10.4. Recent Developments
- 11.2.10.5. Financials (Based on Availability)
- 11.2.11 Sichuan Huiyuan
- 11.2.11.1. Overview
- 11.2.11.2. Products
- 11.2.11.3. SWOT Analysis
- 11.2.11.4. Recent Developments
- 11.2.11.5. Financials (Based on Availability)
- 11.2.12 Wuhan Horizon Technology
- 11.2.12.1. Overview
- 11.2.12.2. Products
- 11.2.12.3. SWOT Analysis
- 11.2.12.4. Recent Developments
- 11.2.12.5. Financials (Based on Availability)
- 11.2.13 Henan Qingzhou Group
- 11.2.13.1. Overview
- 11.2.13.2. Products
- 11.2.13.3. SWOT Analysis
- 11.2.13.4. Recent Developments
- 11.2.13.5. Financials (Based on Availability)
- 11.2.1 ZTT
List of Figures
- Figure 1: Global Optical Fiber Composite Phase Conductor Oppc Revenue Breakdown (million, %) by Region 2025 & 2033
- Figure 2: Global Optical Fiber Composite Phase Conductor Oppc Volume Breakdown (K, %) by Region 2025 & 2033
- Figure 3: undefined Optical Fiber Composite Phase Conductor Oppc Revenue (million), by Application 2025 & 2033
- Figure 4: undefined Optical Fiber Composite Phase Conductor Oppc Volume (K), by Application 2025 & 2033
- Figure 5: undefined Optical Fiber Composite Phase Conductor Oppc Revenue Share (%), by Application 2025 & 2033
- Figure 6: undefined Optical Fiber Composite Phase Conductor Oppc Volume Share (%), by Application 2025 & 2033
- Figure 7: undefined Optical Fiber Composite Phase Conductor Oppc Revenue (million), by Type 2025 & 2033
- Figure 8: undefined Optical Fiber Composite Phase Conductor Oppc Volume (K), by Type 2025 & 2033
- Figure 9: undefined Optical Fiber Composite Phase Conductor Oppc Revenue Share (%), by Type 2025 & 2033
- Figure 10: undefined Optical Fiber Composite Phase Conductor Oppc Volume Share (%), by Type 2025 & 2033
- Figure 11: undefined Optical Fiber Composite Phase Conductor Oppc Revenue (million), by Country 2025 & 2033
- Figure 12: undefined Optical Fiber Composite Phase Conductor Oppc Volume (K), by Country 2025 & 2033
- Figure 13: undefined Optical Fiber Composite Phase Conductor Oppc Revenue Share (%), by Country 2025 & 2033
- Figure 14: undefined Optical Fiber Composite Phase Conductor Oppc Volume Share (%), by Country 2025 & 2033
- Figure 15: undefined Optical Fiber Composite Phase Conductor Oppc Revenue (million), by Application 2025 & 2033
- Figure 16: undefined Optical Fiber Composite Phase Conductor Oppc Volume (K), by Application 2025 & 2033
- Figure 17: undefined Optical Fiber Composite Phase Conductor Oppc Revenue Share (%), by Application 2025 & 2033
- Figure 18: undefined Optical Fiber Composite Phase Conductor Oppc Volume Share (%), by Application 2025 & 2033
- Figure 19: undefined Optical Fiber Composite Phase Conductor Oppc Revenue (million), by Type 2025 & 2033
- Figure 20: undefined Optical Fiber Composite Phase Conductor Oppc Volume (K), by Type 2025 & 2033
- Figure 21: undefined Optical Fiber Composite Phase Conductor Oppc Revenue Share (%), by Type 2025 & 2033
- Figure 22: undefined Optical Fiber Composite Phase Conductor Oppc Volume Share (%), by Type 2025 & 2033
- Figure 23: undefined Optical Fiber Composite Phase Conductor Oppc Revenue (million), by Country 2025 & 2033
- Figure 24: undefined Optical Fiber Composite Phase Conductor Oppc Volume (K), by Country 2025 & 2033
- Figure 25: undefined Optical Fiber Composite Phase Conductor Oppc Revenue Share (%), by Country 2025 & 2033
- Figure 26: undefined Optical Fiber Composite Phase Conductor Oppc Volume Share (%), by Country 2025 & 2033
- Figure 27: undefined Optical Fiber Composite Phase Conductor Oppc Revenue (million), by Application 2025 & 2033
- Figure 28: undefined Optical Fiber Composite Phase Conductor Oppc Volume (K), by Application 2025 & 2033
- Figure 29: undefined Optical Fiber Composite Phase Conductor Oppc Revenue Share (%), by Application 2025 & 2033
- Figure 30: undefined Optical Fiber Composite Phase Conductor Oppc Volume Share (%), by Application 2025 & 2033
- Figure 31: undefined Optical Fiber Composite Phase Conductor Oppc Revenue (million), by Type 2025 & 2033
- Figure 32: undefined Optical Fiber Composite Phase Conductor Oppc Volume (K), by Type 2025 & 2033
- Figure 33: undefined Optical Fiber Composite Phase Conductor Oppc Revenue Share (%), by Type 2025 & 2033
- Figure 34: undefined Optical Fiber Composite Phase Conductor Oppc Volume Share (%), by Type 2025 & 2033
- Figure 35: undefined Optical Fiber Composite Phase Conductor Oppc Revenue (million), by Country 2025 & 2033
- Figure 36: undefined Optical Fiber Composite Phase Conductor Oppc Volume (K), by Country 2025 & 2033
- Figure 37: undefined Optical Fiber Composite Phase Conductor Oppc Revenue Share (%), by Country 2025 & 2033
- Figure 38: undefined Optical Fiber Composite Phase Conductor Oppc Volume Share (%), by Country 2025 & 2033
- Figure 39: undefined Optical Fiber Composite Phase Conductor Oppc Revenue (million), by Application 2025 & 2033
- Figure 40: undefined Optical Fiber Composite Phase Conductor Oppc Volume (K), by Application 2025 & 2033
- Figure 41: undefined Optical Fiber Composite Phase Conductor Oppc Revenue Share (%), by Application 2025 & 2033
- Figure 42: undefined Optical Fiber Composite Phase Conductor Oppc Volume Share (%), by Application 2025 & 2033
- Figure 43: undefined Optical Fiber Composite Phase Conductor Oppc Revenue (million), by Type 2025 & 2033
- Figure 44: undefined Optical Fiber Composite Phase Conductor Oppc Volume (K), by Type 2025 & 2033
- Figure 45: undefined Optical Fiber Composite Phase Conductor Oppc Revenue Share (%), by Type 2025 & 2033
- Figure 46: undefined Optical Fiber Composite Phase Conductor Oppc Volume Share (%), by Type 2025 & 2033
- Figure 47: undefined Optical Fiber Composite Phase Conductor Oppc Revenue (million), by Country 2025 & 2033
- Figure 48: undefined Optical Fiber Composite Phase Conductor Oppc Volume (K), by Country 2025 & 2033
- Figure 49: undefined Optical Fiber Composite Phase Conductor Oppc Revenue Share (%), by Country 2025 & 2033
- Figure 50: undefined Optical Fiber Composite Phase Conductor Oppc Volume Share (%), by Country 2025 & 2033
- Figure 51: undefined Optical Fiber Composite Phase Conductor Oppc Revenue (million), by Application 2025 & 2033
- Figure 52: undefined Optical Fiber Composite Phase Conductor Oppc Volume (K), by Application 2025 & 2033
- Figure 53: undefined Optical Fiber Composite Phase Conductor Oppc Revenue Share (%), by Application 2025 & 2033
- Figure 54: undefined Optical Fiber Composite Phase Conductor Oppc Volume Share (%), by Application 2025 & 2033
- Figure 55: undefined Optical Fiber Composite Phase Conductor Oppc Revenue (million), by Type 2025 & 2033
- Figure 56: undefined Optical Fiber Composite Phase Conductor Oppc Volume (K), by Type 2025 & 2033
- Figure 57: undefined Optical Fiber Composite Phase Conductor Oppc Revenue Share (%), by Type 2025 & 2033
- Figure 58: undefined Optical Fiber Composite Phase Conductor Oppc Volume Share (%), by Type 2025 & 2033
- Figure 59: undefined Optical Fiber Composite Phase Conductor Oppc Revenue (million), by Country 2025 & 2033
- Figure 60: undefined Optical Fiber Composite Phase Conductor Oppc Volume (K), by Country 2025 & 2033
- Figure 61: undefined Optical Fiber Composite Phase Conductor Oppc Revenue Share (%), by Country 2025 & 2033
- Figure 62: undefined Optical Fiber Composite Phase Conductor Oppc Volume Share (%), by Country 2025 & 2033
List of Tables
- Table 1: Global Optical Fiber Composite Phase Conductor Oppc Revenue million Forecast, by Application 2020 & 2033
- Table 2: Global Optical Fiber Composite Phase Conductor Oppc Volume K Forecast, by Application 2020 & 2033
- Table 3: Global Optical Fiber Composite Phase Conductor Oppc Revenue million Forecast, by Type 2020 & 2033
- Table 4: Global Optical Fiber Composite Phase Conductor Oppc Volume K Forecast, by Type 2020 & 2033
- Table 5: Global Optical Fiber Composite Phase Conductor Oppc Revenue million Forecast, by Region 2020 & 2033
- Table 6: Global Optical Fiber Composite Phase Conductor Oppc Volume K Forecast, by Region 2020 & 2033
- Table 7: Global Optical Fiber Composite Phase Conductor Oppc Revenue million Forecast, by Application 2020 & 2033
- Table 8: Global Optical Fiber Composite Phase Conductor Oppc Volume K Forecast, by Application 2020 & 2033
- Table 9: Global Optical Fiber Composite Phase Conductor Oppc Revenue million Forecast, by Type 2020 & 2033
- Table 10: Global Optical Fiber Composite Phase Conductor Oppc Volume K Forecast, by Type 2020 & 2033
- Table 11: Global Optical Fiber Composite Phase Conductor Oppc Revenue million Forecast, by Country 2020 & 2033
- Table 12: Global Optical Fiber Composite Phase Conductor Oppc Volume K Forecast, by Country 2020 & 2033
- Table 13: Global Optical Fiber Composite Phase Conductor Oppc Revenue million Forecast, by Application 2020 & 2033
- Table 14: Global Optical Fiber Composite Phase Conductor Oppc Volume K Forecast, by Application 2020 & 2033
- Table 15: Global Optical Fiber Composite Phase Conductor Oppc Revenue million Forecast, by Type 2020 & 2033
- Table 16: Global Optical Fiber Composite Phase Conductor Oppc Volume K Forecast, by Type 2020 & 2033
- Table 17: Global Optical Fiber Composite Phase Conductor Oppc Revenue million Forecast, by Country 2020 & 2033
- Table 18: Global Optical Fiber Composite Phase Conductor Oppc Volume K Forecast, by Country 2020 & 2033
- Table 19: Global Optical Fiber Composite Phase Conductor Oppc Revenue million Forecast, by Application 2020 & 2033
- Table 20: Global Optical Fiber Composite Phase Conductor Oppc Volume K Forecast, by Application 2020 & 2033
- Table 21: Global Optical Fiber Composite Phase Conductor Oppc Revenue million Forecast, by Type 2020 & 2033
- Table 22: Global Optical Fiber Composite Phase Conductor Oppc Volume K Forecast, by Type 2020 & 2033
- Table 23: Global Optical Fiber Composite Phase Conductor Oppc Revenue million Forecast, by Country 2020 & 2033
- Table 24: Global Optical Fiber Composite Phase Conductor Oppc Volume K Forecast, by Country 2020 & 2033
- Table 25: Global Optical Fiber Composite Phase Conductor Oppc Revenue million Forecast, by Application 2020 & 2033
- Table 26: Global Optical Fiber Composite Phase Conductor Oppc Volume K Forecast, by Application 2020 & 2033
- Table 27: Global Optical Fiber Composite Phase Conductor Oppc Revenue million Forecast, by Type 2020 & 2033
- Table 28: Global Optical Fiber Composite Phase Conductor Oppc Volume K Forecast, by Type 2020 & 2033
- Table 29: Global Optical Fiber Composite Phase Conductor Oppc Revenue million Forecast, by Country 2020 & 2033
- Table 30: Global Optical Fiber Composite Phase Conductor Oppc Volume K Forecast, by Country 2020 & 2033
- Table 31: Global Optical Fiber Composite Phase Conductor Oppc Revenue million Forecast, by Application 2020 & 2033
- Table 32: Global Optical Fiber Composite Phase Conductor Oppc Volume K Forecast, by Application 2020 & 2033
- Table 33: Global Optical Fiber Composite Phase Conductor Oppc Revenue million Forecast, by Type 2020 & 2033
- Table 34: Global Optical Fiber Composite Phase Conductor Oppc Volume K Forecast, by Type 2020 & 2033
- Table 35: Global Optical Fiber Composite Phase Conductor Oppc Revenue million Forecast, by Country 2020 & 2033
- Table 36: Global Optical Fiber Composite Phase Conductor Oppc Volume K Forecast, by Country 2020 & 2033
Frequently Asked Questions
1. What is the projected Compound Annual Growth Rate (CAGR) of the Optical Fiber Composite Phase Conductor Oppc?
The projected CAGR is approximately XXX%.
2. Which companies are prominent players in the Optical Fiber Composite Phase Conductor Oppc?
Key companies in the market include ZTT, AFL (Fujikura), Tongguang Cable, Hengtong Optic-electric, Shenzhen SDG, Prysmian Group, Furukawa, LS Cable & System, Jiangsu Hongtu, Taihan, Sichuan Huiyuan, Wuhan Horizon Technology, Henan Qingzhou Group.
3. What are the main segments of the Optical Fiber Composite Phase Conductor Oppc?
The market segments include Application, Type.
4. Can you provide details about the market size?
The market size is estimated to be USD XXX million as of 2022.
5. What are some drivers contributing to market growth?
N/A
6. What are the notable trends driving market growth?
N/A
7. Are there any restraints impacting market growth?
N/A
8. Can you provide examples of recent developments in the market?
N/A
9. What pricing options are available for accessing the report?
Pricing options include single-user, multi-user, and enterprise licenses priced at USD 3950.00, USD 5925.00, and USD 7900.00 respectively.
10. Is the market size provided in terms of value or volume?
The market size is provided in terms of value, measured in million and volume, measured in K.
11. Are there any specific market keywords associated with the report?
Yes, the market keyword associated with the report is "Optical Fiber Composite Phase Conductor Oppc," which aids in identifying and referencing the specific market segment covered.
12. How do I determine which pricing option suits my needs best?
The pricing options vary based on user requirements and access needs. Individual users may opt for single-user licenses, while businesses requiring broader access may choose multi-user or enterprise licenses for cost-effective access to the report.
13. Are there any additional resources or data provided in the Optical Fiber Composite Phase Conductor Oppc report?
While the report offers comprehensive insights, it's advisable to review the specific contents or supplementary materials provided to ascertain if additional resources or data are available.
14. How can I stay updated on further developments or reports in the Optical Fiber Composite Phase Conductor Oppc?
To stay informed about further developments, trends, and reports in the Optical Fiber Composite Phase Conductor Oppc, consider subscribing to industry newsletters, following relevant companies and organizations, or regularly checking reputable industry news sources and publications.
Methodology
Step 1 - Identification of Relevant Samples Size from Population Database


Step 2 - Approaches for Defining Global Market Size (Value, Volume* & Price*)

Note*: In applicable scenarios
Step 3 - Data Sources
Primary Research
- Web Analytics
- Survey Reports
- Research Institute
- Latest Research Reports
- Opinion Leaders
Secondary Research
- Annual Reports
- White Paper
- Latest Press Release
- Industry Association
- Paid Database
- Investor Presentations

Step 4 - Data Triangulation
Involves using different sources of information in order to increase the validity of a study
These sources are likely to be stakeholders in a program - participants, other researchers, program staff, other community members, and so on.
Then we put all data in single framework & apply various statistical tools to find out the dynamic on the market.
During the analysis stage, feedback from the stakeholder groups would be compared to determine areas of agreement as well as areas of divergence

