
Key Insights
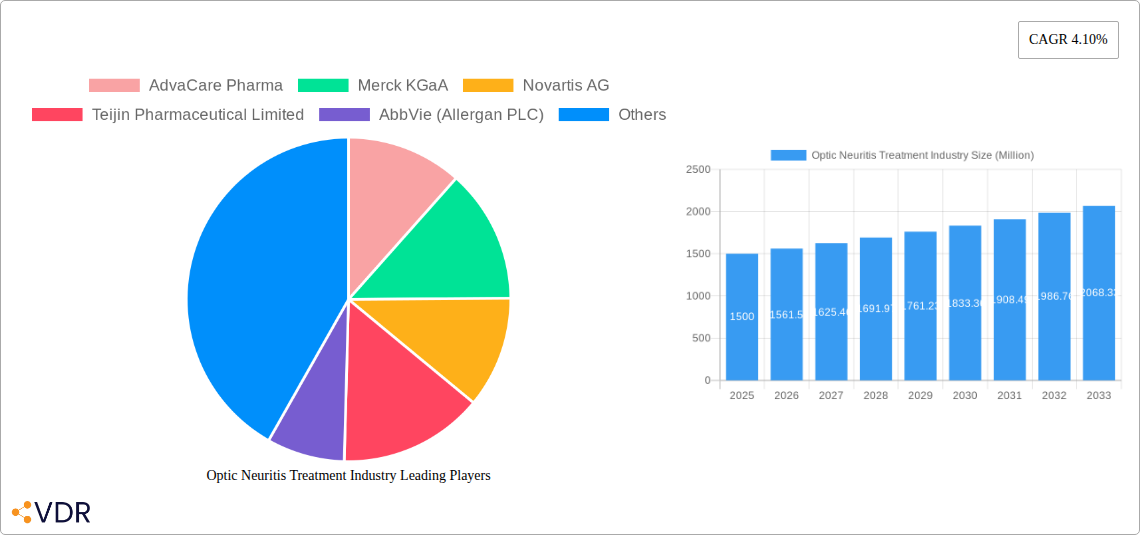
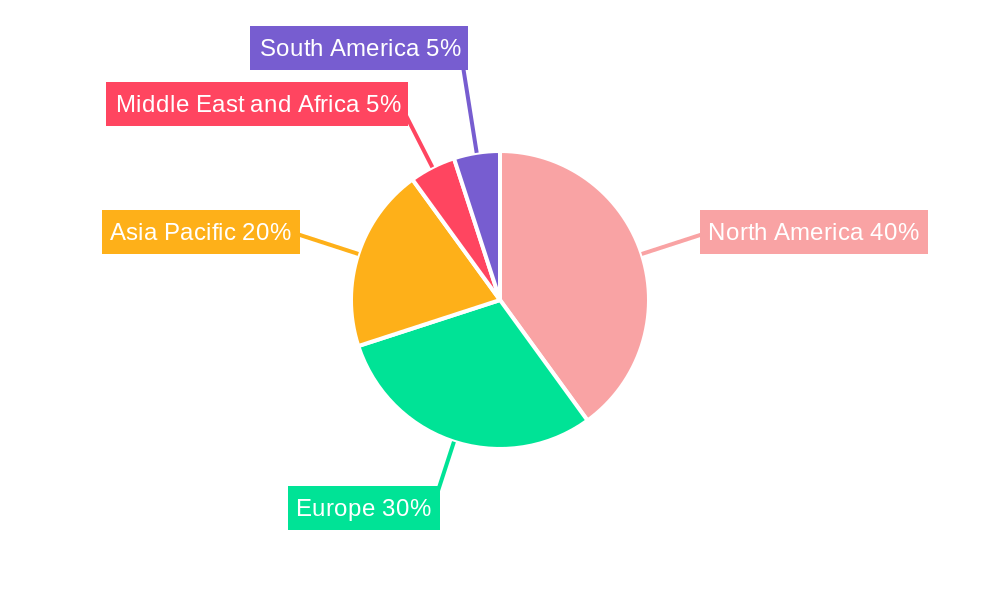
The global optic neuritis treatment market is experiencing steady growth, projected to maintain a Compound Annual Growth Rate (CAGR) of 4.10% from 2025 to 2033. This growth is fueled by several key factors. The rising prevalence of multiple sclerosis (MS), a significant cause of optic neuritis, coupled with an aging global population, contributes substantially to increased demand for effective treatments. Advances in understanding the disease mechanisms and the development of novel therapies, including more targeted immunomodulators and potentially less invasive steroid regimens, are driving market expansion. Furthermore, increasing awareness among healthcare professionals and patients about optic neuritis symptoms and treatment options leads to earlier diagnosis and intervention, positively impacting market growth. The market is segmented by treatment type (steroidal therapy, immunomodulators, others), end-user (neurology clinics, hospitals, specialty care centers), and geography. North America currently holds a significant market share due to advanced healthcare infrastructure and higher disease prevalence, but growth in Asia-Pacific is expected to be substantial in the coming years, driven by rising healthcare spending and increased awareness.
While the market exhibits positive growth, certain challenges exist. High treatment costs associated with some therapies, particularly novel immunomodulators, can pose a barrier to access, especially in emerging economies. Furthermore, the heterogeneity of optic neuritis, with varying disease severity and patient response to treatment, complicates the development of universally effective therapies. The need for further research to identify predictive biomarkers and personalize treatment strategies remains a key area for future development. Competition among established pharmaceutical companies and the emergence of new players are also shaping the market landscape. The strategic focus on improving treatment accessibility through collaborations with healthcare providers and the development of cost-effective solutions will be crucial for sustained market growth.
Optic Neuritis Treatment Industry Market Report: 2019-2033
This comprehensive report provides an in-depth analysis of the Optic Neuritis Treatment market, encompassing market dynamics, growth trends, regional segmentation, product landscape, key players, and future outlook. The study period covers 2019-2033, with 2025 as the base year and forecast period spanning 2025-2033. The report is designed for industry professionals, investors, and researchers seeking a detailed understanding of this dynamic market segment. The total market size in 2025 is estimated at xx Million.
Optic Neuritis Treatment Industry Market Dynamics & Structure
The Optic Neuritis Treatment market is characterized by moderate concentration, with key players like Merck KGaA, Novartis AG, and AbbVie (Allergan PLC) holding significant market share. Technological innovation, particularly in immunomodulators and targeted therapies, is a major driver. Regulatory approvals and pricing policies significantly influence market access. The market faces competition from alternative treatments and ongoing research into novel therapies. M&A activity remains moderate, with a projected xx number of deals between 2025-2033. End-user demographics are shifting towards an aging population, increasing the prevalence of optic neuritis.
- Market Concentration: Moderately concentrated, with top 5 players holding approximately xx% market share in 2025.
- Technological Innovation: Focus on developing more effective and safer therapies with fewer side effects.
- Regulatory Landscape: Stringent regulatory pathways for drug approvals impact market entry.
- Competitive Landscape: Intense competition among established players and emerging biotech companies.
- M&A Activity: Projected xx deals within the forecast period (2025-2033), driven by strategic expansion and pipeline diversification.
Optic Neuritis Treatment Industry Growth Trends & Insights
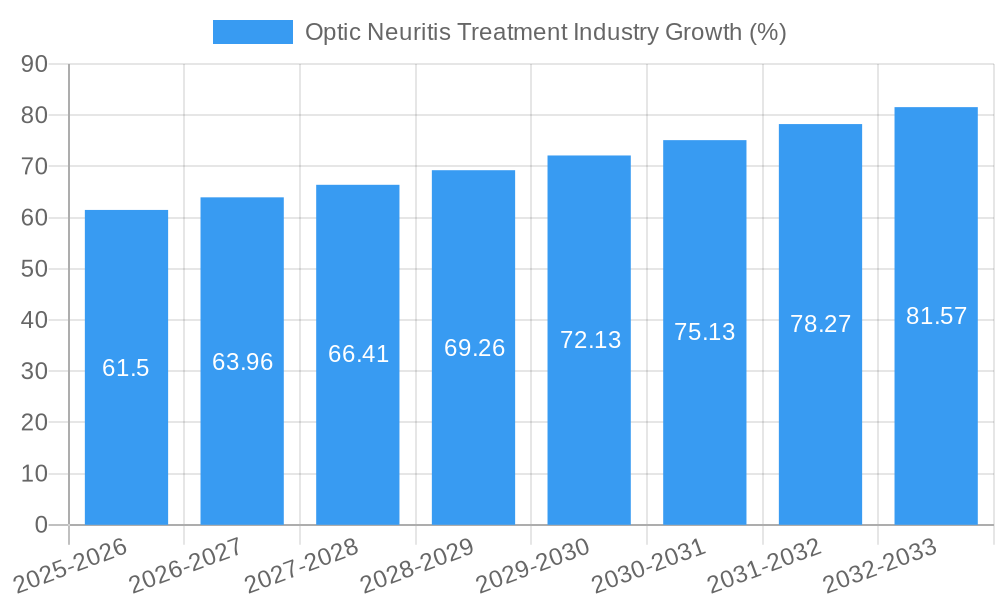
The Optic Neuritis Treatment market exhibits a steady growth trajectory, driven by increasing prevalence of optic neuritis, rising healthcare expenditure, and advancements in treatment modalities. The market size is projected to reach xx Million by 2033, exhibiting a CAGR of xx% during the forecast period. Adoption rates of newer therapies, particularly immunomodulators, are increasing steadily. Technological disruptions, such as the development of personalized medicine approaches, are expected to further accelerate market growth. Consumer behavior is shifting towards a preference for less invasive and more effective treatments.
Dominant Regions, Countries, or Segments in Optic Neuritis Treatment Industry
North America currently holds the largest market share, driven by high healthcare expenditure, advanced healthcare infrastructure, and a large patient population. Europe follows closely, with a robust healthcare system and increasing awareness of optic neuritis. Within treatment types, Steroidal Therapy dominates the market in 2025, accounting for approximately xx% of the total revenue. Hospitals represent the largest end-user segment due to their comprehensive treatment capabilities.
- North America: High prevalence of optic neuritis, advanced healthcare infrastructure, and high healthcare expenditure contribute to market dominance.
- Europe: Well-established healthcare systems and increasing awareness of optic neuritis contribute to significant market growth.
- Steroidal Therapy: Remains the dominant treatment type due to its established efficacy and wide availability.
- Hospitals: Largest end-user segment due to their capacity for comprehensive patient care.
Optic Neuritis Treatment Industry Product Landscape
The product landscape comprises steroidal therapies (e.g., intravenous methylprednisolone), immunomodulators (e.g., interferon beta), and other treatments (e.g., plasma exchange). Innovation focuses on developing more targeted therapies with improved efficacy and reduced side effects. Key selling propositions include improved patient outcomes, reduced treatment duration, and enhanced safety profiles. Technological advancements in drug delivery systems are also shaping the product landscape.
Key Drivers, Barriers & Challenges in Optic Neuritis Treatment Industry
Key Drivers: Rising prevalence of optic neuritis, increasing healthcare expenditure, technological advancements in treatment modalities, and growing awareness among healthcare professionals.
Key Barriers & Challenges: High cost of treatment, potential side effects of certain therapies, limited access to specialized healthcare facilities in certain regions, and the need for further research to develop more effective and safer treatment options. Regulatory hurdles also pose a significant challenge, impacting market entry for new therapies. Supply chain disruptions can impact the availability of essential medications.
Emerging Opportunities in Optic Neuritis Treatment Industry
Untapped markets in emerging economies present significant growth opportunities. The development of personalized medicine approaches targeting specific genetic subtypes of optic neuritis offers considerable potential. Innovation in drug delivery systems, such as targeted therapies and sustained-release formulations, could significantly improve treatment outcomes.
Growth Accelerators in the Optic Neuritis Treatment Industry
Technological breakthroughs in targeted therapies and personalized medicine will be major catalysts for long-term growth. Strategic partnerships between pharmaceutical companies and research institutions can accelerate the development and commercialization of novel therapies. Expansion into emerging markets will unlock significant market potential.
Key Players Shaping the Optic Neuritis Treatment Market
- AdvaCare Pharma
- Merck KGaA
- Novartis AG
- Teijin Pharmaceutical Limited
- AbbVie (Allergan PLC)
- Mallinckrodt Pharmaceuticals
Notable Milestones in Optic Neuritis Treatment Industry Sector
- August 2022: The U.S. FDA granted orphan drug designation to Trethera Corporation's experimental oral therapy TRE-515 for demyelinating optic neuritis.
- October 2022: Trethera was awarded a USD 1.6 million grant to further develop TRE-515.
In-Depth Optic Neuritis Treatment Industry Market Outlook
The Optic Neuritis Treatment market is poised for substantial growth driven by continued technological innovation, expansion into untapped markets, and the increasing prevalence of optic neuritis globally. Strategic partnerships and investments in research and development will further shape the market landscape. Companies focusing on developing targeted and personalized therapies are expected to gain a competitive edge. The long-term outlook for the Optic Neuritis Treatment market is highly positive, presenting significant opportunities for growth and investment.
Optic Neuritis Treatment Industry Segmentation
-
1. Treatment Type
- 1.1. Steroidal Therapy
- 1.2. Immunomodulators therapy
- 1.3. Other Treatment Types
Optic Neuritis Treatment Industry Segmentation By Geography
-
1. North America
- 1.1. United States
- 1.2. Canada
- 1.3. Mexico
-
2. Europe
- 2.1. Germany
- 2.2. United Kingdom
- 2.3. France
- 2.4. Italy
- 2.5. Spain
- 2.6. Rest of Europe
-
3. Asia Pacific
- 3.1. China
- 3.2. Japan
- 3.3. India
- 3.4. Australia
- 3.5. South Korea
- 3.6. Rest of Asia Pacific
-
4. Middle East and Africa
- 4.1. GCC
- 4.2. South Africa
- 4.3. Rest of Middle East and Africa
-
5. South America
- 5.1. Brazil
- 5.2. Argentina
- 5.3. Rest of South America
Optic Neuritis Treatment Industry REPORT HIGHLIGHTS
| Aspects | Details |
|---|---|
| Study Period | 2019-2033 |
| Base Year | 2024 |
| Estimated Year | 2025 |
| Forecast Period | 2025-2033 |
| Historical Period | 2019-2024 |
| Growth Rate | CAGR of 4.10% from 2019-2033 |
| Segmentation |
|
Table of Contents
- 1. Introduction
- 1.1. Research Scope
- 1.2. Market Segmentation
- 1.3. Research Methodology
- 1.4. Definitions and Assumptions
- 2. Executive Summary
- 2.1. Introduction
- 3. Market Dynamics
- 3.1. Introduction
- 3.2. Market Drivers
- 3.2.1. Increasing Prevalence of Optic Neuritis; Increasing Research Work Related to Optic Neuritis Treatment
- 3.3. Market Restrains
- 3.3.1. Side Effects Associated with the Treatment
- 3.4. Market Trends
- 3.4.1. Steroidal Therapy Segment is Expected to Witness Considerable Growth Over the Forecast Period
- 4. Market Factor Analysis
- 4.1. Porters Five Forces
- 4.2. Supply/Value Chain
- 4.3. PESTEL analysis
- 4.4. Market Entropy
- 4.5. Patent/Trademark Analysis
- 5. Global Optic Neuritis Treatment Industry Analysis, Insights and Forecast, 2019-2031
- 5.1. Market Analysis, Insights and Forecast - by Treatment Type
- 5.1.1. Steroidal Therapy
- 5.1.2. Immunomodulators therapy
- 5.1.3. Other Treatment Types
- 5.2. Market Analysis, Insights and Forecast - by Region
- 5.2.1. North America
- 5.2.2. Europe
- 5.2.3. Asia Pacific
- 5.2.4. Middle East and Africa
- 5.2.5. South America
- 5.1. Market Analysis, Insights and Forecast - by Treatment Type
- 6. North America Optic Neuritis Treatment Industry Analysis, Insights and Forecast, 2019-2031
- 6.1. Market Analysis, Insights and Forecast - by Treatment Type
- 6.1.1. Steroidal Therapy
- 6.1.2. Immunomodulators therapy
- 6.1.3. Other Treatment Types
- 6.1. Market Analysis, Insights and Forecast - by Treatment Type
- 7. Europe Optic Neuritis Treatment Industry Analysis, Insights and Forecast, 2019-2031
- 7.1. Market Analysis, Insights and Forecast - by Treatment Type
- 7.1.1. Steroidal Therapy
- 7.1.2. Immunomodulators therapy
- 7.1.3. Other Treatment Types
- 7.1. Market Analysis, Insights and Forecast - by Treatment Type
- 8. Asia Pacific Optic Neuritis Treatment Industry Analysis, Insights and Forecast, 2019-2031
- 8.1. Market Analysis, Insights and Forecast - by Treatment Type
- 8.1.1. Steroidal Therapy
- 8.1.2. Immunomodulators therapy
- 8.1.3. Other Treatment Types
- 8.1. Market Analysis, Insights and Forecast - by Treatment Type
- 9. Middle East and Africa Optic Neuritis Treatment Industry Analysis, Insights and Forecast, 2019-2031
- 9.1. Market Analysis, Insights and Forecast - by Treatment Type
- 9.1.1. Steroidal Therapy
- 9.1.2. Immunomodulators therapy
- 9.1.3. Other Treatment Types
- 9.1. Market Analysis, Insights and Forecast - by Treatment Type
- 10. South America Optic Neuritis Treatment Industry Analysis, Insights and Forecast, 2019-2031
- 10.1. Market Analysis, Insights and Forecast - by Treatment Type
- 10.1.1. Steroidal Therapy
- 10.1.2. Immunomodulators therapy
- 10.1.3. Other Treatment Types
- 10.1. Market Analysis, Insights and Forecast - by Treatment Type
- 11. North America Optic Neuritis Treatment Industry Analysis, Insights and Forecast, 2019-2031
- 11.1. Market Analysis, Insights and Forecast - By Country/Sub-region
- 11.1.1. undefined
- 12. Europe Optic Neuritis Treatment Industry Analysis, Insights and Forecast, 2019-2031
- 12.1. Market Analysis, Insights and Forecast - By Country/Sub-region
- 12.1.1. undefined
- 13. Asia Pacific Optic Neuritis Treatment Industry Analysis, Insights and Forecast, 2019-2031
- 13.1. Market Analysis, Insights and Forecast - By Country/Sub-region
- 13.1.1. undefined
- 14. Middle East and Africa Optic Neuritis Treatment Industry Analysis, Insights and Forecast, 2019-2031
- 14.1. Market Analysis, Insights and Forecast - By Country/Sub-region
- 14.1.1. undefined
- 15. South America Optic Neuritis Treatment Industry Analysis, Insights and Forecast, 2019-2031
- 15.1. Market Analysis, Insights and Forecast - By Country/Sub-region
- 15.1.1. undefined
- 16. Competitive Analysis
- 16.1. Global Market Share Analysis 2024
- 16.2. Company Profiles
- 16.2.1 AdvaCare Pharma
- 16.2.1.1. Overview
- 16.2.1.2. Products
- 16.2.1.3. SWOT Analysis
- 16.2.1.4. Recent Developments
- 16.2.1.5. Financials (Based on Availability)
- 16.2.2 Merck KGaA
- 16.2.2.1. Overview
- 16.2.2.2. Products
- 16.2.2.3. SWOT Analysis
- 16.2.2.4. Recent Developments
- 16.2.2.5. Financials (Based on Availability)
- 16.2.3 Novartis AG
- 16.2.3.1. Overview
- 16.2.3.2. Products
- 16.2.3.3. SWOT Analysis
- 16.2.3.4. Recent Developments
- 16.2.3.5. Financials (Based on Availability)
- 16.2.4 Teijin Pharmaceutical Limited
- 16.2.4.1. Overview
- 16.2.4.2. Products
- 16.2.4.3. SWOT Analysis
- 16.2.4.4. Recent Developments
- 16.2.4.5. Financials (Based on Availability)
- 16.2.5 AbbVie (Allergan PLC)
- 16.2.5.1. Overview
- 16.2.5.2. Products
- 16.2.5.3. SWOT Analysis
- 16.2.5.4. Recent Developments
- 16.2.5.5. Financials (Based on Availability)
- 16.2.6 Mallinckrodt Pharmaceuticals
- 16.2.6.1. Overview
- 16.2.6.2. Products
- 16.2.6.3. SWOT Analysis
- 16.2.6.4. Recent Developments
- 16.2.6.5. Financials (Based on Availability)
- 16.2.1 AdvaCare Pharma
List of Figures
- Figure 1: Global Optic Neuritis Treatment Industry Revenue Breakdown (Million, %) by Region 2024 & 2032
- Figure 2: Global Optic Neuritis Treatment Industry Volume Breakdown (K Unit, %) by Region 2024 & 2032
- Figure 3: North America Optic Neuritis Treatment Industry Revenue (Million), by Country 2024 & 2032
- Figure 4: North America Optic Neuritis Treatment Industry Volume (K Unit), by Country 2024 & 2032
- Figure 5: North America Optic Neuritis Treatment Industry Revenue Share (%), by Country 2024 & 2032
- Figure 6: North America Optic Neuritis Treatment Industry Volume Share (%), by Country 2024 & 2032
- Figure 7: Europe Optic Neuritis Treatment Industry Revenue (Million), by Country 2024 & 2032
- Figure 8: Europe Optic Neuritis Treatment Industry Volume (K Unit), by Country 2024 & 2032
- Figure 9: Europe Optic Neuritis Treatment Industry Revenue Share (%), by Country 2024 & 2032
- Figure 10: Europe Optic Neuritis Treatment Industry Volume Share (%), by Country 2024 & 2032
- Figure 11: Asia Pacific Optic Neuritis Treatment Industry Revenue (Million), by Country 2024 & 2032
- Figure 12: Asia Pacific Optic Neuritis Treatment Industry Volume (K Unit), by Country 2024 & 2032
- Figure 13: Asia Pacific Optic Neuritis Treatment Industry Revenue Share (%), by Country 2024 & 2032
- Figure 14: Asia Pacific Optic Neuritis Treatment Industry Volume Share (%), by Country 2024 & 2032
- Figure 15: Middle East and Africa Optic Neuritis Treatment Industry Revenue (Million), by Country 2024 & 2032
- Figure 16: Middle East and Africa Optic Neuritis Treatment Industry Volume (K Unit), by Country 2024 & 2032
- Figure 17: Middle East and Africa Optic Neuritis Treatment Industry Revenue Share (%), by Country 2024 & 2032
- Figure 18: Middle East and Africa Optic Neuritis Treatment Industry Volume Share (%), by Country 2024 & 2032
- Figure 19: South America Optic Neuritis Treatment Industry Revenue (Million), by Country 2024 & 2032
- Figure 20: South America Optic Neuritis Treatment Industry Volume (K Unit), by Country 2024 & 2032
- Figure 21: South America Optic Neuritis Treatment Industry Revenue Share (%), by Country 2024 & 2032
- Figure 22: South America Optic Neuritis Treatment Industry Volume Share (%), by Country 2024 & 2032
- Figure 23: North America Optic Neuritis Treatment Industry Revenue (Million), by Treatment Type 2024 & 2032
- Figure 24: North America Optic Neuritis Treatment Industry Volume (K Unit), by Treatment Type 2024 & 2032
- Figure 25: North America Optic Neuritis Treatment Industry Revenue Share (%), by Treatment Type 2024 & 2032
- Figure 26: North America Optic Neuritis Treatment Industry Volume Share (%), by Treatment Type 2024 & 2032
- Figure 27: North America Optic Neuritis Treatment Industry Revenue (Million), by Country 2024 & 2032
- Figure 28: North America Optic Neuritis Treatment Industry Volume (K Unit), by Country 2024 & 2032
- Figure 29: North America Optic Neuritis Treatment Industry Revenue Share (%), by Country 2024 & 2032
- Figure 30: North America Optic Neuritis Treatment Industry Volume Share (%), by Country 2024 & 2032
- Figure 31: Europe Optic Neuritis Treatment Industry Revenue (Million), by Treatment Type 2024 & 2032
- Figure 32: Europe Optic Neuritis Treatment Industry Volume (K Unit), by Treatment Type 2024 & 2032
- Figure 33: Europe Optic Neuritis Treatment Industry Revenue Share (%), by Treatment Type 2024 & 2032
- Figure 34: Europe Optic Neuritis Treatment Industry Volume Share (%), by Treatment Type 2024 & 2032
- Figure 35: Europe Optic Neuritis Treatment Industry Revenue (Million), by Country 2024 & 2032
- Figure 36: Europe Optic Neuritis Treatment Industry Volume (K Unit), by Country 2024 & 2032
- Figure 37: Europe Optic Neuritis Treatment Industry Revenue Share (%), by Country 2024 & 2032
- Figure 38: Europe Optic Neuritis Treatment Industry Volume Share (%), by Country 2024 & 2032
- Figure 39: Asia Pacific Optic Neuritis Treatment Industry Revenue (Million), by Treatment Type 2024 & 2032
- Figure 40: Asia Pacific Optic Neuritis Treatment Industry Volume (K Unit), by Treatment Type 2024 & 2032
- Figure 41: Asia Pacific Optic Neuritis Treatment Industry Revenue Share (%), by Treatment Type 2024 & 2032
- Figure 42: Asia Pacific Optic Neuritis Treatment Industry Volume Share (%), by Treatment Type 2024 & 2032
- Figure 43: Asia Pacific Optic Neuritis Treatment Industry Revenue (Million), by Country 2024 & 2032
- Figure 44: Asia Pacific Optic Neuritis Treatment Industry Volume (K Unit), by Country 2024 & 2032
- Figure 45: Asia Pacific Optic Neuritis Treatment Industry Revenue Share (%), by Country 2024 & 2032
- Figure 46: Asia Pacific Optic Neuritis Treatment Industry Volume Share (%), by Country 2024 & 2032
- Figure 47: Middle East and Africa Optic Neuritis Treatment Industry Revenue (Million), by Treatment Type 2024 & 2032
- Figure 48: Middle East and Africa Optic Neuritis Treatment Industry Volume (K Unit), by Treatment Type 2024 & 2032
- Figure 49: Middle East and Africa Optic Neuritis Treatment Industry Revenue Share (%), by Treatment Type 2024 & 2032
- Figure 50: Middle East and Africa Optic Neuritis Treatment Industry Volume Share (%), by Treatment Type 2024 & 2032
- Figure 51: Middle East and Africa Optic Neuritis Treatment Industry Revenue (Million), by Country 2024 & 2032
- Figure 52: Middle East and Africa Optic Neuritis Treatment Industry Volume (K Unit), by Country 2024 & 2032
- Figure 53: Middle East and Africa Optic Neuritis Treatment Industry Revenue Share (%), by Country 2024 & 2032
- Figure 54: Middle East and Africa Optic Neuritis Treatment Industry Volume Share (%), by Country 2024 & 2032
- Figure 55: South America Optic Neuritis Treatment Industry Revenue (Million), by Treatment Type 2024 & 2032
- Figure 56: South America Optic Neuritis Treatment Industry Volume (K Unit), by Treatment Type 2024 & 2032
- Figure 57: South America Optic Neuritis Treatment Industry Revenue Share (%), by Treatment Type 2024 & 2032
- Figure 58: South America Optic Neuritis Treatment Industry Volume Share (%), by Treatment Type 2024 & 2032
- Figure 59: South America Optic Neuritis Treatment Industry Revenue (Million), by Country 2024 & 2032
- Figure 60: South America Optic Neuritis Treatment Industry Volume (K Unit), by Country 2024 & 2032
- Figure 61: South America Optic Neuritis Treatment Industry Revenue Share (%), by Country 2024 & 2032
- Figure 62: South America Optic Neuritis Treatment Industry Volume Share (%), by Country 2024 & 2032
List of Tables
- Table 1: Global Optic Neuritis Treatment Industry Revenue Million Forecast, by Region 2019 & 2032
- Table 2: Global Optic Neuritis Treatment Industry Volume K Unit Forecast, by Region 2019 & 2032
- Table 3: Global Optic Neuritis Treatment Industry Revenue Million Forecast, by Treatment Type 2019 & 2032
- Table 4: Global Optic Neuritis Treatment Industry Volume K Unit Forecast, by Treatment Type 2019 & 2032
- Table 5: Global Optic Neuritis Treatment Industry Revenue Million Forecast, by Region 2019 & 2032
- Table 6: Global Optic Neuritis Treatment Industry Volume K Unit Forecast, by Region 2019 & 2032
- Table 7: Global Optic Neuritis Treatment Industry Revenue Million Forecast, by Country 2019 & 2032
- Table 8: Global Optic Neuritis Treatment Industry Volume K Unit Forecast, by Country 2019 & 2032
- Table 9: Global Optic Neuritis Treatment Industry Revenue Million Forecast, by Country 2019 & 2032
- Table 10: Global Optic Neuritis Treatment Industry Volume K Unit Forecast, by Country 2019 & 2032
- Table 11: Global Optic Neuritis Treatment Industry Revenue Million Forecast, by Country 2019 & 2032
- Table 12: Global Optic Neuritis Treatment Industry Volume K Unit Forecast, by Country 2019 & 2032
- Table 13: Global Optic Neuritis Treatment Industry Revenue Million Forecast, by Country 2019 & 2032
- Table 14: Global Optic Neuritis Treatment Industry Volume K Unit Forecast, by Country 2019 & 2032
- Table 15: Global Optic Neuritis Treatment Industry Revenue Million Forecast, by Country 2019 & 2032
- Table 16: Global Optic Neuritis Treatment Industry Volume K Unit Forecast, by Country 2019 & 2032
- Table 17: Global Optic Neuritis Treatment Industry Revenue Million Forecast, by Treatment Type 2019 & 2032
- Table 18: Global Optic Neuritis Treatment Industry Volume K Unit Forecast, by Treatment Type 2019 & 2032
- Table 19: Global Optic Neuritis Treatment Industry Revenue Million Forecast, by Country 2019 & 2032
- Table 20: Global Optic Neuritis Treatment Industry Volume K Unit Forecast, by Country 2019 & 2032
- Table 21: United States Optic Neuritis Treatment Industry Revenue (Million) Forecast, by Application 2019 & 2032
- Table 22: United States Optic Neuritis Treatment Industry Volume (K Unit) Forecast, by Application 2019 & 2032
- Table 23: Canada Optic Neuritis Treatment Industry Revenue (Million) Forecast, by Application 2019 & 2032
- Table 24: Canada Optic Neuritis Treatment Industry Volume (K Unit) Forecast, by Application 2019 & 2032
- Table 25: Mexico Optic Neuritis Treatment Industry Revenue (Million) Forecast, by Application 2019 & 2032
- Table 26: Mexico Optic Neuritis Treatment Industry Volume (K Unit) Forecast, by Application 2019 & 2032
- Table 27: Global Optic Neuritis Treatment Industry Revenue Million Forecast, by Treatment Type 2019 & 2032
- Table 28: Global Optic Neuritis Treatment Industry Volume K Unit Forecast, by Treatment Type 2019 & 2032
- Table 29: Global Optic Neuritis Treatment Industry Revenue Million Forecast, by Country 2019 & 2032
- Table 30: Global Optic Neuritis Treatment Industry Volume K Unit Forecast, by Country 2019 & 2032
- Table 31: Germany Optic Neuritis Treatment Industry Revenue (Million) Forecast, by Application 2019 & 2032
- Table 32: Germany Optic Neuritis Treatment Industry Volume (K Unit) Forecast, by Application 2019 & 2032
- Table 33: United Kingdom Optic Neuritis Treatment Industry Revenue (Million) Forecast, by Application 2019 & 2032
- Table 34: United Kingdom Optic Neuritis Treatment Industry Volume (K Unit) Forecast, by Application 2019 & 2032
- Table 35: France Optic Neuritis Treatment Industry Revenue (Million) Forecast, by Application 2019 & 2032
- Table 36: France Optic Neuritis Treatment Industry Volume (K Unit) Forecast, by Application 2019 & 2032
- Table 37: Italy Optic Neuritis Treatment Industry Revenue (Million) Forecast, by Application 2019 & 2032
- Table 38: Italy Optic Neuritis Treatment Industry Volume (K Unit) Forecast, by Application 2019 & 2032
- Table 39: Spain Optic Neuritis Treatment Industry Revenue (Million) Forecast, by Application 2019 & 2032
- Table 40: Spain Optic Neuritis Treatment Industry Volume (K Unit) Forecast, by Application 2019 & 2032
- Table 41: Rest of Europe Optic Neuritis Treatment Industry Revenue (Million) Forecast, by Application 2019 & 2032
- Table 42: Rest of Europe Optic Neuritis Treatment Industry Volume (K Unit) Forecast, by Application 2019 & 2032
- Table 43: Global Optic Neuritis Treatment Industry Revenue Million Forecast, by Treatment Type 2019 & 2032
- Table 44: Global Optic Neuritis Treatment Industry Volume K Unit Forecast, by Treatment Type 2019 & 2032
- Table 45: Global Optic Neuritis Treatment Industry Revenue Million Forecast, by Country 2019 & 2032
- Table 46: Global Optic Neuritis Treatment Industry Volume K Unit Forecast, by Country 2019 & 2032
- Table 47: China Optic Neuritis Treatment Industry Revenue (Million) Forecast, by Application 2019 & 2032
- Table 48: China Optic Neuritis Treatment Industry Volume (K Unit) Forecast, by Application 2019 & 2032
- Table 49: Japan Optic Neuritis Treatment Industry Revenue (Million) Forecast, by Application 2019 & 2032
- Table 50: Japan Optic Neuritis Treatment Industry Volume (K Unit) Forecast, by Application 2019 & 2032
- Table 51: India Optic Neuritis Treatment Industry Revenue (Million) Forecast, by Application 2019 & 2032
- Table 52: India Optic Neuritis Treatment Industry Volume (K Unit) Forecast, by Application 2019 & 2032
- Table 53: Australia Optic Neuritis Treatment Industry Revenue (Million) Forecast, by Application 2019 & 2032
- Table 54: Australia Optic Neuritis Treatment Industry Volume (K Unit) Forecast, by Application 2019 & 2032
- Table 55: South Korea Optic Neuritis Treatment Industry Revenue (Million) Forecast, by Application 2019 & 2032
- Table 56: South Korea Optic Neuritis Treatment Industry Volume (K Unit) Forecast, by Application 2019 & 2032
- Table 57: Rest of Asia Pacific Optic Neuritis Treatment Industry Revenue (Million) Forecast, by Application 2019 & 2032
- Table 58: Rest of Asia Pacific Optic Neuritis Treatment Industry Volume (K Unit) Forecast, by Application 2019 & 2032
- Table 59: Global Optic Neuritis Treatment Industry Revenue Million Forecast, by Treatment Type 2019 & 2032
- Table 60: Global Optic Neuritis Treatment Industry Volume K Unit Forecast, by Treatment Type 2019 & 2032
- Table 61: Global Optic Neuritis Treatment Industry Revenue Million Forecast, by Country 2019 & 2032
- Table 62: Global Optic Neuritis Treatment Industry Volume K Unit Forecast, by Country 2019 & 2032
- Table 63: GCC Optic Neuritis Treatment Industry Revenue (Million) Forecast, by Application 2019 & 2032
- Table 64: GCC Optic Neuritis Treatment Industry Volume (K Unit) Forecast, by Application 2019 & 2032
- Table 65: South Africa Optic Neuritis Treatment Industry Revenue (Million) Forecast, by Application 2019 & 2032
- Table 66: South Africa Optic Neuritis Treatment Industry Volume (K Unit) Forecast, by Application 2019 & 2032
- Table 67: Rest of Middle East and Africa Optic Neuritis Treatment Industry Revenue (Million) Forecast, by Application 2019 & 2032
- Table 68: Rest of Middle East and Africa Optic Neuritis Treatment Industry Volume (K Unit) Forecast, by Application 2019 & 2032
- Table 69: Global Optic Neuritis Treatment Industry Revenue Million Forecast, by Treatment Type 2019 & 2032
- Table 70: Global Optic Neuritis Treatment Industry Volume K Unit Forecast, by Treatment Type 2019 & 2032
- Table 71: Global Optic Neuritis Treatment Industry Revenue Million Forecast, by Country 2019 & 2032
- Table 72: Global Optic Neuritis Treatment Industry Volume K Unit Forecast, by Country 2019 & 2032
- Table 73: Brazil Optic Neuritis Treatment Industry Revenue (Million) Forecast, by Application 2019 & 2032
- Table 74: Brazil Optic Neuritis Treatment Industry Volume (K Unit) Forecast, by Application 2019 & 2032
- Table 75: Argentina Optic Neuritis Treatment Industry Revenue (Million) Forecast, by Application 2019 & 2032
- Table 76: Argentina Optic Neuritis Treatment Industry Volume (K Unit) Forecast, by Application 2019 & 2032
- Table 77: Rest of South America Optic Neuritis Treatment Industry Revenue (Million) Forecast, by Application 2019 & 2032
- Table 78: Rest of South America Optic Neuritis Treatment Industry Volume (K Unit) Forecast, by Application 2019 & 2032
Frequently Asked Questions
1. What is the projected Compound Annual Growth Rate (CAGR) of the Optic Neuritis Treatment Industry?
The projected CAGR is approximately 4.10%.
2. Which companies are prominent players in the Optic Neuritis Treatment Industry?
Key companies in the market include AdvaCare Pharma, Merck KGaA, Novartis AG, Teijin Pharmaceutical Limited, AbbVie (Allergan PLC), Mallinckrodt Pharmaceuticals.
3. What are the main segments of the Optic Neuritis Treatment Industry?
The market segments include Treatment Type.
4. Can you provide details about the market size?
The market size is estimated to be USD XX Million as of 2022.
5. What are some drivers contributing to market growth?
Increasing Prevalence of Optic Neuritis; Increasing Research Work Related to Optic Neuritis Treatment.
6. What are the notable trends driving market growth?
Steroidal Therapy Segment is Expected to Witness Considerable Growth Over the Forecast Period.
7. Are there any restraints impacting market growth?
Side Effects Associated with the Treatment.
8. Can you provide examples of recent developments in the market?
October 2022: Trethera has been awarded a USD 1.6 million grant to further develop TRE-515 as a potential treatment for optic neuritis which also is a common symptom of multiple sclerosis (MS).
9. What pricing options are available for accessing the report?
Pricing options include single-user, multi-user, and enterprise licenses priced at USD 4750, USD 5250, and USD 8750 respectively.
10. Is the market size provided in terms of value or volume?
The market size is provided in terms of value, measured in Million and volume, measured in K Unit.
11. Are there any specific market keywords associated with the report?
Yes, the market keyword associated with the report is "Optic Neuritis Treatment Industry," which aids in identifying and referencing the specific market segment covered.
12. How do I determine which pricing option suits my needs best?
The pricing options vary based on user requirements and access needs. Individual users may opt for single-user licenses, while businesses requiring broader access may choose multi-user or enterprise licenses for cost-effective access to the report.
13. Are there any additional resources or data provided in the Optic Neuritis Treatment Industry report?
While the report offers comprehensive insights, it's advisable to review the specific contents or supplementary materials provided to ascertain if additional resources or data are available.
14. How can I stay updated on further developments or reports in the Optic Neuritis Treatment Industry?
To stay informed about further developments, trends, and reports in the Optic Neuritis Treatment Industry, consider subscribing to industry newsletters, following relevant companies and organizations, or regularly checking reputable industry news sources and publications.
Methodology
Step 1 - Identification of Relevant Samples Size from Population Database


Step 2 - Approaches for Defining Global Market Size (Value, Volume* & Price*)

Note*: In applicable scenarios
Step 3 - Data Sources
Primary Research
- Web Analytics
- Survey Reports
- Research Institute
- Latest Research Reports
- Opinion Leaders
Secondary Research
- Annual Reports
- White Paper
- Latest Press Release
- Industry Association
- Paid Database
- Investor Presentations

Step 4 - Data Triangulation
Involves using different sources of information in order to increase the validity of a study
These sources are likely to be stakeholders in a program - participants, other researchers, program staff, other community members, and so on.
Then we put all data in single framework & apply various statistical tools to find out the dynamic on the market.
During the analysis stage, feedback from the stakeholder groups would be compared to determine areas of agreement as well as areas of divergence


