
Key Insights
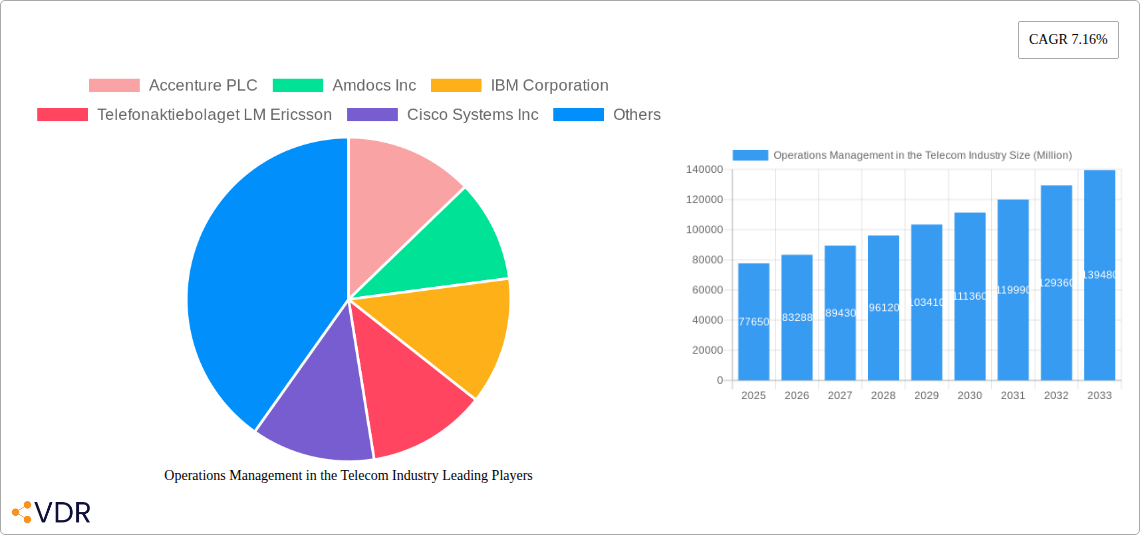
The global telecom operations management market, valued at $77.65 billion in 2025, is projected to experience robust growth, driven by the increasing adoption of cloud-based solutions, the expanding need for efficient network management, and the rising demand for improved customer experience. The 7.16% CAGR from 2025 to 2033 indicates a significant expansion, largely fueled by the continuous digital transformation within the telecom sector. Key drivers include the necessity for real-time network monitoring and optimization to handle escalating data traffic, the implementation of advanced analytics for predictive maintenance and proactive issue resolution, and the imperative to improve operational efficiency to reduce costs and enhance profitability. The market is segmented by deployment (on-premise and cloud), type (software, inventory management, and services), and geography, reflecting the diverse needs and technological adoption rates across regions. The cloud segment is expected to witness the highest growth, driven by its scalability, flexibility, and cost-effectiveness. While robust growth is anticipated, challenges remain, including the complexities of integrating legacy systems with modern technologies, the need for skilled professionals to manage these advanced systems, and potential security concerns associated with cloud-based solutions. North America and Europe currently hold significant market share, but the Asia-Pacific region is poised for substantial growth due to rapid infrastructure development and increasing smartphone penetration. Competitive pressures are intense, with a mix of established telecom equipment vendors, IT services giants, and specialized software providers vying for market dominance. This competitive landscape fosters innovation and drives down costs, ultimately benefiting telecom operators.
The success of telecom operators hinges on their ability to effectively manage their complex operations. This involves optimizing network performance, ensuring service reliability, streamlining business processes, and proactively addressing potential disruptions. The market's expansion is underpinned by the rising demand for higher bandwidth, increased data security, and the need for sophisticated tools to manage the expanding Internet of Things (IoT) ecosystem. Companies are increasingly investing in AI-powered solutions for automated network management, predictive analytics for resource optimization, and advanced security systems to mitigate cyber threats. The adoption of these advanced technologies is further propelled by the increasing pressure on telecom companies to enhance customer satisfaction, reduce operational expenditures, and generate new revenue streams. The integration of these technologies requires significant capital investment and expertise, presenting both opportunities and challenges for market players.
Operations Management in the Telecom Industry: 2019-2033 Market Report
This comprehensive report provides an in-depth analysis of the Operations Management market within the dynamic Telecommunications industry, projecting significant growth from 2025 to 2033. We analyze market dynamics, growth trends, key players, and future opportunities, offering valuable insights for industry professionals, investors, and strategists. The report covers a broad spectrum of segments, including software, inventory management, and services, across both on-premise and cloud deployment models. This detailed analysis utilizes data from 2019-2024 (historical period), with 2025 serving as the base and estimated year, extending forecasts to 2033. The total market size in 2025 is estimated at XX Million.
Operations Management in the Telecom Industry Market Dynamics & Structure
The global telecom operations management market is characterized by moderate concentration, with a few major players holding substantial market share. However, the market is also witnessing increased competition from smaller, specialized firms, especially in cloud-based solutions. Technological innovation, particularly in areas like AI, machine learning, and automation, is a key driver, while stringent regulatory frameworks and evolving cybersecurity concerns pose significant challenges. The market is also experiencing increased mergers and acquisitions (M&A) activity as larger players seek to expand their portfolios and capabilities. Substitute products, particularly in specific niche areas, are also gaining traction.
- Market Concentration: The top 5 players collectively hold approximately xx% of the market share in 2025.
- Technological Innovation: AI and ML are driving automation in network operations, predictive maintenance, and customer service.
- Regulatory Landscape: Stringent data privacy regulations and cybersecurity mandates impact operational strategies.
- M&A Activity: An estimated xx M&A deals were concluded in the telecom operations management sector between 2019 and 2024.
- End-User Demographics: Growth is driven by both large telcos and smaller emerging players.
- Competitive Substitutes: Open-source solutions and specialized niche players pose some competitive threat.
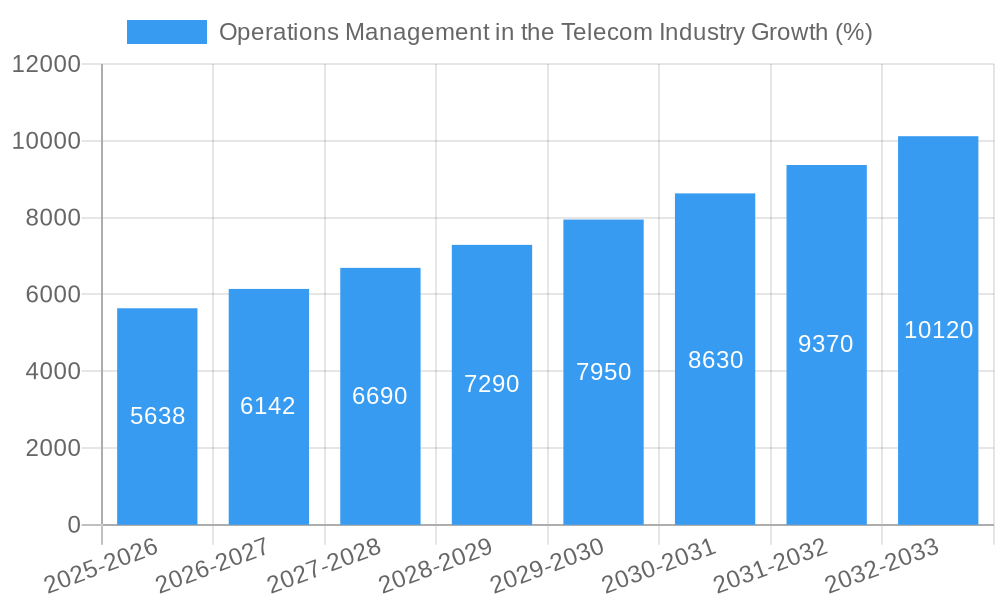
Operations Management in the Telecom Industry Growth Trends & Insights
The telecom operations management market is experiencing robust growth, driven by the increasing complexity of telecom networks, the rise of 5G and IoT, and the growing need for efficient network operations. The market size is projected to reach xx Million by 2033, exhibiting a Compound Annual Growth Rate (CAGR) of xx% during the forecast period (2025-2033). Adoption rates for advanced operations management solutions, particularly cloud-based platforms, are increasing significantly. This is fueled by the need for scalability, flexibility, and cost optimization. Consumer behavior shifts toward personalized services and increased data consumption are further driving market expansion.
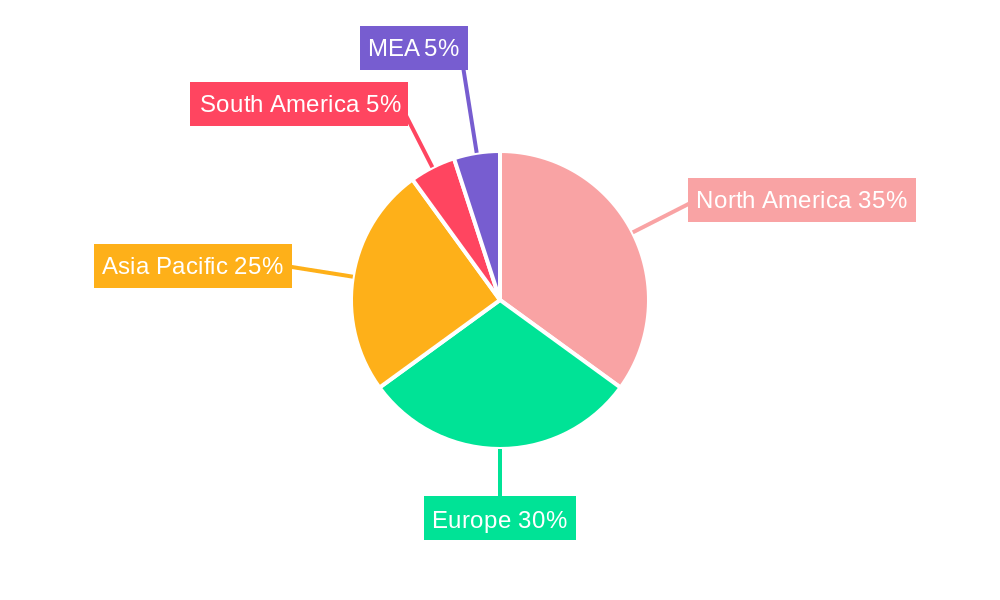
Dominant Regions, Countries, or Segments in Operations Management in the Telecom Industry
North America currently holds the largest market share in the telecom operations management sector, followed by Europe and Asia-Pacific. This dominance is primarily attributed to the early adoption of advanced technologies, robust infrastructure, and a large number of established telecom operators. The Cloud segment is experiencing the fastest growth, driven by the advantages of scalability, flexibility, and cost-effectiveness. Within deployment models, the cloud-based segment is expected to continue its rapid expansion, reaching xx Million by 2033.
- North America: Strong presence of major telecom operators and technology vendors.
- Europe: High regulatory scrutiny driving demand for robust management solutions.
- Asia-Pacific: Rapid growth in mobile and data consumption fuels market expansion.
- Cloud Deployment: Scalability, flexibility, and cost-efficiency drive its dominance.
- Software Segment: Offers comprehensive solutions for diverse operational needs.
Operations Management in the Telecom Industry Product Landscape
The product landscape is characterized by a diverse range of solutions, including network performance management tools, service assurance platforms, and inventory management systems. These offerings are increasingly integrated with AI and ML capabilities to provide predictive analytics and automated remediation. Key features include real-time monitoring, proactive alerts, and automated workflows, enhancing operational efficiency and reducing downtime. Unique selling propositions often focus on enhanced user experience, reduced operational costs, and proactive problem resolution.
Key Drivers, Barriers & Challenges in Operations Management in the Telecom Industry
Key Drivers:
- Increasing complexity of telecom networks.
- Growth of 5G and IoT.
- Demand for improved network performance and efficiency.
- Rising adoption of cloud computing.
Key Challenges:
- High initial investment costs for advanced solutions.
- Integration complexities with existing systems.
- Skilled workforce shortage.
- Data security and privacy concerns.
Emerging Opportunities in Operations Management in the Telecom Industry
Emerging opportunities lie in the adoption of AI/ML-driven solutions, the expansion into the edge computing space, and the development of solutions catering to the needs of 5G and IoT deployments. Untapped markets in developing regions present significant potential for growth, particularly with the focus on expanding digital infrastructure.
Growth Accelerators in the Operations Management in the Telecom Industry Industry
Strategic partnerships between telecom operators and technology providers are significantly accelerating market growth. Technological advancements in AI, big data, and cloud computing are continuously improving the capabilities of operations management platforms. The expansion into new service areas like edge computing and IoT further fuels growth.
Key Players Shaping the Operations Management in the Telecom Industry Market
- Accenture PLC
- Amdocs Inc
- IBM Corporation
- Telefonaktiebolaget LM Ericsson
- Cisco Systems Inc
- Hewlett Packard Enterprise Development LP
- ServiceNow Inc
- NEC Corporation
- ZTE Corporation
- Oracle Corporation
- Comarch SA
- Nokia Corporation
- TATA Consultancy Services Limited
- SAP SE
- Netcracker Technology Corp
Notable Milestones in Operations Management in the Telecom Industry Sector
- November 2021: AWS launched AWS Private 5G, a fully managed, pay-as-you-go private cellular service, significantly impacting the market for private network operations management.
- April 2022: The MoU between the Ministry of Railways and C-DOT in India to modernize railway telecommunications signals a substantial opportunity for operations management solutions in the public sector.
In-Depth Operations Management in the Telecom Industry Market Outlook
The future of the telecom operations management market is bright, driven by the relentless growth of data consumption, the expansion of 5G and IoT networks, and the increasing adoption of cloud-based solutions. Strategic partnerships, technological advancements, and investments in automation will continue to shape market dynamics. The market is poised for significant growth, presenting lucrative opportunities for established players and new entrants alike.
Operations Management in the Telecom Industry Segmentation
-
1. Deployment
- 1.1. On-premise
- 1.2. Cloud
-
2. Type
-
2.1. Software
- 2.1.1. Network Management
- 2.1.2. Customer and Product Management
- 2.1.3. Revenue Management
- 2.1.4. Inventory Management and Others
- 2.2. Services
-
2.1. Software
Operations Management in the Telecom Industry Segmentation By Geography
- 1. North America
- 2. Europe
- 3. Asia Pacific
- 4. Latin America
- 5. Middle East and Africa
Operations Management in the Telecom Industry REPORT HIGHLIGHTS
| Aspects | Details |
|---|---|
| Study Period | 2019-2033 |
| Base Year | 2024 |
| Estimated Year | 2025 |
| Forecast Period | 2025-2033 |
| Historical Period | 2019-2024 |
| Growth Rate | CAGR of 7.16% from 2019-2033 |
| Segmentation |
|
Table of Contents
- 1. Introduction
- 1.1. Research Scope
- 1.2. Market Segmentation
- 1.3. Research Methodology
- 1.4. Definitions and Assumptions
- 2. Executive Summary
- 2.1. Introduction
- 3. Market Dynamics
- 3.1. Introduction
- 3.2. Market Drivers
- 3.2.1. Increasing Operational Costs and Complexity
- 3.3. Market Restrains
- 3.3.1. ; Stringent Government Regulations on Data Security
- 3.4. Market Trends
- 3.4.1. Cloud is Expected to Witness Significant Growth
- 4. Market Factor Analysis
- 4.1. Porters Five Forces
- 4.2. Supply/Value Chain
- 4.3. PESTEL analysis
- 4.4. Market Entropy
- 4.5. Patent/Trademark Analysis
- 5. Global Operations Management in the Telecom Industry Analysis, Insights and Forecast, 2019-2031
- 5.1. Market Analysis, Insights and Forecast - by Deployment
- 5.1.1. On-premise
- 5.1.2. Cloud
- 5.2. Market Analysis, Insights and Forecast - by Type
- 5.2.1. Software
- 5.2.1.1. Network Management
- 5.2.1.2. Customer and Product Management
- 5.2.1.3. Revenue Management
- 5.2.1.4. Inventory Management and Others
- 5.2.2. Services
- 5.2.1. Software
- 5.3. Market Analysis, Insights and Forecast - by Region
- 5.3.1. North America
- 5.3.2. Europe
- 5.3.3. Asia Pacific
- 5.3.4. Latin America
- 5.3.5. Middle East and Africa
- 5.1. Market Analysis, Insights and Forecast - by Deployment
- 6. North America Operations Management in the Telecom Industry Analysis, Insights and Forecast, 2019-2031
- 6.1. Market Analysis, Insights and Forecast - by Deployment
- 6.1.1. On-premise
- 6.1.2. Cloud
- 6.2. Market Analysis, Insights and Forecast - by Type
- 6.2.1. Software
- 6.2.1.1. Network Management
- 6.2.1.2. Customer and Product Management
- 6.2.1.3. Revenue Management
- 6.2.1.4. Inventory Management and Others
- 6.2.2. Services
- 6.2.1. Software
- 6.1. Market Analysis, Insights and Forecast - by Deployment
- 7. Europe Operations Management in the Telecom Industry Analysis, Insights and Forecast, 2019-2031
- 7.1. Market Analysis, Insights and Forecast - by Deployment
- 7.1.1. On-premise
- 7.1.2. Cloud
- 7.2. Market Analysis, Insights and Forecast - by Type
- 7.2.1. Software
- 7.2.1.1. Network Management
- 7.2.1.2. Customer and Product Management
- 7.2.1.3. Revenue Management
- 7.2.1.4. Inventory Management and Others
- 7.2.2. Services
- 7.2.1. Software
- 7.1. Market Analysis, Insights and Forecast - by Deployment
- 8. Asia Pacific Operations Management in the Telecom Industry Analysis, Insights and Forecast, 2019-2031
- 8.1. Market Analysis, Insights and Forecast - by Deployment
- 8.1.1. On-premise
- 8.1.2. Cloud
- 8.2. Market Analysis, Insights and Forecast - by Type
- 8.2.1. Software
- 8.2.1.1. Network Management
- 8.2.1.2. Customer and Product Management
- 8.2.1.3. Revenue Management
- 8.2.1.4. Inventory Management and Others
- 8.2.2. Services
- 8.2.1. Software
- 8.1. Market Analysis, Insights and Forecast - by Deployment
- 9. Latin America Operations Management in the Telecom Industry Analysis, Insights and Forecast, 2019-2031
- 9.1. Market Analysis, Insights and Forecast - by Deployment
- 9.1.1. On-premise
- 9.1.2. Cloud
- 9.2. Market Analysis, Insights and Forecast - by Type
- 9.2.1. Software
- 9.2.1.1. Network Management
- 9.2.1.2. Customer and Product Management
- 9.2.1.3. Revenue Management
- 9.2.1.4. Inventory Management and Others
- 9.2.2. Services
- 9.2.1. Software
- 9.1. Market Analysis, Insights and Forecast - by Deployment
- 10. Middle East and Africa Operations Management in the Telecom Industry Analysis, Insights and Forecast, 2019-2031
- 10.1. Market Analysis, Insights and Forecast - by Deployment
- 10.1.1. On-premise
- 10.1.2. Cloud
- 10.2. Market Analysis, Insights and Forecast - by Type
- 10.2.1. Software
- 10.2.1.1. Network Management
- 10.2.1.2. Customer and Product Management
- 10.2.1.3. Revenue Management
- 10.2.1.4. Inventory Management and Others
- 10.2.2. Services
- 10.2.1. Software
- 10.1. Market Analysis, Insights and Forecast - by Deployment
- 11. North America Operations Management in the Telecom Industry Analysis, Insights and Forecast, 2019-2031
- 11.1. Market Analysis, Insights and Forecast - By Country/Sub-region
- 11.1.1 United States
- 11.1.2 Canada
- 11.1.3 Mexico
- 12. Europe Operations Management in the Telecom Industry Analysis, Insights and Forecast, 2019-2031
- 12.1. Market Analysis, Insights and Forecast - By Country/Sub-region
- 12.1.1 Germany
- 12.1.2 United Kingdom
- 12.1.3 France
- 12.1.4 Spain
- 12.1.5 Italy
- 12.1.6 Spain
- 12.1.7 Belgium
- 12.1.8 Netherland
- 12.1.9 Nordics
- 12.1.10 Rest of Europe
- 13. Asia Pacific Operations Management in the Telecom Industry Analysis, Insights and Forecast, 2019-2031
- 13.1. Market Analysis, Insights and Forecast - By Country/Sub-region
- 13.1.1 China
- 13.1.2 Japan
- 13.1.3 India
- 13.1.4 South Korea
- 13.1.5 Southeast Asia
- 13.1.6 Australia
- 13.1.7 Indonesia
- 13.1.8 Phillipes
- 13.1.9 Singapore
- 13.1.10 Thailandc
- 13.1.11 Rest of Asia Pacific
- 14. South America Operations Management in the Telecom Industry Analysis, Insights and Forecast, 2019-2031
- 14.1. Market Analysis, Insights and Forecast - By Country/Sub-region
- 14.1.1 Brazil
- 14.1.2 Argentina
- 14.1.3 Peru
- 14.1.4 Chile
- 14.1.5 Colombia
- 14.1.6 Ecuador
- 14.1.7 Venezuela
- 14.1.8 Rest of South America
- 15. North America Operations Management in the Telecom Industry Analysis, Insights and Forecast, 2019-2031
- 15.1. Market Analysis, Insights and Forecast - By Country/Sub-region
- 15.1.1 United States
- 15.1.2 Canada
- 15.1.3 Mexico
- 16. MEA Operations Management in the Telecom Industry Analysis, Insights and Forecast, 2019-2031
- 16.1. Market Analysis, Insights and Forecast - By Country/Sub-region
- 16.1.1 United Arab Emirates
- 16.1.2 Saudi Arabia
- 16.1.3 South Africa
- 16.1.4 Rest of Middle East and Africa
- 17. Competitive Analysis
- 17.1. Global Market Share Analysis 2024
- 17.2. Company Profiles
- 17.2.1 Accenture PLC
- 17.2.1.1. Overview
- 17.2.1.2. Products
- 17.2.1.3. SWOT Analysis
- 17.2.1.4. Recent Developments
- 17.2.1.5. Financials (Based on Availability)
- 17.2.2 Amdocs Inc
- 17.2.2.1. Overview
- 17.2.2.2. Products
- 17.2.2.3. SWOT Analysis
- 17.2.2.4. Recent Developments
- 17.2.2.5. Financials (Based on Availability)
- 17.2.3 IBM Corporation
- 17.2.3.1. Overview
- 17.2.3.2. Products
- 17.2.3.3. SWOT Analysis
- 17.2.3.4. Recent Developments
- 17.2.3.5. Financials (Based on Availability)
- 17.2.4 Telefonaktiebolaget LM Ericsson
- 17.2.4.1. Overview
- 17.2.4.2. Products
- 17.2.4.3. SWOT Analysis
- 17.2.4.4. Recent Developments
- 17.2.4.5. Financials (Based on Availability)
- 17.2.5 Cisco Systems Inc
- 17.2.5.1. Overview
- 17.2.5.2. Products
- 17.2.5.3. SWOT Analysis
- 17.2.5.4. Recent Developments
- 17.2.5.5. Financials (Based on Availability)
- 17.2.6 Hewlett Packard Enterprise Development LP
- 17.2.6.1. Overview
- 17.2.6.2. Products
- 17.2.6.3. SWOT Analysis
- 17.2.6.4. Recent Developments
- 17.2.6.5. Financials (Based on Availability)
- 17.2.7 ServiceNow Inc
- 17.2.7.1. Overview
- 17.2.7.2. Products
- 17.2.7.3. SWOT Analysis
- 17.2.7.4. Recent Developments
- 17.2.7.5. Financials (Based on Availability)
- 17.2.8 NEC Corporation
- 17.2.8.1. Overview
- 17.2.8.2. Products
- 17.2.8.3. SWOT Analysis
- 17.2.8.4. Recent Developments
- 17.2.8.5. Financials (Based on Availability)
- 17.2.9 ZTE Corporation
- 17.2.9.1. Overview
- 17.2.9.2. Products
- 17.2.9.3. SWOT Analysis
- 17.2.9.4. Recent Developments
- 17.2.9.5. Financials (Based on Availability)
- 17.2.10 Oracle Corporation
- 17.2.10.1. Overview
- 17.2.10.2. Products
- 17.2.10.3. SWOT Analysis
- 17.2.10.4. Recent Developments
- 17.2.10.5. Financials (Based on Availability)
- 17.2.11 Comarch SA
- 17.2.11.1. Overview
- 17.2.11.2. Products
- 17.2.11.3. SWOT Analysis
- 17.2.11.4. Recent Developments
- 17.2.11.5. Financials (Based on Availability)
- 17.2.12 Nokia Corporation
- 17.2.12.1. Overview
- 17.2.12.2. Products
- 17.2.12.3. SWOT Analysis
- 17.2.12.4. Recent Developments
- 17.2.12.5. Financials (Based on Availability)
- 17.2.13 TATA Consultancy Services Limited*List Not Exhaustive
- 17.2.13.1. Overview
- 17.2.13.2. Products
- 17.2.13.3. SWOT Analysis
- 17.2.13.4. Recent Developments
- 17.2.13.5. Financials (Based on Availability)
- 17.2.14 SAP SE
- 17.2.14.1. Overview
- 17.2.14.2. Products
- 17.2.14.3. SWOT Analysis
- 17.2.14.4. Recent Developments
- 17.2.14.5. Financials (Based on Availability)
- 17.2.15 Netcracker Technology Corp
- 17.2.15.1. Overview
- 17.2.15.2. Products
- 17.2.15.3. SWOT Analysis
- 17.2.15.4. Recent Developments
- 17.2.15.5. Financials (Based on Availability)
- 17.2.1 Accenture PLC
List of Figures
- Figure 1: Global Operations Management in the Telecom Industry Revenue Breakdown (Million, %) by Region 2024 & 2032
- Figure 2: North America Operations Management in the Telecom Industry Revenue (Million), by Country 2024 & 2032
- Figure 3: North America Operations Management in the Telecom Industry Revenue Share (%), by Country 2024 & 2032
- Figure 4: Europe Operations Management in the Telecom Industry Revenue (Million), by Country 2024 & 2032
- Figure 5: Europe Operations Management in the Telecom Industry Revenue Share (%), by Country 2024 & 2032
- Figure 6: Asia Pacific Operations Management in the Telecom Industry Revenue (Million), by Country 2024 & 2032
- Figure 7: Asia Pacific Operations Management in the Telecom Industry Revenue Share (%), by Country 2024 & 2032
- Figure 8: South America Operations Management in the Telecom Industry Revenue (Million), by Country 2024 & 2032
- Figure 9: South America Operations Management in the Telecom Industry Revenue Share (%), by Country 2024 & 2032
- Figure 10: North America Operations Management in the Telecom Industry Revenue (Million), by Country 2024 & 2032
- Figure 11: North America Operations Management in the Telecom Industry Revenue Share (%), by Country 2024 & 2032
- Figure 12: MEA Operations Management in the Telecom Industry Revenue (Million), by Country 2024 & 2032
- Figure 13: MEA Operations Management in the Telecom Industry Revenue Share (%), by Country 2024 & 2032
- Figure 14: North America Operations Management in the Telecom Industry Revenue (Million), by Deployment 2024 & 2032
- Figure 15: North America Operations Management in the Telecom Industry Revenue Share (%), by Deployment 2024 & 2032
- Figure 16: North America Operations Management in the Telecom Industry Revenue (Million), by Type 2024 & 2032
- Figure 17: North America Operations Management in the Telecom Industry Revenue Share (%), by Type 2024 & 2032
- Figure 18: North America Operations Management in the Telecom Industry Revenue (Million), by Country 2024 & 2032
- Figure 19: North America Operations Management in the Telecom Industry Revenue Share (%), by Country 2024 & 2032
- Figure 20: Europe Operations Management in the Telecom Industry Revenue (Million), by Deployment 2024 & 2032
- Figure 21: Europe Operations Management in the Telecom Industry Revenue Share (%), by Deployment 2024 & 2032
- Figure 22: Europe Operations Management in the Telecom Industry Revenue (Million), by Type 2024 & 2032
- Figure 23: Europe Operations Management in the Telecom Industry Revenue Share (%), by Type 2024 & 2032
- Figure 24: Europe Operations Management in the Telecom Industry Revenue (Million), by Country 2024 & 2032
- Figure 25: Europe Operations Management in the Telecom Industry Revenue Share (%), by Country 2024 & 2032
- Figure 26: Asia Pacific Operations Management in the Telecom Industry Revenue (Million), by Deployment 2024 & 2032
- Figure 27: Asia Pacific Operations Management in the Telecom Industry Revenue Share (%), by Deployment 2024 & 2032
- Figure 28: Asia Pacific Operations Management in the Telecom Industry Revenue (Million), by Type 2024 & 2032
- Figure 29: Asia Pacific Operations Management in the Telecom Industry Revenue Share (%), by Type 2024 & 2032
- Figure 30: Asia Pacific Operations Management in the Telecom Industry Revenue (Million), by Country 2024 & 2032
- Figure 31: Asia Pacific Operations Management in the Telecom Industry Revenue Share (%), by Country 2024 & 2032
- Figure 32: Latin America Operations Management in the Telecom Industry Revenue (Million), by Deployment 2024 & 2032
- Figure 33: Latin America Operations Management in the Telecom Industry Revenue Share (%), by Deployment 2024 & 2032
- Figure 34: Latin America Operations Management in the Telecom Industry Revenue (Million), by Type 2024 & 2032
- Figure 35: Latin America Operations Management in the Telecom Industry Revenue Share (%), by Type 2024 & 2032
- Figure 36: Latin America Operations Management in the Telecom Industry Revenue (Million), by Country 2024 & 2032
- Figure 37: Latin America Operations Management in the Telecom Industry Revenue Share (%), by Country 2024 & 2032
- Figure 38: Middle East and Africa Operations Management in the Telecom Industry Revenue (Million), by Deployment 2024 & 2032
- Figure 39: Middle East and Africa Operations Management in the Telecom Industry Revenue Share (%), by Deployment 2024 & 2032
- Figure 40: Middle East and Africa Operations Management in the Telecom Industry Revenue (Million), by Type 2024 & 2032
- Figure 41: Middle East and Africa Operations Management in the Telecom Industry Revenue Share (%), by Type 2024 & 2032
- Figure 42: Middle East and Africa Operations Management in the Telecom Industry Revenue (Million), by Country 2024 & 2032
- Figure 43: Middle East and Africa Operations Management in the Telecom Industry Revenue Share (%), by Country 2024 & 2032
List of Tables
- Table 1: Global Operations Management in the Telecom Industry Revenue Million Forecast, by Region 2019 & 2032
- Table 2: Global Operations Management in the Telecom Industry Revenue Million Forecast, by Deployment 2019 & 2032
- Table 3: Global Operations Management in the Telecom Industry Revenue Million Forecast, by Type 2019 & 2032
- Table 4: Global Operations Management in the Telecom Industry Revenue Million Forecast, by Region 2019 & 2032
- Table 5: Global Operations Management in the Telecom Industry Revenue Million Forecast, by Country 2019 & 2032
- Table 6: United States Operations Management in the Telecom Industry Revenue (Million) Forecast, by Application 2019 & 2032
- Table 7: Canada Operations Management in the Telecom Industry Revenue (Million) Forecast, by Application 2019 & 2032
- Table 8: Mexico Operations Management in the Telecom Industry Revenue (Million) Forecast, by Application 2019 & 2032
- Table 9: Global Operations Management in the Telecom Industry Revenue Million Forecast, by Country 2019 & 2032
- Table 10: Germany Operations Management in the Telecom Industry Revenue (Million) Forecast, by Application 2019 & 2032
- Table 11: United Kingdom Operations Management in the Telecom Industry Revenue (Million) Forecast, by Application 2019 & 2032
- Table 12: France Operations Management in the Telecom Industry Revenue (Million) Forecast, by Application 2019 & 2032
- Table 13: Spain Operations Management in the Telecom Industry Revenue (Million) Forecast, by Application 2019 & 2032
- Table 14: Italy Operations Management in the Telecom Industry Revenue (Million) Forecast, by Application 2019 & 2032
- Table 15: Spain Operations Management in the Telecom Industry Revenue (Million) Forecast, by Application 2019 & 2032
- Table 16: Belgium Operations Management in the Telecom Industry Revenue (Million) Forecast, by Application 2019 & 2032
- Table 17: Netherland Operations Management in the Telecom Industry Revenue (Million) Forecast, by Application 2019 & 2032
- Table 18: Nordics Operations Management in the Telecom Industry Revenue (Million) Forecast, by Application 2019 & 2032
- Table 19: Rest of Europe Operations Management in the Telecom Industry Revenue (Million) Forecast, by Application 2019 & 2032
- Table 20: Global Operations Management in the Telecom Industry Revenue Million Forecast, by Country 2019 & 2032
- Table 21: China Operations Management in the Telecom Industry Revenue (Million) Forecast, by Application 2019 & 2032
- Table 22: Japan Operations Management in the Telecom Industry Revenue (Million) Forecast, by Application 2019 & 2032
- Table 23: India Operations Management in the Telecom Industry Revenue (Million) Forecast, by Application 2019 & 2032
- Table 24: South Korea Operations Management in the Telecom Industry Revenue (Million) Forecast, by Application 2019 & 2032
- Table 25: Southeast Asia Operations Management in the Telecom Industry Revenue (Million) Forecast, by Application 2019 & 2032
- Table 26: Australia Operations Management in the Telecom Industry Revenue (Million) Forecast, by Application 2019 & 2032
- Table 27: Indonesia Operations Management in the Telecom Industry Revenue (Million) Forecast, by Application 2019 & 2032
- Table 28: Phillipes Operations Management in the Telecom Industry Revenue (Million) Forecast, by Application 2019 & 2032
- Table 29: Singapore Operations Management in the Telecom Industry Revenue (Million) Forecast, by Application 2019 & 2032
- Table 30: Thailandc Operations Management in the Telecom Industry Revenue (Million) Forecast, by Application 2019 & 2032
- Table 31: Rest of Asia Pacific Operations Management in the Telecom Industry Revenue (Million) Forecast, by Application 2019 & 2032
- Table 32: Global Operations Management in the Telecom Industry Revenue Million Forecast, by Country 2019 & 2032
- Table 33: Brazil Operations Management in the Telecom Industry Revenue (Million) Forecast, by Application 2019 & 2032
- Table 34: Argentina Operations Management in the Telecom Industry Revenue (Million) Forecast, by Application 2019 & 2032
- Table 35: Peru Operations Management in the Telecom Industry Revenue (Million) Forecast, by Application 2019 & 2032
- Table 36: Chile Operations Management in the Telecom Industry Revenue (Million) Forecast, by Application 2019 & 2032
- Table 37: Colombia Operations Management in the Telecom Industry Revenue (Million) Forecast, by Application 2019 & 2032
- Table 38: Ecuador Operations Management in the Telecom Industry Revenue (Million) Forecast, by Application 2019 & 2032
- Table 39: Venezuela Operations Management in the Telecom Industry Revenue (Million) Forecast, by Application 2019 & 2032
- Table 40: Rest of South America Operations Management in the Telecom Industry Revenue (Million) Forecast, by Application 2019 & 2032
- Table 41: Global Operations Management in the Telecom Industry Revenue Million Forecast, by Country 2019 & 2032
- Table 42: United States Operations Management in the Telecom Industry Revenue (Million) Forecast, by Application 2019 & 2032
- Table 43: Canada Operations Management in the Telecom Industry Revenue (Million) Forecast, by Application 2019 & 2032
- Table 44: Mexico Operations Management in the Telecom Industry Revenue (Million) Forecast, by Application 2019 & 2032
- Table 45: Global Operations Management in the Telecom Industry Revenue Million Forecast, by Country 2019 & 2032
- Table 46: United Arab Emirates Operations Management in the Telecom Industry Revenue (Million) Forecast, by Application 2019 & 2032
- Table 47: Saudi Arabia Operations Management in the Telecom Industry Revenue (Million) Forecast, by Application 2019 & 2032
- Table 48: South Africa Operations Management in the Telecom Industry Revenue (Million) Forecast, by Application 2019 & 2032
- Table 49: Rest of Middle East and Africa Operations Management in the Telecom Industry Revenue (Million) Forecast, by Application 2019 & 2032
- Table 50: Global Operations Management in the Telecom Industry Revenue Million Forecast, by Deployment 2019 & 2032
- Table 51: Global Operations Management in the Telecom Industry Revenue Million Forecast, by Type 2019 & 2032
- Table 52: Global Operations Management in the Telecom Industry Revenue Million Forecast, by Country 2019 & 2032
- Table 53: Global Operations Management in the Telecom Industry Revenue Million Forecast, by Deployment 2019 & 2032
- Table 54: Global Operations Management in the Telecom Industry Revenue Million Forecast, by Type 2019 & 2032
- Table 55: Global Operations Management in the Telecom Industry Revenue Million Forecast, by Country 2019 & 2032
- Table 56: Global Operations Management in the Telecom Industry Revenue Million Forecast, by Deployment 2019 & 2032
- Table 57: Global Operations Management in the Telecom Industry Revenue Million Forecast, by Type 2019 & 2032
- Table 58: Global Operations Management in the Telecom Industry Revenue Million Forecast, by Country 2019 & 2032
- Table 59: Global Operations Management in the Telecom Industry Revenue Million Forecast, by Deployment 2019 & 2032
- Table 60: Global Operations Management in the Telecom Industry Revenue Million Forecast, by Type 2019 & 2032
- Table 61: Global Operations Management in the Telecom Industry Revenue Million Forecast, by Country 2019 & 2032
- Table 62: Global Operations Management in the Telecom Industry Revenue Million Forecast, by Deployment 2019 & 2032
- Table 63: Global Operations Management in the Telecom Industry Revenue Million Forecast, by Type 2019 & 2032
- Table 64: Global Operations Management in the Telecom Industry Revenue Million Forecast, by Country 2019 & 2032
Frequently Asked Questions
1. What is the projected Compound Annual Growth Rate (CAGR) of the Operations Management in the Telecom Industry?
The projected CAGR is approximately 7.16%.
2. Which companies are prominent players in the Operations Management in the Telecom Industry?
Key companies in the market include Accenture PLC, Amdocs Inc, IBM Corporation, Telefonaktiebolaget LM Ericsson, Cisco Systems Inc, Hewlett Packard Enterprise Development LP, ServiceNow Inc, NEC Corporation, ZTE Corporation, Oracle Corporation, Comarch SA, Nokia Corporation, TATA Consultancy Services Limited*List Not Exhaustive, SAP SE, Netcracker Technology Corp.
3. What are the main segments of the Operations Management in the Telecom Industry?
The market segments include Deployment, Type.
4. Can you provide details about the market size?
The market size is estimated to be USD 77.65 Million as of 2022.
5. What are some drivers contributing to market growth?
Increasing Operational Costs and Complexity.
6. What are the notable trends driving market growth?
Cloud is Expected to Witness Significant Growth.
7. Are there any restraints impacting market growth?
; Stringent Government Regulations on Data Security.
8. Can you provide examples of recent developments in the market?
April 2022 - The Ministry of Railways and the Centre for Development of Telematics (C-DOT) have signed an MoU to modernize telecommunication in Indian Railways for public safety and security services. The MoU was signed for coordination, resource sharing, and to deliver and implement C-DOT's telecom solutions and services in the railway's network.
9. What pricing options are available for accessing the report?
Pricing options include single-user, multi-user, and enterprise licenses priced at USD 4750, USD 5250, and USD 8750 respectively.
10. Is the market size provided in terms of value or volume?
The market size is provided in terms of value, measured in Million.
11. Are there any specific market keywords associated with the report?
Yes, the market keyword associated with the report is "Operations Management in the Telecom Industry," which aids in identifying and referencing the specific market segment covered.
12. How do I determine which pricing option suits my needs best?
The pricing options vary based on user requirements and access needs. Individual users may opt for single-user licenses, while businesses requiring broader access may choose multi-user or enterprise licenses for cost-effective access to the report.
13. Are there any additional resources or data provided in the Operations Management in the Telecom Industry report?
While the report offers comprehensive insights, it's advisable to review the specific contents or supplementary materials provided to ascertain if additional resources or data are available.
14. How can I stay updated on further developments or reports in the Operations Management in the Telecom Industry?
To stay informed about further developments, trends, and reports in the Operations Management in the Telecom Industry, consider subscribing to industry newsletters, following relevant companies and organizations, or regularly checking reputable industry news sources and publications.
Methodology
Step 1 - Identification of Relevant Samples Size from Population Database


Step 2 - Approaches for Defining Global Market Size (Value, Volume* & Price*)

Note*: In applicable scenarios
Step 3 - Data Sources
Primary Research
- Web Analytics
- Survey Reports
- Research Institute
- Latest Research Reports
- Opinion Leaders
Secondary Research
- Annual Reports
- White Paper
- Latest Press Release
- Industry Association
- Paid Database
- Investor Presentations

Step 4 - Data Triangulation
Involves using different sources of information in order to increase the validity of a study
These sources are likely to be stakeholders in a program - participants, other researchers, program staff, other community members, and so on.
Then we put all data in single framework & apply various statistical tools to find out the dynamic on the market.
During the analysis stage, feedback from the stakeholder groups would be compared to determine areas of agreement as well as areas of divergence


