On-Site Photovoltaic Solar Power For Data Centers Market Market Analysis and Growth Roadmap

On-Site Photovoltaic Solar Power For Data Centers Market by Production Analysis, by Consumption Analysis, by Import Market Analysis (Value & Volume), by Export Market Analysis (Value & Volume), by Price Trend Analysis, by North America (United States, Canada, Rest of North America), by Europe (Germany, France, United Kingdom, Italy, Spain, NORDIC, Turkey, Russia, Rest of Europe), by Asia Pacific (China, India, Japan, Australia, Malaysia, Thailand, Indonesia, Vietnam, Rest of Asia Pacific), by South America (Brazil, Argentina, Chile, Colombia, Rest of South America), by Middle East and Africa (United Arab Emirates, Qatar, Saudi Arabia, South Africa, Nigeria, Egypt) Forecast 2025-2033

Jul 2 2025
Base Year: 2024

234 Pages
Main Logo

On-Site Photovoltaic Solar Power For Data Centers Market Market Analysis and Growth Roadmap


Home
Industries
Energy & Power
sponsor image
sponsor image
sponsor image
sponsor image
sponsor image

Tailored for you

  • In-depth Analysis Tailored to Specified Regions or Segments
  • Company Profiles Customized to User Preferences
  • Comprehensive Insights Focused on Specific Segments or Regions
  • Customized Evaluation of Competitive Landscape to Meet Your Needs
  • Tailored Customization to Address Other Specific Requirements
Ask for customization


Key Insights

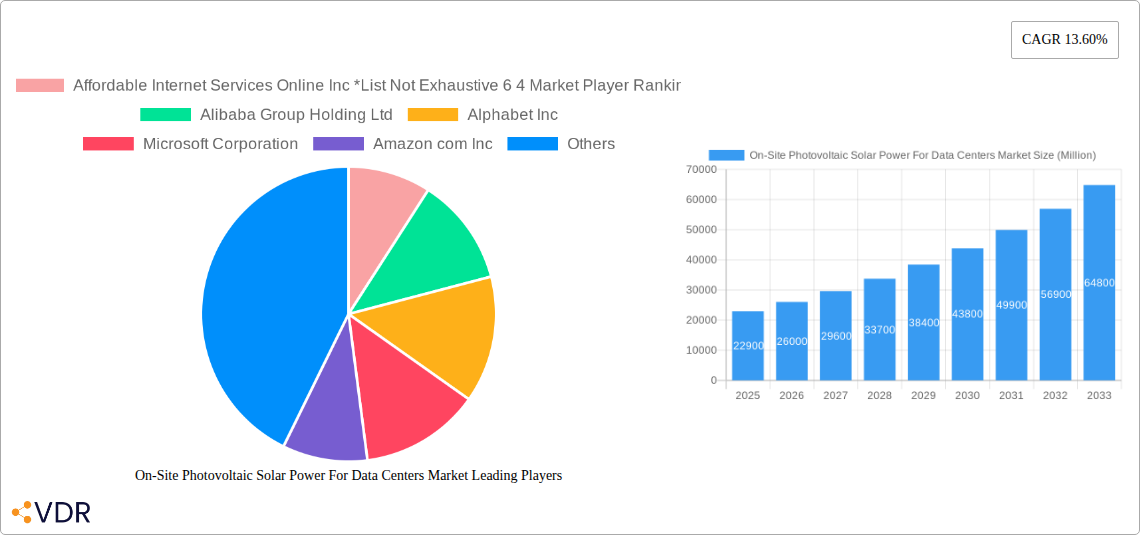
The On-Site Photovoltaic Solar Power for Data Centers market is experiencing robust growth, projected to reach $22.90 billion in 2025 and exhibiting a Compound Annual Growth Rate (CAGR) of 13.6% from 2025 to 2033. This expansion is driven by the increasing demand for renewable energy sources to power data centers, coupled with rising concerns about carbon emissions and the escalating costs of traditional grid electricity. The shift towards sustainable operations is a key driver, incentivized by government regulations and corporate sustainability initiatives. Thin-film and crystalline solar cell technologies are prominent, catering to varying data center needs and installation constraints. Data centers are the primary application segment, followed by telecom towers and other commercial applications. Major players like Alibaba, Alphabet, Microsoft, Amazon, and Facebook are actively integrating solar power solutions, influencing market growth through their technological advancements and large-scale deployments. Geographical distribution showcases strong growth across North America and Asia Pacific, driven by substantial data center infrastructure development in these regions. However, the market faces challenges such as initial high capital investment costs for on-site solar installations and potential grid integration complexities. Despite these challenges, the long-term cost savings and environmental benefits associated with solar power are expected to propel market growth throughout the forecast period.

The competitive landscape features a blend of established technology companies and specialized solar energy providers. The market's future trajectory will depend on continuous technological advancements (improving efficiency and reducing costs of solar panels), favorable government policies promoting renewable energy adoption, and the continued expansion of global data center infrastructure. The increasing focus on energy efficiency within data centers will further fuel the adoption of on-site solar power, ensuring sustainable and cost-effective operations. Furthermore, innovations in energy storage solutions are expected to address intermittent solar power generation challenges, bolstering the market's growth trajectory even further.

On-Site Photovoltaic Solar Power For Data Centers Market Research Report - Market Size, Growth & Forecast

On-Site Photovoltaic Solar Power for Data Centers Market: A Comprehensive Report (2019-2033)

This comprehensive report provides an in-depth analysis of the On-Site Photovoltaic (PV) Solar Power for Data Centers market, encompassing market dynamics, growth trends, regional segmentation, product landscape, key players, and future outlook. The study period spans from 2019 to 2033, with 2025 serving as the base and estimated year. This report is crucial for industry professionals, investors, and strategists seeking a complete understanding of this rapidly evolving sector. The parent market is the broader Renewable Energy Market, while the child market is specifically On-Site Solar Power Solutions for Commercial and Industrial applications. The market is expected to reach xx Million by 2033.

On-Site Photovoltaic Solar Power For Data Centers Market Market Dynamics & Structure

The On-Site Photovoltaic Solar Power for Data Centers market is characterized by increasing market concentration among key players, driven by technological advancements in solar cell efficiency and energy storage solutions. Stringent environmental regulations and rising energy costs are further fueling market growth. However, high initial investment costs and potential grid integration challenges pose barriers. Mergers and acquisitions are frequent, with larger players acquiring smaller, innovative companies to expand their market share and technological capabilities.

  • Market Concentration: The market is moderately concentrated, with a few major players holding significant shares. The top 6 players collectively hold approximately xx% of the market share in 2025.
  • Technological Innovation: Continuous advancements in thin-film and crystalline solar cell technologies, along with improvements in energy storage systems, are driving efficiency gains and cost reductions.
  • Regulatory Framework: Government incentives, such as tax credits and subsidies, are significantly boosting adoption. However, inconsistent regulatory frameworks across different regions create challenges.
  • Competitive Substitutes: Other renewable energy sources, such as wind power and geothermal energy, pose competition. However, the inherent advantages of on-site solar power, including reduced reliance on the grid and potential for self-sufficiency, remain compelling.
  • End-User Demographics: Large-scale data centers, particularly those operated by hyperscale cloud providers, are the primary end-users. The increasing number of data centers globally directly translates to increased demand.
  • M&A Trends: The number of M&A deals in the sector has increased significantly in recent years (xx deals in 2024), indicating consolidation and expansion efforts by leading players.

On-Site Photovoltaic Solar Power For Data Centers Market Growth Trends & Insights

The On-Site Photovoltaic Solar Power for Data Centers market has witnessed substantial growth over the past few years, driven by a confluence of factors. The market size increased from xx Million in 2019 to xx Million in 2024, demonstrating a Compound Annual Growth Rate (CAGR) of xx%. This growth is expected to continue, with a projected CAGR of xx% from 2025 to 2033, leading to a market size of xx Million by 2033. This expansion is largely fueled by the increasing demand for sustainable energy solutions within the data center industry, coupled with decreasing solar energy costs and improving technological efficiency. Adoption rates have risen significantly, particularly amongst environmentally conscious companies and those aiming to reduce operational expenses. The market penetration rate is projected to increase from xx% in 2025 to xx% by 2033. Technological advancements, particularly in solar panel efficiency and energy storage, are major contributors to this growth trajectory. Shifting consumer preferences towards environmentally responsible practices also play a significant role.

On-Site Photovoltaic Solar Power For Data Centers Market Growth

Dominant Regions, Countries, or Segments in On-Site Photovoltaic Solar Power For Data Centers Market

The North American and European regions currently dominate the On-Site Photovoltaic Solar Power for Data Centers market, driven by supportive government policies, robust infrastructure, and a high concentration of data centers. However, Asia-Pacific is emerging as a significant growth region, fueled by rapid economic expansion and increasing energy demands. Within the segments, crystalline solar cells currently hold a larger market share than thin-film solar cells due to higher efficiency and reliability. Data centers constitute the largest application segment.

  • Key Drivers:

    • Supportive Government Policies: Tax incentives, renewable energy mandates, and feed-in tariffs are promoting adoption.
    • Robust Infrastructure: Developed power grids and readily available installation expertise facilitate deployment.
    • High Concentration of Data Centers: The presence of major cloud providers and data center hubs drives demand.
  • Dominance Factors: North America and Europe benefit from a combination of factors including established renewable energy markets, favorable regulatory environments, and a significant presence of major technology companies. Asia-Pacific is experiencing rapid growth due to increasing data center construction and rising energy costs. Crystalline solar cells maintain a larger market share due to their higher efficiency and reliability.

On-Site Photovoltaic Solar Power For Data Centers Market Product Landscape

The market features a diverse range of solar PV systems tailored for data centers, including roof-mounted and ground-mounted solutions with varying capacities and configurations. Product innovation centers on higher efficiency solar panels, improved energy storage systems, and smart grid integration capabilities. Key selling propositions include reduced operational costs, enhanced energy security, and a reduced carbon footprint. Technological advancements focus on increasing efficiency, reducing production costs, and improving durability of solar panels.

Key Drivers, Barriers & Challenges in On-Site Photovoltaic Solar Power For Data Centers Market

Key Drivers: The primary drivers include the increasing need to reduce carbon emissions, rising energy costs, supportive government policies (e.g., tax credits and subsidies), and technological advancements resulting in higher efficiency and lower costs of solar PV systems. Furthermore, the growing awareness of the environmental impact of data centers pushes the adoption of sustainable energy solutions.

Key Challenges: High initial investment costs, the need for specialized technical expertise for installation and maintenance, and potential grid integration challenges act as significant barriers. Supply chain disruptions can affect the availability of components, while inconsistent regulatory frameworks across different regions create uncertainty. The competitiveness of other renewable energy solutions also poses a challenge.

Emerging Opportunities in On-Site Photovoltaic Solar Power For Data Centers Market

Emerging opportunities include the expansion into underserved markets, particularly in developing economies, the growing adoption of hybrid energy systems, incorporating energy storage solutions, and the increasing demand for microgrid solutions. Innovative applications, such as utilizing solar energy for cooling systems, offer significant potential. The growing focus on corporate social responsibility is also creating new avenues for market growth.

Growth Accelerators in the On-Site Photovoltaic Solar Power For Data Centers Market Industry

Technological breakthroughs in solar cell efficiency and battery storage are crucial growth accelerators. Strategic partnerships between solar energy providers and data center operators are fostering rapid adoption. Expansion into new geographical markets with growing data center infrastructure is also contributing significantly to market growth.

Key Players Shaping the On-Site Photovoltaic Solar Power For Data Centers Market Market

  • Affordable Internet Services Online Inc
  • Alibaba Group Holding Ltd
  • Alphabet Inc
  • Microsoft Corporation
  • Amazon.com Inc
  • Facebook Inc
  • Dell Technologies Inc

Notable Milestones in On-Site Photovoltaic Solar Power For Data Centers Market Sector

  • September 2023: Power Capital Renewable Energy (PCRE) signs a 58 MW solar PPA with Google in Ireland.
  • August 2023: SCC installs a 737kWp solar PV system on its Birmingham data center.

In-Depth On-Site Photovoltaic Solar Power For Data Centers Market Market Outlook

The On-Site Photovoltaic Solar Power for Data Centers market is poised for significant growth, driven by a combination of factors including increasing environmental concerns, technological advancements, and supportive government policies. Strategic partnerships, technological innovation, and expansion into new markets will be key to unlocking the full potential of this sector. The market presents attractive investment opportunities for companies focused on sustainable energy solutions and those committed to minimizing their environmental impact.

On-Site Photovoltaic Solar Power For Data Centers Market Segmentation

  • 1. Production Analysis
  • 2. Consumption Analysis
  • 3. Import Market Analysis (Value & Volume)
  • 4. Export Market Analysis (Value & Volume)
  • 5. Price Trend Analysis

On-Site Photovoltaic Solar Power For Data Centers Market Segmentation By Geography

  • 1. North America
    • 1.1. United States
    • 1.2. Canada
    • 1.3. Rest of North America
  • 2. Europe
    • 2.1. Germany
    • 2.2. France
    • 2.3. United Kingdom
    • 2.4. Italy
    • 2.5. Spain
    • 2.6. NORDIC
    • 2.7. Turkey
    • 2.8. Russia
    • 2.9. Rest of Europe
  • 3. Asia Pacific
    • 3.1. China
    • 3.2. India
    • 3.3. Japan
    • 3.4. Australia
    • 3.5. Malaysia
    • 3.6. Thailand
    • 3.7. Indonesia
    • 3.8. Vietnam
    • 3.9. Rest of Asia Pacific
  • 4. South America
    • 4.1. Brazil
    • 4.2. Argentina
    • 4.3. Chile
    • 4.4. Colombia
    • 4.5. Rest of South America
  • 5. Middle East and Africa
    • 5.1. United Arab Emirates
    • 5.2. Qatar
    • 5.3. Saudi Arabia
    • 5.4. South Africa
    • 5.5. Nigeria
    • 5.6. Egypt
On-Site Photovoltaic Solar Power For Data Centers Market Regional Share


On-Site Photovoltaic Solar Power For Data Centers Market REPORT HIGHLIGHTS

AspectsDetails
Study Period 2019-2033
Base Year 2024
Estimated Year 2025
Forecast Period2025-2033
Historical Period2019-2024
Growth RateCAGR of 13.60% from 2019-2033
Segmentation
    • By Production Analysis
    • By Consumption Analysis
    • By Import Market Analysis (Value & Volume)
    • By Export Market Analysis (Value & Volume)
    • By Price Trend Analysis
  • By Geography
    • North America
      • United States
      • Canada
      • Rest of North America
    • Europe
      • Germany
      • France
      • United Kingdom
      • Italy
      • Spain
      • NORDIC
      • Turkey
      • Russia
      • Rest of Europe
    • Asia Pacific
      • China
      • India
      • Japan
      • Australia
      • Malaysia
      • Thailand
      • Indonesia
      • Vietnam
      • Rest of Asia Pacific
    • South America
      • Brazil
      • Argentina
      • Chile
      • Colombia
      • Rest of South America
    • Middle East and Africa
      • United Arab Emirates
      • Qatar
      • Saudi Arabia
      • South Africa
      • Nigeria
      • Egypt


Table of Contents

  1. 1. Introduction
    • 1.1. Research Scope
    • 1.2. Market Segmentation
    • 1.3. Research Methodology
    • 1.4. Definitions and Assumptions
  2. 2. Executive Summary
    • 2.1. Introduction
  3. 3. Market Dynamics
    • 3.1. Introduction
      • 3.2. Market Drivers
        • 3.2.1. 4.; Decreasing Solar Power Installation Costs 4.; Growing focus on Implementing Sustainable Business Practices
      • 3.3. Market Restrains
        • 3.3.1. 4.; Lack of Space for Small Data Centers to Install Solar Panels
      • 3.4. Market Trends
        • 3.4.1. Decrease in Solar Power Installation Cost is Likely to Drive the Market
  4. 4. Market Factor Analysis
    • 4.1. Porters Five Forces
    • 4.2. Supply/Value Chain
    • 4.3. PESTEL analysis
    • 4.4. Market Entropy
    • 4.5. Patent/Trademark Analysis
  5. 5. Global On-Site Photovoltaic Solar Power For Data Centers Market Analysis, Insights and Forecast, 2019-2031
    • 5.1. Market Analysis, Insights and Forecast - by Production Analysis
      • 5.2. Market Analysis, Insights and Forecast - by Consumption Analysis
        • 5.3. Market Analysis, Insights and Forecast - by Import Market Analysis (Value & Volume)
          • 5.4. Market Analysis, Insights and Forecast - by Export Market Analysis (Value & Volume)
            • 5.5. Market Analysis, Insights and Forecast - by Price Trend Analysis
              • 5.6. Market Analysis, Insights and Forecast - by Region
                • 5.6.1. North America
                • 5.6.2. Europe
                • 5.6.3. Asia Pacific
                • 5.6.4. South America
                • 5.6.5. Middle East and Africa
            • 6. North America On-Site Photovoltaic Solar Power For Data Centers Market Analysis, Insights and Forecast, 2019-2031
              • 6.1. Market Analysis, Insights and Forecast - by Production Analysis
                • 6.2. Market Analysis, Insights and Forecast - by Consumption Analysis
                  • 6.3. Market Analysis, Insights and Forecast - by Import Market Analysis (Value & Volume)
                    • 6.4. Market Analysis, Insights and Forecast - by Export Market Analysis (Value & Volume)
                      • 6.5. Market Analysis, Insights and Forecast - by Price Trend Analysis
                      • 7. Europe On-Site Photovoltaic Solar Power For Data Centers Market Analysis, Insights and Forecast, 2019-2031
                        • 7.1. Market Analysis, Insights and Forecast - by Production Analysis
                          • 7.2. Market Analysis, Insights and Forecast - by Consumption Analysis
                            • 7.3. Market Analysis, Insights and Forecast - by Import Market Analysis (Value & Volume)
                              • 7.4. Market Analysis, Insights and Forecast - by Export Market Analysis (Value & Volume)
                                • 7.5. Market Analysis, Insights and Forecast - by Price Trend Analysis
                                • 8. Asia Pacific On-Site Photovoltaic Solar Power For Data Centers Market Analysis, Insights and Forecast, 2019-2031
                                  • 8.1. Market Analysis, Insights and Forecast - by Production Analysis
                                    • 8.2. Market Analysis, Insights and Forecast - by Consumption Analysis
                                      • 8.3. Market Analysis, Insights and Forecast - by Import Market Analysis (Value & Volume)
                                        • 8.4. Market Analysis, Insights and Forecast - by Export Market Analysis (Value & Volume)
                                          • 8.5. Market Analysis, Insights and Forecast - by Price Trend Analysis
                                          • 9. South America On-Site Photovoltaic Solar Power For Data Centers Market Analysis, Insights and Forecast, 2019-2031
                                            • 9.1. Market Analysis, Insights and Forecast - by Production Analysis
                                              • 9.2. Market Analysis, Insights and Forecast - by Consumption Analysis
                                                • 9.3. Market Analysis, Insights and Forecast - by Import Market Analysis (Value & Volume)
                                                  • 9.4. Market Analysis, Insights and Forecast - by Export Market Analysis (Value & Volume)
                                                    • 9.5. Market Analysis, Insights and Forecast - by Price Trend Analysis
                                                    • 10. Middle East and Africa On-Site Photovoltaic Solar Power For Data Centers Market Analysis, Insights and Forecast, 2019-2031
                                                      • 10.1. Market Analysis, Insights and Forecast - by Production Analysis
                                                        • 10.2. Market Analysis, Insights and Forecast - by Consumption Analysis
                                                          • 10.3. Market Analysis, Insights and Forecast - by Import Market Analysis (Value & Volume)
                                                            • 10.4. Market Analysis, Insights and Forecast - by Export Market Analysis (Value & Volume)
                                                              • 10.5. Market Analysis, Insights and Forecast - by Price Trend Analysis
                                                              • 11. North America On-Site Photovoltaic Solar Power For Data Centers Market Analysis, Insights and Forecast, 2019-2031
                                                                  • 11.1. Market Analysis, Insights and Forecast - By Country/Sub-region
                                                                    • 11.1.1 United States
                                                                    • 11.1.2 Canada
                                                                    • 11.1.3 Mexico
                                                              • 12. Europe On-Site Photovoltaic Solar Power For Data Centers Market Analysis, Insights and Forecast, 2019-2031
                                                                  • 12.1. Market Analysis, Insights and Forecast - By Country/Sub-region
                                                                    • 12.1.1 Germany
                                                                    • 12.1.2 United Kingdom
                                                                    • 12.1.3 France
                                                                    • 12.1.4 Spain
                                                                    • 12.1.5 Italy
                                                                    • 12.1.6 Spain
                                                                    • 12.1.7 Belgium
                                                                    • 12.1.8 Netherland
                                                                    • 12.1.9 Nordics
                                                                    • 12.1.10 Rest of Europe
                                                              • 13. Asia Pacific On-Site Photovoltaic Solar Power For Data Centers Market Analysis, Insights and Forecast, 2019-2031
                                                                  • 13.1. Market Analysis, Insights and Forecast - By Country/Sub-region
                                                                    • 13.1.1 China
                                                                    • 13.1.2 Japan
                                                                    • 13.1.3 India
                                                                    • 13.1.4 South Korea
                                                                    • 13.1.5 Southeast Asia
                                                                    • 13.1.6 Australia
                                                                    • 13.1.7 Indonesia
                                                                    • 13.1.8 Phillipes
                                                                    • 13.1.9 Singapore
                                                                    • 13.1.10 Thailandc
                                                                    • 13.1.11 Rest of Asia Pacific
                                                              • 14. South America On-Site Photovoltaic Solar Power For Data Centers Market Analysis, Insights and Forecast, 2019-2031
                                                                  • 14.1. Market Analysis, Insights and Forecast - By Country/Sub-region
                                                                    • 14.1.1 Brazil
                                                                    • 14.1.2 Argentina
                                                                    • 14.1.3 Peru
                                                                    • 14.1.4 Chile
                                                                    • 14.1.5 Colombia
                                                                    • 14.1.6 Ecuador
                                                                    • 14.1.7 Venezuela
                                                                    • 14.1.8 Rest of South America
                                                              • 15. MEA On-Site Photovoltaic Solar Power For Data Centers Market Analysis, Insights and Forecast, 2019-2031
                                                                  • 15.1. Market Analysis, Insights and Forecast - By Country/Sub-region
                                                                    • 15.1.1 United Arab Emirates
                                                                    • 15.1.2 Saudi Arabia
                                                                    • 15.1.3 South Africa
                                                                    • 15.1.4 Rest of Middle East and Africa
                                                              • 16. Competitive Analysis
                                                                • 16.1. Global Market Share Analysis 2024
                                                                  • 16.2. Company Profiles
                                                                    • 16.2.1 Affordable Internet Services Online Inc *List Not Exhaustive 6 4 Market Player Rankin
                                                                      • 16.2.1.1. Overview
                                                                      • 16.2.1.2. Products
                                                                      • 16.2.1.3. SWOT Analysis
                                                                      • 16.2.1.4. Recent Developments
                                                                      • 16.2.1.5. Financials (Based on Availability)
                                                                    • 16.2.2 Alibaba Group Holding Ltd
                                                                      • 16.2.2.1. Overview
                                                                      • 16.2.2.2. Products
                                                                      • 16.2.2.3. SWOT Analysis
                                                                      • 16.2.2.4. Recent Developments
                                                                      • 16.2.2.5. Financials (Based on Availability)
                                                                    • 16.2.3 Alphabet Inc
                                                                      • 16.2.3.1. Overview
                                                                      • 16.2.3.2. Products
                                                                      • 16.2.3.3. SWOT Analysis
                                                                      • 16.2.3.4. Recent Developments
                                                                      • 16.2.3.5. Financials (Based on Availability)
                                                                    • 16.2.4 Microsoft Corporation
                                                                      • 16.2.4.1. Overview
                                                                      • 16.2.4.2. Products
                                                                      • 16.2.4.3. SWOT Analysis
                                                                      • 16.2.4.4. Recent Developments
                                                                      • 16.2.4.5. Financials (Based on Availability)
                                                                    • 16.2.5 Amazon com Inc
                                                                      • 16.2.5.1. Overview
                                                                      • 16.2.5.2. Products
                                                                      • 16.2.5.3. SWOT Analysis
                                                                      • 16.2.5.4. Recent Developments
                                                                      • 16.2.5.5. Financials (Based on Availability)
                                                                    • 16.2.6 Facebook Inc
                                                                      • 16.2.6.1. Overview
                                                                      • 16.2.6.2. Products
                                                                      • 16.2.6.3. SWOT Analysis
                                                                      • 16.2.6.4. Recent Developments
                                                                      • 16.2.6.5. Financials (Based on Availability)
                                                                    • 16.2.7 Dell Technologies Inc
                                                                      • 16.2.7.1. Overview
                                                                      • 16.2.7.2. Products
                                                                      • 16.2.7.3. SWOT Analysis
                                                                      • 16.2.7.4. Recent Developments
                                                                      • 16.2.7.5. Financials (Based on Availability)

                                                              List of Figures

                                                              1. Figure 1: Global On-Site Photovoltaic Solar Power For Data Centers Market Revenue Breakdown (Million, %) by Region 2024 & 2032
                                                              2. Figure 2: North America On-Site Photovoltaic Solar Power For Data Centers Market Revenue (Million), by Country 2024 & 2032
                                                              3. Figure 3: North America On-Site Photovoltaic Solar Power For Data Centers Market Revenue Share (%), by Country 2024 & 2032
                                                              4. Figure 4: Europe On-Site Photovoltaic Solar Power For Data Centers Market Revenue (Million), by Country 2024 & 2032
                                                              5. Figure 5: Europe On-Site Photovoltaic Solar Power For Data Centers Market Revenue Share (%), by Country 2024 & 2032
                                                              6. Figure 6: Asia Pacific On-Site Photovoltaic Solar Power For Data Centers Market Revenue (Million), by Country 2024 & 2032
                                                              7. Figure 7: Asia Pacific On-Site Photovoltaic Solar Power For Data Centers Market Revenue Share (%), by Country 2024 & 2032
                                                              8. Figure 8: South America On-Site Photovoltaic Solar Power For Data Centers Market Revenue (Million), by Country 2024 & 2032
                                                              9. Figure 9: South America On-Site Photovoltaic Solar Power For Data Centers Market Revenue Share (%), by Country 2024 & 2032
                                                              10. Figure 10: MEA On-Site Photovoltaic Solar Power For Data Centers Market Revenue (Million), by Country 2024 & 2032
                                                              11. Figure 11: MEA On-Site Photovoltaic Solar Power For Data Centers Market Revenue Share (%), by Country 2024 & 2032
                                                              12. Figure 12: North America On-Site Photovoltaic Solar Power For Data Centers Market Revenue (Million), by Production Analysis 2024 & 2032
                                                              13. Figure 13: North America On-Site Photovoltaic Solar Power For Data Centers Market Revenue Share (%), by Production Analysis 2024 & 2032
                                                              14. Figure 14: North America On-Site Photovoltaic Solar Power For Data Centers Market Revenue (Million), by Consumption Analysis 2024 & 2032
                                                              15. Figure 15: North America On-Site Photovoltaic Solar Power For Data Centers Market Revenue Share (%), by Consumption Analysis 2024 & 2032
                                                              16. Figure 16: North America On-Site Photovoltaic Solar Power For Data Centers Market Revenue (Million), by Import Market Analysis (Value & Volume) 2024 & 2032
                                                              17. Figure 17: North America On-Site Photovoltaic Solar Power For Data Centers Market Revenue Share (%), by Import Market Analysis (Value & Volume) 2024 & 2032
                                                              18. Figure 18: North America On-Site Photovoltaic Solar Power For Data Centers Market Revenue (Million), by Export Market Analysis (Value & Volume) 2024 & 2032
                                                              19. Figure 19: North America On-Site Photovoltaic Solar Power For Data Centers Market Revenue Share (%), by Export Market Analysis (Value & Volume) 2024 & 2032
                                                              20. Figure 20: North America On-Site Photovoltaic Solar Power For Data Centers Market Revenue (Million), by Price Trend Analysis 2024 & 2032
                                                              21. Figure 21: North America On-Site Photovoltaic Solar Power For Data Centers Market Revenue Share (%), by Price Trend Analysis 2024 & 2032
                                                              22. Figure 22: North America On-Site Photovoltaic Solar Power For Data Centers Market Revenue (Million), by Country 2024 & 2032
                                                              23. Figure 23: North America On-Site Photovoltaic Solar Power For Data Centers Market Revenue Share (%), by Country 2024 & 2032
                                                              24. Figure 24: Europe On-Site Photovoltaic Solar Power For Data Centers Market Revenue (Million), by Production Analysis 2024 & 2032
                                                              25. Figure 25: Europe On-Site Photovoltaic Solar Power For Data Centers Market Revenue Share (%), by Production Analysis 2024 & 2032
                                                              26. Figure 26: Europe On-Site Photovoltaic Solar Power For Data Centers Market Revenue (Million), by Consumption Analysis 2024 & 2032
                                                              27. Figure 27: Europe On-Site Photovoltaic Solar Power For Data Centers Market Revenue Share (%), by Consumption Analysis 2024 & 2032
                                                              28. Figure 28: Europe On-Site Photovoltaic Solar Power For Data Centers Market Revenue (Million), by Import Market Analysis (Value & Volume) 2024 & 2032
                                                              29. Figure 29: Europe On-Site Photovoltaic Solar Power For Data Centers Market Revenue Share (%), by Import Market Analysis (Value & Volume) 2024 & 2032
                                                              30. Figure 30: Europe On-Site Photovoltaic Solar Power For Data Centers Market Revenue (Million), by Export Market Analysis (Value & Volume) 2024 & 2032
                                                              31. Figure 31: Europe On-Site Photovoltaic Solar Power For Data Centers Market Revenue Share (%), by Export Market Analysis (Value & Volume) 2024 & 2032
                                                              32. Figure 32: Europe On-Site Photovoltaic Solar Power For Data Centers Market Revenue (Million), by Price Trend Analysis 2024 & 2032
                                                              33. Figure 33: Europe On-Site Photovoltaic Solar Power For Data Centers Market Revenue Share (%), by Price Trend Analysis 2024 & 2032
                                                              34. Figure 34: Europe On-Site Photovoltaic Solar Power For Data Centers Market Revenue (Million), by Country 2024 & 2032
                                                              35. Figure 35: Europe On-Site Photovoltaic Solar Power For Data Centers Market Revenue Share (%), by Country 2024 & 2032
                                                              36. Figure 36: Asia Pacific On-Site Photovoltaic Solar Power For Data Centers Market Revenue (Million), by Production Analysis 2024 & 2032
                                                              37. Figure 37: Asia Pacific On-Site Photovoltaic Solar Power For Data Centers Market Revenue Share (%), by Production Analysis 2024 & 2032
                                                              38. Figure 38: Asia Pacific On-Site Photovoltaic Solar Power For Data Centers Market Revenue (Million), by Consumption Analysis 2024 & 2032
                                                              39. Figure 39: Asia Pacific On-Site Photovoltaic Solar Power For Data Centers Market Revenue Share (%), by Consumption Analysis 2024 & 2032
                                                              40. Figure 40: Asia Pacific On-Site Photovoltaic Solar Power For Data Centers Market Revenue (Million), by Import Market Analysis (Value & Volume) 2024 & 2032
                                                              41. Figure 41: Asia Pacific On-Site Photovoltaic Solar Power For Data Centers Market Revenue Share (%), by Import Market Analysis (Value & Volume) 2024 & 2032
                                                              42. Figure 42: Asia Pacific On-Site Photovoltaic Solar Power For Data Centers Market Revenue (Million), by Export Market Analysis (Value & Volume) 2024 & 2032
                                                              43. Figure 43: Asia Pacific On-Site Photovoltaic Solar Power For Data Centers Market Revenue Share (%), by Export Market Analysis (Value & Volume) 2024 & 2032
                                                              44. Figure 44: Asia Pacific On-Site Photovoltaic Solar Power For Data Centers Market Revenue (Million), by Price Trend Analysis 2024 & 2032
                                                              45. Figure 45: Asia Pacific On-Site Photovoltaic Solar Power For Data Centers Market Revenue Share (%), by Price Trend Analysis 2024 & 2032
                                                              46. Figure 46: Asia Pacific On-Site Photovoltaic Solar Power For Data Centers Market Revenue (Million), by Country 2024 & 2032
                                                              47. Figure 47: Asia Pacific On-Site Photovoltaic Solar Power For Data Centers Market Revenue Share (%), by Country 2024 & 2032
                                                              48. Figure 48: South America On-Site Photovoltaic Solar Power For Data Centers Market Revenue (Million), by Production Analysis 2024 & 2032
                                                              49. Figure 49: South America On-Site Photovoltaic Solar Power For Data Centers Market Revenue Share (%), by Production Analysis 2024 & 2032
                                                              50. Figure 50: South America On-Site Photovoltaic Solar Power For Data Centers Market Revenue (Million), by Consumption Analysis 2024 & 2032
                                                              51. Figure 51: South America On-Site Photovoltaic Solar Power For Data Centers Market Revenue Share (%), by Consumption Analysis 2024 & 2032
                                                              52. Figure 52: South America On-Site Photovoltaic Solar Power For Data Centers Market Revenue (Million), by Import Market Analysis (Value & Volume) 2024 & 2032
                                                              53. Figure 53: South America On-Site Photovoltaic Solar Power For Data Centers Market Revenue Share (%), by Import Market Analysis (Value & Volume) 2024 & 2032
                                                              54. Figure 54: South America On-Site Photovoltaic Solar Power For Data Centers Market Revenue (Million), by Export Market Analysis (Value & Volume) 2024 & 2032
                                                              55. Figure 55: South America On-Site Photovoltaic Solar Power For Data Centers Market Revenue Share (%), by Export Market Analysis (Value & Volume) 2024 & 2032
                                                              56. Figure 56: South America On-Site Photovoltaic Solar Power For Data Centers Market Revenue (Million), by Price Trend Analysis 2024 & 2032
                                                              57. Figure 57: South America On-Site Photovoltaic Solar Power For Data Centers Market Revenue Share (%), by Price Trend Analysis 2024 & 2032
                                                              58. Figure 58: South America On-Site Photovoltaic Solar Power For Data Centers Market Revenue (Million), by Country 2024 & 2032
                                                              59. Figure 59: South America On-Site Photovoltaic Solar Power For Data Centers Market Revenue Share (%), by Country 2024 & 2032
                                                              60. Figure 60: Middle East and Africa On-Site Photovoltaic Solar Power For Data Centers Market Revenue (Million), by Production Analysis 2024 & 2032
                                                              61. Figure 61: Middle East and Africa On-Site Photovoltaic Solar Power For Data Centers Market Revenue Share (%), by Production Analysis 2024 & 2032
                                                              62. Figure 62: Middle East and Africa On-Site Photovoltaic Solar Power For Data Centers Market Revenue (Million), by Consumption Analysis 2024 & 2032
                                                              63. Figure 63: Middle East and Africa On-Site Photovoltaic Solar Power For Data Centers Market Revenue Share (%), by Consumption Analysis 2024 & 2032
                                                              64. Figure 64: Middle East and Africa On-Site Photovoltaic Solar Power For Data Centers Market Revenue (Million), by Import Market Analysis (Value & Volume) 2024 & 2032
                                                              65. Figure 65: Middle East and Africa On-Site Photovoltaic Solar Power For Data Centers Market Revenue Share (%), by Import Market Analysis (Value & Volume) 2024 & 2032
                                                              66. Figure 66: Middle East and Africa On-Site Photovoltaic Solar Power For Data Centers Market Revenue (Million), by Export Market Analysis (Value & Volume) 2024 & 2032
                                                              67. Figure 67: Middle East and Africa On-Site Photovoltaic Solar Power For Data Centers Market Revenue Share (%), by Export Market Analysis (Value & Volume) 2024 & 2032
                                                              68. Figure 68: Middle East and Africa On-Site Photovoltaic Solar Power For Data Centers Market Revenue (Million), by Price Trend Analysis 2024 & 2032
                                                              69. Figure 69: Middle East and Africa On-Site Photovoltaic Solar Power For Data Centers Market Revenue Share (%), by Price Trend Analysis 2024 & 2032
                                                              70. Figure 70: Middle East and Africa On-Site Photovoltaic Solar Power For Data Centers Market Revenue (Million), by Country 2024 & 2032
                                                              71. Figure 71: Middle East and Africa On-Site Photovoltaic Solar Power For Data Centers Market Revenue Share (%), by Country 2024 & 2032

                                                              List of Tables

                                                              1. Table 1: Global On-Site Photovoltaic Solar Power For Data Centers Market Revenue Million Forecast, by Region 2019 & 2032
                                                              2. Table 2: Global On-Site Photovoltaic Solar Power For Data Centers Market Revenue Million Forecast, by Production Analysis 2019 & 2032
                                                              3. Table 3: Global On-Site Photovoltaic Solar Power For Data Centers Market Revenue Million Forecast, by Consumption Analysis 2019 & 2032
                                                              4. Table 4: Global On-Site Photovoltaic Solar Power For Data Centers Market Revenue Million Forecast, by Import Market Analysis (Value & Volume) 2019 & 2032
                                                              5. Table 5: Global On-Site Photovoltaic Solar Power For Data Centers Market Revenue Million Forecast, by Export Market Analysis (Value & Volume) 2019 & 2032
                                                              6. Table 6: Global On-Site Photovoltaic Solar Power For Data Centers Market Revenue Million Forecast, by Price Trend Analysis 2019 & 2032
                                                              7. Table 7: Global On-Site Photovoltaic Solar Power For Data Centers Market Revenue Million Forecast, by Region 2019 & 2032
                                                              8. Table 8: Global On-Site Photovoltaic Solar Power For Data Centers Market Revenue Million Forecast, by Country 2019 & 2032
                                                              9. Table 9: United States On-Site Photovoltaic Solar Power For Data Centers Market Revenue (Million) Forecast, by Application 2019 & 2032
                                                              10. Table 10: Canada On-Site Photovoltaic Solar Power For Data Centers Market Revenue (Million) Forecast, by Application 2019 & 2032
                                                              11. Table 11: Mexico On-Site Photovoltaic Solar Power For Data Centers Market Revenue (Million) Forecast, by Application 2019 & 2032
                                                              12. Table 12: Global On-Site Photovoltaic Solar Power For Data Centers Market Revenue Million Forecast, by Country 2019 & 2032
                                                              13. Table 13: Germany On-Site Photovoltaic Solar Power For Data Centers Market Revenue (Million) Forecast, by Application 2019 & 2032
                                                              14. Table 14: United Kingdom On-Site Photovoltaic Solar Power For Data Centers Market Revenue (Million) Forecast, by Application 2019 & 2032
                                                              15. Table 15: France On-Site Photovoltaic Solar Power For Data Centers Market Revenue (Million) Forecast, by Application 2019 & 2032
                                                              16. Table 16: Spain On-Site Photovoltaic Solar Power For Data Centers Market Revenue (Million) Forecast, by Application 2019 & 2032
                                                              17. Table 17: Italy On-Site Photovoltaic Solar Power For Data Centers Market Revenue (Million) Forecast, by Application 2019 & 2032
                                                              18. Table 18: Spain On-Site Photovoltaic Solar Power For Data Centers Market Revenue (Million) Forecast, by Application 2019 & 2032
                                                              19. Table 19: Belgium On-Site Photovoltaic Solar Power For Data Centers Market Revenue (Million) Forecast, by Application 2019 & 2032
                                                              20. Table 20: Netherland On-Site Photovoltaic Solar Power For Data Centers Market Revenue (Million) Forecast, by Application 2019 & 2032
                                                              21. Table 21: Nordics On-Site Photovoltaic Solar Power For Data Centers Market Revenue (Million) Forecast, by Application 2019 & 2032
                                                              22. Table 22: Rest of Europe On-Site Photovoltaic Solar Power For Data Centers Market Revenue (Million) Forecast, by Application 2019 & 2032
                                                              23. Table 23: Global On-Site Photovoltaic Solar Power For Data Centers Market Revenue Million Forecast, by Country 2019 & 2032
                                                              24. Table 24: China On-Site Photovoltaic Solar Power For Data Centers Market Revenue (Million) Forecast, by Application 2019 & 2032
                                                              25. Table 25: Japan On-Site Photovoltaic Solar Power For Data Centers Market Revenue (Million) Forecast, by Application 2019 & 2032
                                                              26. Table 26: India On-Site Photovoltaic Solar Power For Data Centers Market Revenue (Million) Forecast, by Application 2019 & 2032
                                                              27. Table 27: South Korea On-Site Photovoltaic Solar Power For Data Centers Market Revenue (Million) Forecast, by Application 2019 & 2032
                                                              28. Table 28: Southeast Asia On-Site Photovoltaic Solar Power For Data Centers Market Revenue (Million) Forecast, by Application 2019 & 2032
                                                              29. Table 29: Australia On-Site Photovoltaic Solar Power For Data Centers Market Revenue (Million) Forecast, by Application 2019 & 2032
                                                              30. Table 30: Indonesia On-Site Photovoltaic Solar Power For Data Centers Market Revenue (Million) Forecast, by Application 2019 & 2032
                                                              31. Table 31: Phillipes On-Site Photovoltaic Solar Power For Data Centers Market Revenue (Million) Forecast, by Application 2019 & 2032
                                                              32. Table 32: Singapore On-Site Photovoltaic Solar Power For Data Centers Market Revenue (Million) Forecast, by Application 2019 & 2032
                                                              33. Table 33: Thailandc On-Site Photovoltaic Solar Power For Data Centers Market Revenue (Million) Forecast, by Application 2019 & 2032
                                                              34. Table 34: Rest of Asia Pacific On-Site Photovoltaic Solar Power For Data Centers Market Revenue (Million) Forecast, by Application 2019 & 2032
                                                              35. Table 35: Global On-Site Photovoltaic Solar Power For Data Centers Market Revenue Million Forecast, by Country 2019 & 2032
                                                              36. Table 36: Brazil On-Site Photovoltaic Solar Power For Data Centers Market Revenue (Million) Forecast, by Application 2019 & 2032
                                                              37. Table 37: Argentina On-Site Photovoltaic Solar Power For Data Centers Market Revenue (Million) Forecast, by Application 2019 & 2032
                                                              38. Table 38: Peru On-Site Photovoltaic Solar Power For Data Centers Market Revenue (Million) Forecast, by Application 2019 & 2032
                                                              39. Table 39: Chile On-Site Photovoltaic Solar Power For Data Centers Market Revenue (Million) Forecast, by Application 2019 & 2032
                                                              40. Table 40: Colombia On-Site Photovoltaic Solar Power For Data Centers Market Revenue (Million) Forecast, by Application 2019 & 2032
                                                              41. Table 41: Ecuador On-Site Photovoltaic Solar Power For Data Centers Market Revenue (Million) Forecast, by Application 2019 & 2032
                                                              42. Table 42: Venezuela On-Site Photovoltaic Solar Power For Data Centers Market Revenue (Million) Forecast, by Application 2019 & 2032
                                                              43. Table 43: Rest of South America On-Site Photovoltaic Solar Power For Data Centers Market Revenue (Million) Forecast, by Application 2019 & 2032
                                                              44. Table 44: Global On-Site Photovoltaic Solar Power For Data Centers Market Revenue Million Forecast, by Country 2019 & 2032
                                                              45. Table 45: United Arab Emirates On-Site Photovoltaic Solar Power For Data Centers Market Revenue (Million) Forecast, by Application 2019 & 2032
                                                              46. Table 46: Saudi Arabia On-Site Photovoltaic Solar Power For Data Centers Market Revenue (Million) Forecast, by Application 2019 & 2032
                                                              47. Table 47: South Africa On-Site Photovoltaic Solar Power For Data Centers Market Revenue (Million) Forecast, by Application 2019 & 2032
                                                              48. Table 48: Rest of Middle East and Africa On-Site Photovoltaic Solar Power For Data Centers Market Revenue (Million) Forecast, by Application 2019 & 2032
                                                              49. Table 49: Global On-Site Photovoltaic Solar Power For Data Centers Market Revenue Million Forecast, by Production Analysis 2019 & 2032
                                                              50. Table 50: Global On-Site Photovoltaic Solar Power For Data Centers Market Revenue Million Forecast, by Consumption Analysis 2019 & 2032
                                                              51. Table 51: Global On-Site Photovoltaic Solar Power For Data Centers Market Revenue Million Forecast, by Import Market Analysis (Value & Volume) 2019 & 2032
                                                              52. Table 52: Global On-Site Photovoltaic Solar Power For Data Centers Market Revenue Million Forecast, by Export Market Analysis (Value & Volume) 2019 & 2032
                                                              53. Table 53: Global On-Site Photovoltaic Solar Power For Data Centers Market Revenue Million Forecast, by Price Trend Analysis 2019 & 2032
                                                              54. Table 54: Global On-Site Photovoltaic Solar Power For Data Centers Market Revenue Million Forecast, by Country 2019 & 2032
                                                              55. Table 55: United States On-Site Photovoltaic Solar Power For Data Centers Market Revenue (Million) Forecast, by Application 2019 & 2032
                                                              56. Table 56: Canada On-Site Photovoltaic Solar Power For Data Centers Market Revenue (Million) Forecast, by Application 2019 & 2032
                                                              57. Table 57: Rest of North America On-Site Photovoltaic Solar Power For Data Centers Market Revenue (Million) Forecast, by Application 2019 & 2032
                                                              58. Table 58: Global On-Site Photovoltaic Solar Power For Data Centers Market Revenue Million Forecast, by Production Analysis 2019 & 2032
                                                              59. Table 59: Global On-Site Photovoltaic Solar Power For Data Centers Market Revenue Million Forecast, by Consumption Analysis 2019 & 2032
                                                              60. Table 60: Global On-Site Photovoltaic Solar Power For Data Centers Market Revenue Million Forecast, by Import Market Analysis (Value & Volume) 2019 & 2032
                                                              61. Table 61: Global On-Site Photovoltaic Solar Power For Data Centers Market Revenue Million Forecast, by Export Market Analysis (Value & Volume) 2019 & 2032
                                                              62. Table 62: Global On-Site Photovoltaic Solar Power For Data Centers Market Revenue Million Forecast, by Price Trend Analysis 2019 & 2032
                                                              63. Table 63: Global On-Site Photovoltaic Solar Power For Data Centers Market Revenue Million Forecast, by Country 2019 & 2032
                                                              64. Table 64: Germany On-Site Photovoltaic Solar Power For Data Centers Market Revenue (Million) Forecast, by Application 2019 & 2032
                                                              65. Table 65: France On-Site Photovoltaic Solar Power For Data Centers Market Revenue (Million) Forecast, by Application 2019 & 2032
                                                              66. Table 66: United Kingdom On-Site Photovoltaic Solar Power For Data Centers Market Revenue (Million) Forecast, by Application 2019 & 2032
                                                              67. Table 67: Italy On-Site Photovoltaic Solar Power For Data Centers Market Revenue (Million) Forecast, by Application 2019 & 2032
                                                              68. Table 68: Spain On-Site Photovoltaic Solar Power For Data Centers Market Revenue (Million) Forecast, by Application 2019 & 2032
                                                              69. Table 69: NORDIC On-Site Photovoltaic Solar Power For Data Centers Market Revenue (Million) Forecast, by Application 2019 & 2032
                                                              70. Table 70: Turkey On-Site Photovoltaic Solar Power For Data Centers Market Revenue (Million) Forecast, by Application 2019 & 2032
                                                              71. Table 71: Russia On-Site Photovoltaic Solar Power For Data Centers Market Revenue (Million) Forecast, by Application 2019 & 2032
                                                              72. Table 72: Rest of Europe On-Site Photovoltaic Solar Power For Data Centers Market Revenue (Million) Forecast, by Application 2019 & 2032
                                                              73. Table 73: Global On-Site Photovoltaic Solar Power For Data Centers Market Revenue Million Forecast, by Production Analysis 2019 & 2032
                                                              74. Table 74: Global On-Site Photovoltaic Solar Power For Data Centers Market Revenue Million Forecast, by Consumption Analysis 2019 & 2032
                                                              75. Table 75: Global On-Site Photovoltaic Solar Power For Data Centers Market Revenue Million Forecast, by Import Market Analysis (Value & Volume) 2019 & 2032
                                                              76. Table 76: Global On-Site Photovoltaic Solar Power For Data Centers Market Revenue Million Forecast, by Export Market Analysis (Value & Volume) 2019 & 2032
                                                              77. Table 77: Global On-Site Photovoltaic Solar Power For Data Centers Market Revenue Million Forecast, by Price Trend Analysis 2019 & 2032
                                                              78. Table 78: Global On-Site Photovoltaic Solar Power For Data Centers Market Revenue Million Forecast, by Country 2019 & 2032
                                                              79. Table 79: China On-Site Photovoltaic Solar Power For Data Centers Market Revenue (Million) Forecast, by Application 2019 & 2032
                                                              80. Table 80: India On-Site Photovoltaic Solar Power For Data Centers Market Revenue (Million) Forecast, by Application 2019 & 2032
                                                              81. Table 81: Japan On-Site Photovoltaic Solar Power For Data Centers Market Revenue (Million) Forecast, by Application 2019 & 2032
                                                              82. Table 82: Australia On-Site Photovoltaic Solar Power For Data Centers Market Revenue (Million) Forecast, by Application 2019 & 2032
                                                              83. Table 83: Malaysia On-Site Photovoltaic Solar Power For Data Centers Market Revenue (Million) Forecast, by Application 2019 & 2032
                                                              84. Table 84: Thailand On-Site Photovoltaic Solar Power For Data Centers Market Revenue (Million) Forecast, by Application 2019 & 2032
                                                              85. Table 85: Indonesia On-Site Photovoltaic Solar Power For Data Centers Market Revenue (Million) Forecast, by Application 2019 & 2032
                                                              86. Table 86: Vietnam On-Site Photovoltaic Solar Power For Data Centers Market Revenue (Million) Forecast, by Application 2019 & 2032
                                                              87. Table 87: Rest of Asia Pacific On-Site Photovoltaic Solar Power For Data Centers Market Revenue (Million) Forecast, by Application 2019 & 2032
                                                              88. Table 88: Global On-Site Photovoltaic Solar Power For Data Centers Market Revenue Million Forecast, by Production Analysis 2019 & 2032
                                                              89. Table 89: Global On-Site Photovoltaic Solar Power For Data Centers Market Revenue Million Forecast, by Consumption Analysis 2019 & 2032
                                                              90. Table 90: Global On-Site Photovoltaic Solar Power For Data Centers Market Revenue Million Forecast, by Import Market Analysis (Value & Volume) 2019 & 2032
                                                              91. Table 91: Global On-Site Photovoltaic Solar Power For Data Centers Market Revenue Million Forecast, by Export Market Analysis (Value & Volume) 2019 & 2032
                                                              92. Table 92: Global On-Site Photovoltaic Solar Power For Data Centers Market Revenue Million Forecast, by Price Trend Analysis 2019 & 2032
                                                              93. Table 93: Global On-Site Photovoltaic Solar Power For Data Centers Market Revenue Million Forecast, by Country 2019 & 2032
                                                              94. Table 94: Brazil On-Site Photovoltaic Solar Power For Data Centers Market Revenue (Million) Forecast, by Application 2019 & 2032
                                                              95. Table 95: Argentina On-Site Photovoltaic Solar Power For Data Centers Market Revenue (Million) Forecast, by Application 2019 & 2032
                                                              96. Table 96: Chile On-Site Photovoltaic Solar Power For Data Centers Market Revenue (Million) Forecast, by Application 2019 & 2032
                                                              97. Table 97: Colombia On-Site Photovoltaic Solar Power For Data Centers Market Revenue (Million) Forecast, by Application 2019 & 2032
                                                              98. Table 98: Rest of South America On-Site Photovoltaic Solar Power For Data Centers Market Revenue (Million) Forecast, by Application 2019 & 2032
                                                              99. Table 99: Global On-Site Photovoltaic Solar Power For Data Centers Market Revenue Million Forecast, by Production Analysis 2019 & 2032
                                                              100. Table 100: Global On-Site Photovoltaic Solar Power For Data Centers Market Revenue Million Forecast, by Consumption Analysis 2019 & 2032
                                                              101. Table 101: Global On-Site Photovoltaic Solar Power For Data Centers Market Revenue Million Forecast, by Import Market Analysis (Value & Volume) 2019 & 2032
                                                              102. Table 102: Global On-Site Photovoltaic Solar Power For Data Centers Market Revenue Million Forecast, by Export Market Analysis (Value & Volume) 2019 & 2032
                                                              103. Table 103: Global On-Site Photovoltaic Solar Power For Data Centers Market Revenue Million Forecast, by Price Trend Analysis 2019 & 2032
                                                              104. Table 104: Global On-Site Photovoltaic Solar Power For Data Centers Market Revenue Million Forecast, by Country 2019 & 2032
                                                              105. Table 105: United Arab Emirates On-Site Photovoltaic Solar Power For Data Centers Market Revenue (Million) Forecast, by Application 2019 & 2032
                                                              106. Table 106: Qatar On-Site Photovoltaic Solar Power For Data Centers Market Revenue (Million) Forecast, by Application 2019 & 2032
                                                              107. Table 107: Saudi Arabia On-Site Photovoltaic Solar Power For Data Centers Market Revenue (Million) Forecast, by Application 2019 & 2032
                                                              108. Table 108: South Africa On-Site Photovoltaic Solar Power For Data Centers Market Revenue (Million) Forecast, by Application 2019 & 2032
                                                              109. Table 109: Nigeria On-Site Photovoltaic Solar Power For Data Centers Market Revenue (Million) Forecast, by Application 2019 & 2032
                                                              110. Table 110: Egypt On-Site Photovoltaic Solar Power For Data Centers Market Revenue (Million) Forecast, by Application 2019 & 2032


                                                              Frequently Asked Questions

                                                              1. What is the projected Compound Annual Growth Rate (CAGR) of the On-Site Photovoltaic Solar Power For Data Centers Market?

                                                              The projected CAGR is approximately 13.60%.

                                                              2. Which companies are prominent players in the On-Site Photovoltaic Solar Power For Data Centers Market?

                                                              Key companies in the market include Affordable Internet Services Online Inc *List Not Exhaustive 6 4 Market Player Rankin, Alibaba Group Holding Ltd, Alphabet Inc, Microsoft Corporation, Amazon com Inc, Facebook Inc, Dell Technologies Inc.

                                                              3. What are the main segments of the On-Site Photovoltaic Solar Power For Data Centers Market?

                                                              The market segments include Production Analysis, Consumption Analysis, Import Market Analysis (Value & Volume), Export Market Analysis (Value & Volume), Price Trend Analysis.

                                                              4. Can you provide details about the market size?

                                                              The market size is estimated to be USD 22.90 Million as of 2022.

                                                              5. What are some drivers contributing to market growth?

                                                              4.; Decreasing Solar Power Installation Costs 4.; Growing focus on Implementing Sustainable Business Practices.

                                                              6. What are the notable trends driving market growth?

                                                              Decrease in Solar Power Installation Cost is Likely to Drive the Market.

                                                              7. Are there any restraints impacting market growth?

                                                              4.; Lack of Space for Small Data Centers to Install Solar Panels.

                                                              8. Can you provide examples of recent developments in the market?

                                                              In September 2023, Ireland-based Power Capital Renewable Energy (PCRE) signed a power purchase agreement (PPA) with American multinational technology firm Google. The agreement will help power up the data centre and offices of Google in Ireland with solar energy worth 58 MW capacity.

                                                              9. What pricing options are available for accessing the report?

                                                              Pricing options include single-user, multi-user, and enterprise licenses priced at USD 4750, USD 5250, and USD 8750 respectively.

                                                              10. Is the market size provided in terms of value or volume?

                                                              The market size is provided in terms of value, measured in Million.

                                                              11. Are there any specific market keywords associated with the report?

                                                              Yes, the market keyword associated with the report is "On-Site Photovoltaic Solar Power For Data Centers Market," which aids in identifying and referencing the specific market segment covered.

                                                              12. How do I determine which pricing option suits my needs best?

                                                              The pricing options vary based on user requirements and access needs. Individual users may opt for single-user licenses, while businesses requiring broader access may choose multi-user or enterprise licenses for cost-effective access to the report.

                                                              13. Are there any additional resources or data provided in the On-Site Photovoltaic Solar Power For Data Centers Market report?

                                                              While the report offers comprehensive insights, it's advisable to review the specific contents or supplementary materials provided to ascertain if additional resources or data are available.

                                                              14. How can I stay updated on further developments or reports in the On-Site Photovoltaic Solar Power For Data Centers Market?

                                                              To stay informed about further developments, trends, and reports in the On-Site Photovoltaic Solar Power For Data Centers Market, consider subscribing to industry newsletters, following relevant companies and organizations, or regularly checking reputable industry news sources and publications.


                                                              Methodology

                                                              Step 1 - Identification of Relevant Samples Size from Population Database

                                                              Step Chart
                                                              Bar Chart
                                                              Method Chart

                                                              Step 2 - Approaches for Defining Global Market Size (Value, Volume* & Price*)

                                                              Approach Chart
                                                              Top-down and bottom-up approaches are used to validate the global market size and estimate the market size for manufactures, regional segments, product, and application.

                                                              Note*: In applicable scenarios

                                                              Step 3 - Data Sources

                                                              Primary Research

                                                              • Web Analytics
                                                              • Survey Reports
                                                              • Research Institute
                                                              • Latest Research Reports
                                                              • Opinion Leaders

                                                              Secondary Research

                                                              • Annual Reports
                                                              • White Paper
                                                              • Latest Press Release
                                                              • Industry Association
                                                              • Paid Database
                                                              • Investor Presentations
                                                              Analyst Chart

                                                              Step 4 - Data Triangulation

                                                              Involves using different sources of information in order to increase the validity of a study

                                                              These sources are likely to be stakeholders in a program - participants, other researchers, program staff, other community members, and so on.

                                                              Then we put all data in single framework & apply various statistical tools to find out the dynamic on the market.

                                                              During the analysis stage, feedback from the stakeholder groups would be compared to determine areas of agreement as well as areas of divergence

                                                              Additionally, after gathering mixed and scattered data from a wide range of sources, data is triangulated and correlated to come up with estimated figures which are further validated through primary mediums or industry experts, opinion leaders.

                                                              About Visionary Data Reports

                                                              Visionary Data Reports provides future-focused market research, advanced analytics, and strategic insights for technology, healthcare, green energy, and finance. Our reports help you anticipate trends, innovate, and lead in your industry. Our expert team combines primary research, data science, and industry knowledge to deliver actionable intelligence. We offer syndicated reports, custom analytics, and consulting services tailored to your business needs. At Visionary Data Reports, we are committed to quality, transparency, and client satisfaction. Every report is rigorously validated to ensure accuracy and relevance. Our global perspective and forward-thinking approach help you understand both current and emerging market dynamics.

                                                              Stay ahead with Visionary Data Reports. Subscribe to our newsletter for the latest insights and research highlights, and follow us on social media for real-time updates. Visionary Data Reports – Your Guide to Tomorrow’s Opportunities.

                                                              Business Address

                                                              Head Office

                                                              Office no. A 5010, fifth floor, Solitaire Business Hub, Near Phoenix mall, Pune, Maharashtra 411014

                                                              Contact Information

                                                              Craig Francis

                                                              Business Development Head

                                                              +17162654855

                                                              [email protected]

                                                              Connect With Us

                                                              Secure Payment Partners

                                                              payment image
                                                              RetailLogisticsPackagingAutomotiveHealthcareAgricultureEnergy & PowerFood & BeverageAerospace & DefenseChemicals & MaterialsHospitality and TourismAnimal Nutrition & WellnessConsumer Goods and ServicesReal Estate and ConstructionHome and Property ImprovementTechnology, Media and TelecomManufacturing Products and ServicesFinancial Services and Investment Intelligence

                                                              © 2025 All rights reserved


                                                              Privacy Policy
                                                              Terms and Conditions
                                                              FAQ
                                                              artwork spiralartwork spiralRelated Reports
                                                              artwork underline

                                                              Algeria Power Market Market’s Consumer Insights and Trends

                                                              Discover the booming Algerian power market, projected to grow at a CAGR exceeding 8.5% until 2033. This in-depth analysis reveals key drivers, trends, and challenges, highlighting opportunities for investment in renewable energy and grid modernization. Explore market size, segmentation, and key players shaping this dynamic sector.

                                                              July 2025
                                                              Base Year: 2024
                                                              No Of Pages: 197
                                                              Price: $3800

                                                              Artificial Lift Software Industry Strategic Insights: Analysis 2025 and Forecasts 2033

                                                              The Artificial Lift Systems market is booming, projected to reach $XX million by 2033 with a CAGR exceeding 4.50%. Driven by increasing oil & gas production and technological advancements in ESP, PCP, and Rod Lift systems, key players like Baker Hughes and Schlumberger are shaping this lucrative sector. Explore market trends and regional analysis in our comprehensive report.

                                                              July 2025
                                                              Base Year: 2024
                                                              No Of Pages: 234
                                                              Price: $4750

                                                              US Fixed-tilt Solar PV Industry 2025-2033 Analysis: Trends, Competitor Dynamics, and Growth Opportunities

                                                              Discover the booming US fixed-tilt solar PV market! This comprehensive analysis reveals a CAGR exceeding 13.60%, driven by strong demand, government incentives, and technological advancements. Learn about key trends, regional variations, leading companies, and future growth projections for 2025-2033.

                                                              July 2025
                                                              Base Year: 2024
                                                              No Of Pages: 197
                                                              Price: $3800

                                                              Middle East and Africa Bunker Fuel Industry: Disruptive Technologies Driving Market Growth 2025-2033

                                                              Discover the booming Middle East & Africa Bunker Fuel market! This comprehensive analysis reveals a CAGR exceeding 12%, driven by increasing maritime trade and the shift towards cleaner fuels like LNG. Learn about market trends, key players (Shell, ExxonMobil, Uniper), and regional growth forecasts for 2025-2033.

                                                              July 2025
                                                              Base Year: 2024
                                                              No Of Pages: 234
                                                              Price: $4750

                                                              Gas Generator Rental Industry Unlocking Growth Potential: 2025-2033 Analysis and Forecasts

                                                              The gas generator rental market is booming, projected to exceed a CAGR of 5.20% through 2033. Discover key drivers, regional trends, and leading companies shaping this dynamic industry. Explore market size, segmentation (oil & gas, construction, data centers), and future growth projections in our comprehensive analysis.

                                                              July 2025
                                                              Base Year: 2024
                                                              No Of Pages: 234
                                                              Price: $4750

                                                              Unveiling Oil and Gas CAPEX Outlook Industry Trends

                                                              Discover the latest Oil & Gas CAPEX Outlook, projecting a 4.27% CAGR through 2033. Analyze market trends, regional breakdowns (North America, Europe, Asia-Pacific), key players (Shell, ExxonMobil, CNPC), and investment drivers shaping this dynamic sector. Get the data-driven insights you need for strategic decision-making.

                                                              July 2025
                                                              Base Year: 2024
                                                              No Of Pages: 234
                                                              Price: $4750

                                                              Oil and Gas Market in Malaysia Market’s Consumer Insights and Trends

                                                              Discover the booming Malaysian oil and gas market! This comprehensive analysis reveals key trends, drivers, and challenges impacting this $15B+ sector through 2033, profiling major players like Petronas and Royal Vopak. Learn about growth projections, market segmentation (transportation, storage, LNG terminals), and investment opportunities.

                                                              July 2025
                                                              Base Year: 2024
                                                              No Of Pages: 197
                                                              Price: $3800

                                                              Navigating Asia-Pacific Completion Equipment and Services Market Market Growth 2025-2033

                                                              Discover the booming Asia-Pacific completion equipment and services market! This in-depth analysis reveals key trends, growth drivers, and leading companies shaping this dynamic sector, projected to reach significant value by 2033. Explore market segments, regional breakdowns, and future growth potential.

                                                              July 2025
                                                              Base Year: 2024
                                                              No Of Pages: 234
                                                              Price: $4750

                                                              Exploring Consumer Shifts in Gas Generator Industry Market 2025-2033

                                                              The global gas generator market is booming, projected to reach $XX million by 2033 with a 4.95% CAGR. Driven by industrialization and unreliable grids, this report analyzes market trends, segments (industrial, commercial, residential, power rating), key players (Cummins, Generac, Caterpillar), and regional growth (North America, Europe, Asia-Pacific). Discover insights into this expanding market.

                                                              July 2025
                                                              Base Year: 2024
                                                              No Of Pages: 234
                                                              Price: $4750

                                                              Decoding Tunisia Power Industry Consumer Preferences 2025-2033

                                                              Discover the booming Tunisian power industry! This comprehensive market analysis reveals a CAGR of 7.70%, driven by renewable energy adoption and infrastructure modernization. Explore market size, key players (STEG, Seeraj Energy, more), and future growth projections (2025-2033) in this insightful report.

                                                              July 2025
                                                              Base Year: 2024
                                                              No Of Pages: 197
                                                              Price: $3800

                                                              High Voltage Switchgear Market Market Trends and Insights

                                                              The global high-voltage switchgear market is booming, projected to reach [insert projected 2033 value based on chart data] by 2033, driven by renewable energy integration and grid modernization. Explore market trends, key players (ABB, Siemens, Schneider Electric), and regional insights in this comprehensive analysis.

                                                              July 2025
                                                              Base Year: 2024
                                                              No Of Pages: 234
                                                              Price: $4750

                                                              Regional Trends and Opportunities for Excitation Systems Industry Market

                                                              Discover the booming Excitation Systems market! This in-depth analysis reveals a CAGR exceeding 4.35% through 2033, driven by renewable energy and industrial growth. Explore market size, key players (ABB, Siemens, GE), regional trends, and future projections for synchronous generators, motors, static & brushless systems.

                                                              July 2025
                                                              Base Year: 2024
                                                              No Of Pages: 234
                                                              Price: $4750

                                                              Comprehensive Review of Residential Combined Heat & Power System Market Growth Potential

                                                              Discover the booming Residential Combined Heat & Power (CHP) System market! Explore key trends, growth drivers, leading companies, and regional insights for 2025-2033. Learn about fuel cell and engine-based systems, and the impact of government policies on this sustainable energy solution.

                                                              July 2025
                                                              Base Year: 2024
                                                              No Of Pages: 234
                                                              Price: $4750

                                                              Opportunities in Emerging Indonesia Oil & Gas Downstream Market Industry Markets

                                                              Discover the booming Indonesia Oil & Gas Downstream Market analysis revealing a CAGR exceeding 4% through 2033. This in-depth report covers key players, segments (refined products, natural gas, petrochemicals), and regional trends, offering invaluable insights for investors and industry professionals. Explore growth drivers, restraints, and future projections for this dynamic market.

                                                              July 2025
                                                              Base Year: 2024
                                                              No Of Pages: 197
                                                              Price: $3800

                                                              Europe Nuclear Power Plant and Equipment Industry Market Trends and Strategic Roadmap

                                                              Discover the latest market analysis on the thriving European Nuclear Power Plant & Equipment industry. Explore growth drivers, market size (€20B in 2025), key players (Westinghouse, Rosatom, Framatome), and future trends impacting PWR, PHWR, and SMR technologies. Learn about the investment opportunities and challenges in this dynamic sector.

                                                              July 2025
                                                              Base Year: 2024
                                                              No Of Pages: 234
                                                              Price: $4750

                                                              Europe Hydraulic Fracturing Fluids Market Market Expansion: Growth Outlook 2025-2033

                                                              Discover the latest trends in the European hydraulic fracturing fluids market. Our in-depth analysis reveals a steady growth trajectory driven by natural gas demand, despite environmental regulations. Learn about market segmentation, key players (Schlumberger, Halliburton, Baker Hughes), and future projections for 2025-2033.

                                                              July 2025
                                                              Base Year: 2024
                                                              No Of Pages: 180
                                                              Price: $4750

                                                              Consumer Battery Industry Market’s Strategic Roadmap: Insights for 2025-2033

                                                              Discover the booming consumer battery market! This in-depth analysis reveals a CAGR of 7.47% through 2033, driven by consumer electronics, EVs, and industrial demand. Explore market size, key players (Samsung SDI, LG Chem, Panasonic), and regional trends. Learn about lithium-ion, alkaline, and other battery types.

                                                              July 2025
                                                              Base Year: 2024
                                                              No Of Pages: 234
                                                              Price: $4750

                                                              Kuwait Oil & Gas Market Market Predictions: Growth and Size Trends to 2033

                                                              Discover the booming Kuwait Oil & Gas market forecast to 2033! This in-depth analysis reveals market size, growth drivers (upstream, midstream, downstream), key players (Kuwait Petroleum Corporation, Chevron, Shell), and challenges. Learn about investment opportunities and future trends in this dynamic sector.

                                                              July 2025
                                                              Base Year: 2024
                                                              No Of Pages: 197
                                                              Price: $3800

                                                              France Tidal Power Market 2025-2033 Trends and Competitor Dynamics: Unlocking Growth Opportunities

                                                              Discover the booming France Tidal Power Market! Explore its €175-200 million (2025 est.) size, 4.54% CAGR, key drivers, restraints, and top companies. Learn about tidal barrage, floating platforms, and stream generation technologies shaping this renewable energy sector.

                                                              July 2025
                                                              Base Year: 2024
                                                              No Of Pages: 197
                                                              Price: $3800

                                                              Argentina's Solar Energy Industry Charting Growth Trajectories: Analysis and Forecasts 2025-2033

                                                              Discover the booming Argentina solar energy market! This in-depth analysis reveals a CAGR exceeding 10%, driven by government incentives and falling costs. Explore market size, key players (JinkoSolar, Canadian Solar, Genneia), and future growth projections through 2033. Invest in Argentina's solar future.

                                                              July 2025
                                                              Base Year: 2024
                                                              No Of Pages: 197
                                                              Price: $3800
                                                              • Home
                                                              • About Us
                                                              • Industries
                                                                • Aerospace & Defense
                                                                • Agriculture
                                                                • Animal Nutrition & Wellness
                                                                • Automotive
                                                                • Chemicals & Materials
                                                                • Consumer Goods and Services
                                                                • Energy & Power
                                                                • Financial Services and Investment Intelligence
                                                                • Food & Beverage
                                                                • Home and Property Improvement
                                                                • Hospitality and Tourism
                                                                • Logistics
                                                                • Manufacturing Products and Services
                                                                • Packaging
                                                                • Professional and Commercial Services
                                                                • Real Estate and Construction
                                                                • Retail
                                                                • Technology, Media and Telecom
                                                                • Healthcare
                                                              • Services
                                                              • Contact
                                                              Main Logo
                                                              • Home
                                                              • About Us
                                                              • Industries
                                                                • Aerospace & Defense
                                                                • Agriculture
                                                                • Animal Nutrition & Wellness
                                                                • Automotive
                                                                • Chemicals & Materials
                                                                • Consumer Goods and Services
                                                                • Energy & Power
                                                                • Financial Services and Investment Intelligence
                                                                • Food & Beverage
                                                                • Home and Property Improvement
                                                                • Hospitality and Tourism
                                                                • Logistics
                                                                • Manufacturing Products and Services
                                                                • Packaging
                                                                • Professional and Commercial Services
                                                                • Real Estate and Construction
                                                                • Retail
                                                                • Technology, Media and Telecom
                                                                • Healthcare
                                                              • Services
                                                              • Contact
                                                              +17162654855
                                                              [email protected]

                                                              +17162654855

                                                              [email protected]