
Key Insights
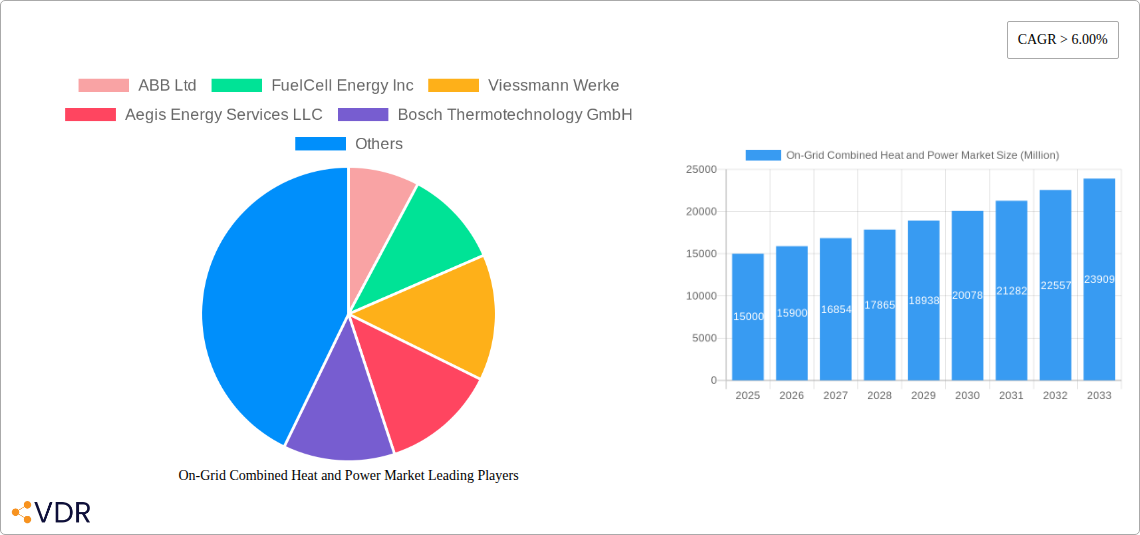
The On-Grid Combined Heat and Power (CHP) market is experiencing robust growth, projected to maintain a Compound Annual Growth Rate (CAGR) exceeding 6% from 2025 to 2033. This expansion is driven by increasing energy efficiency mandates globally, rising electricity prices, and a growing emphasis on reducing carbon emissions. Significant market segments include utilities, commercial & industrial applications, and residential sectors, with natural gas currently dominating the fuel type landscape. However, the market is witnessing a shift towards renewable fuel sources like biomass, driven by sustainability concerns and government incentives promoting renewable energy adoption. Technological advancements in CHP systems, leading to improved efficiency and reduced operating costs, are further fueling market growth. Geographical distribution reveals strong performance in North America and Europe, particularly in regions with established industrial bases and supportive regulatory frameworks. The Asia-Pacific region presents significant future growth potential due to rapid industrialization and urbanization, coupled with increasing investments in renewable energy infrastructure. Competitive dynamics are characterized by a mix of established players like ABB, Siemens, and General Electric, alongside emerging technology providers, leading to innovative solutions and intensified competition.
The restraints on market growth primarily involve high initial capital investment costs associated with CHP system installations, particularly for residential applications. Furthermore, grid infrastructure limitations in certain regions can pose a challenge to wider CHP adoption. Overcoming these challenges requires collaboration between governments, energy providers, and technology developers to foster favorable regulatory environments, incentivize investment, and improve grid infrastructure to facilitate seamless integration of CHP systems. This market’s trajectory indicates strong potential for growth, driven by a convergence of economic, environmental, and technological factors. The market’s diverse segments and geographical spread provide ample opportunities for both established and emerging players in the years to come. Future growth will likely hinge on addressing the challenges related to initial investment costs and grid infrastructure, while further capitalizing on the trend towards renewable fuel sources.
On-Grid Combined Heat and Power Market: A Comprehensive Report (2019-2033)
This in-depth report provides a comprehensive analysis of the On-Grid Combined Heat and Power (CHP) market, encompassing market dynamics, growth trends, regional insights, and key player strategies. The study covers the period from 2019 to 2033, with a focus on the forecast period from 2025 to 2033. This report is essential for industry professionals, investors, and policymakers seeking to understand and capitalize on opportunities within this dynamic sector. The parent market is the Distributed Generation Market and the child market is On-Grid CHP Systems.
On-Grid Combined Heat and Power Market Dynamics & Structure
This section delves into the intricate structure of the On-Grid CHP market, analyzing its competitive landscape, technological advancements, and regulatory influences. We examine market concentration, revealing the market share held by key players like ABB Ltd, Siemens AG, and Caterpillar Inc. The report quantifies M&A activity within the sector, estimating xx Million USD in deal volume during the historical period (2019-2024).
- Market Concentration: The market exhibits a moderately concentrated structure, with a few major players holding significant market share.
- Technological Innovation: Continuous advancements in fuel cell technology and microturbine systems are driving efficiency gains and reducing emissions.
- Regulatory Framework: Government incentives and policies promoting renewable energy and energy efficiency significantly influence market growth.
- Competitive Substitutes: Traditional power generation methods pose a competitive challenge, particularly in regions with abundant fossil fuel resources.
- End-User Demographics: The Utilities segment currently dominates, followed by the Commercial and Industrial sector, with Residential applications showing gradual growth.
- M&A Trends: Strategic acquisitions are anticipated to continue, primarily driven by expansion into new markets and technology integration.
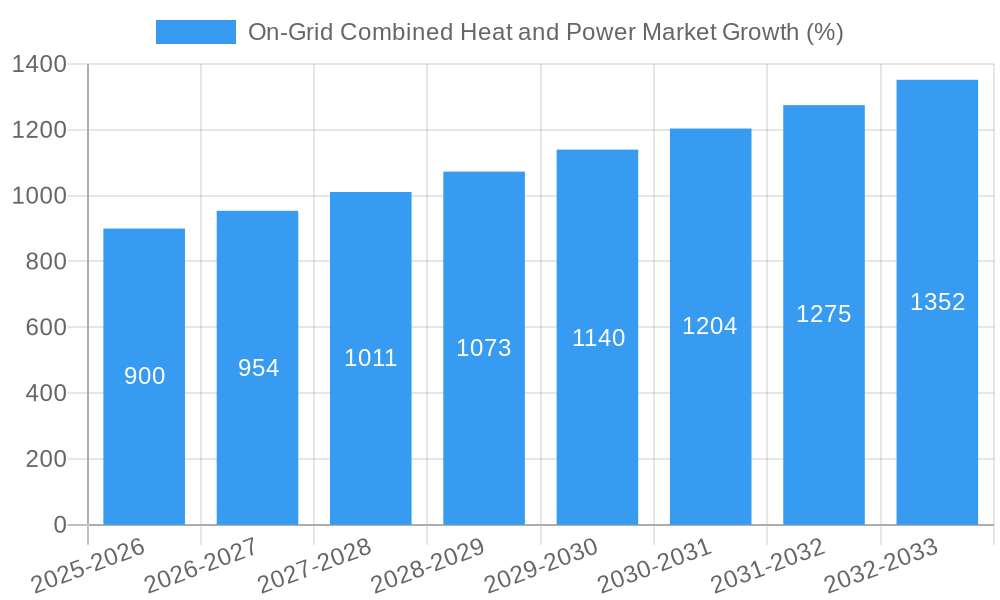
On-Grid Combined Heat and Power Market Growth Trends & Insights
The On-Grid CHP market experienced significant growth during the historical period (2019-2024), primarily fueled by increasing energy demand, environmental concerns, and government support. Our analysis projects a Compound Annual Growth Rate (CAGR) of xx% during the forecast period (2025-2033), reaching a market size of xx Million units by 2033. This growth is driven by several factors:
- Rising Energy Prices: Increased energy costs incentivize the adoption of CHP systems for cost savings.
- Stringent Emission Regulations: Governments worldwide are implementing stricter emission standards, favoring cleaner energy technologies like CHP.
- Technological Advancements: Improved efficiency, reduced capital costs, and enhanced reliability of CHP systems are accelerating adoption.
- Shifting Consumer Behavior: Growing awareness of environmental sustainability among consumers is promoting the adoption of eco-friendly energy solutions.
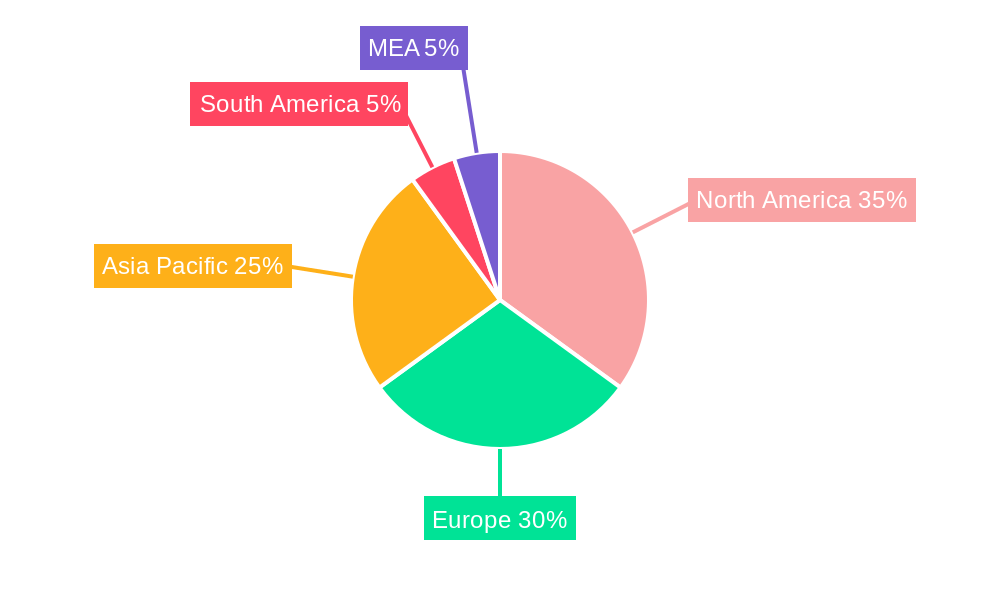
Dominant Regions, Countries, or Segments in On-Grid Combined Heat and Power Market
The North American market holds a significant share of the global On-Grid CHP market, followed by Europe and Asia-Pacific. Within the application segments, the Utilities sector leads, followed by Commercial and Industrial. Natural Gas remains the dominant fuel type.
- North America: Stringent environmental regulations and government support for renewable energy drive market growth in this region.
- Europe: High energy costs and a commitment to decarbonization are key growth drivers.
- Asia-Pacific: Rapid industrialization and urbanization, coupled with increasing energy demand, are fuelling market expansion.
- Fuel Type: Natural gas's abundance and relatively lower emissions compared to coal and oil contribute to its dominance.
- Application: Utilities' large-scale energy requirements and the potential for significant cost savings make it the largest application segment.
On-Grid Combined Heat and Power Market Product Landscape
The On-Grid CHP market offers a diverse range of products, including gas turbines, reciprocating engines, fuel cells, and microturbines. Recent innovations focus on enhanced efficiency, reduced emissions, and modular designs for flexible deployment. Key features include advanced control systems, remote monitoring capabilities, and integration with smart grids. The increasing availability of smaller, more efficient systems is opening up new applications in the commercial and residential sectors.
Key Drivers, Barriers & Challenges in On-Grid Combined Heat and Power Market
Key Drivers:
- Increasing energy demand and rising energy prices.
- Stringent environmental regulations and incentives for renewable energy.
- Technological advancements leading to higher efficiency and reduced costs.
Key Challenges:
- High initial investment costs can be a barrier for adoption, especially for smaller businesses.
- Regulatory hurdles and permitting processes can slow down deployment.
- Competition from conventional power generation technologies remains a challenge. The market share held by conventional methods is estimated at xx%.
Emerging Opportunities in On-Grid Combined Heat and Power Market
- Growing demand for decentralized energy generation in remote areas.
- Integration of CHP systems with renewable energy sources (solar, wind).
- Development of CHP systems for specific applications (e.g., data centers, hospitals).
Growth Accelerators in the On-Grid Combined Heat and Power Market Industry
Technological breakthroughs in fuel cell technology and improved energy storage solutions are significant growth catalysts. Strategic partnerships between energy companies and technology providers are accelerating market expansion. Government policies promoting energy efficiency and renewable energy are further boosting market growth.
Key Players Shaping the On-Grid Combined Heat and Power Market Market
- ABB Ltd
- FuelCell Energy Inc
- Viessmann Werke
- Aegis Energy Services LLC
- Bosch Thermotechnology GmbH
- Mitsubishi Electric Corporation
- Caterpillar Inc
- Seimens AG
- Centrica PLC
- Wartsila Oyj Abp
- MAN Diesel & Turbo SE
- General Electric Company
- Kawasaki Heavy Industries Ltd
Notable Milestones in On-Grid Combined Heat and Power Market Sector
- 2022-Q3: ABB Ltd launched a new generation of high-efficiency CHP systems.
- 2021-Q4: Siemens AG acquired a smaller CHP technology company, expanding its product portfolio.
- 2020-Q1: FuelCell Energy Inc secured a major contract for a large-scale CHP project. (Further milestones can be added here as needed).
In-Depth On-Grid Combined Heat and Power Market Market Outlook
The On-Grid CHP market is poised for substantial growth over the next decade, driven by increasing energy demand, environmental concerns, and technological advancements. Strategic partnerships and government support will further accelerate market expansion. The future holds significant opportunities for companies offering innovative CHP solutions tailored to specific market needs. The projected market size of xx Million units by 2033 reflects a substantial growth potential for investors and industry players.
On-Grid Combined Heat and Power Market Segmentation
-
1. Application
- 1.1. Utilities
- 1.2. Commercial and Industrial
- 1.3. Residential
-
2. Fuel Type
- 2.1. Natural Gas
- 2.2. Coal
- 2.3. Oil
- 2.4. Biomass
- 2.5. Other Fuel Types
On-Grid Combined Heat and Power Market Segmentation By Geography
- 1. North America
- 2. Europe
- 3. Asia Pacific
- 4. South America
- 5. Middle East
On-Grid Combined Heat and Power Market REPORT HIGHLIGHTS
| Aspects | Details |
|---|---|
| Study Period | 2019-2033 |
| Base Year | 2024 |
| Estimated Year | 2025 |
| Forecast Period | 2025-2033 |
| Historical Period | 2019-2024 |
| Growth Rate | CAGR of > 6.00% from 2019-2033 |
| Segmentation |
|
Table of Contents
- 1. Introduction
- 1.1. Research Scope
- 1.2. Market Segmentation
- 1.3. Research Methodology
- 1.4. Definitions and Assumptions
- 2. Executive Summary
- 2.1. Introduction
- 3. Market Dynamics
- 3.1. Introduction
- 3.2. Market Drivers
- 3.2.1. Supportive Government Policies and Incentives4.; Environmental Concerns
- 3.3. Market Restrains
- 3.3.1. Fossil Fuel Subsidies
- 3.4. Market Trends
- 3.4.1. Biomass Based Combined Heat and Power to Witness a Significant Growth
- 4. Market Factor Analysis
- 4.1. Porters Five Forces
- 4.2. Supply/Value Chain
- 4.3. PESTEL analysis
- 4.4. Market Entropy
- 4.5. Patent/Trademark Analysis
- 5. Global On-Grid Combined Heat and Power Market Analysis, Insights and Forecast, 2019-2031
- 5.1. Market Analysis, Insights and Forecast - by Application
- 5.1.1. Utilities
- 5.1.2. Commercial and Industrial
- 5.1.3. Residential
- 5.2. Market Analysis, Insights and Forecast - by Fuel Type
- 5.2.1. Natural Gas
- 5.2.2. Coal
- 5.2.3. Oil
- 5.2.4. Biomass
- 5.2.5. Other Fuel Types
- 5.3. Market Analysis, Insights and Forecast - by Region
- 5.3.1. North America
- 5.3.2. Europe
- 5.3.3. Asia Pacific
- 5.3.4. South America
- 5.3.5. Middle East
- 5.1. Market Analysis, Insights and Forecast - by Application
- 6. North America On-Grid Combined Heat and Power Market Analysis, Insights and Forecast, 2019-2031
- 6.1. Market Analysis, Insights and Forecast - by Application
- 6.1.1. Utilities
- 6.1.2. Commercial and Industrial
- 6.1.3. Residential
- 6.2. Market Analysis, Insights and Forecast - by Fuel Type
- 6.2.1. Natural Gas
- 6.2.2. Coal
- 6.2.3. Oil
- 6.2.4. Biomass
- 6.2.5. Other Fuel Types
- 6.1. Market Analysis, Insights and Forecast - by Application
- 7. Europe On-Grid Combined Heat and Power Market Analysis, Insights and Forecast, 2019-2031
- 7.1. Market Analysis, Insights and Forecast - by Application
- 7.1.1. Utilities
- 7.1.2. Commercial and Industrial
- 7.1.3. Residential
- 7.2. Market Analysis, Insights and Forecast - by Fuel Type
- 7.2.1. Natural Gas
- 7.2.2. Coal
- 7.2.3. Oil
- 7.2.4. Biomass
- 7.2.5. Other Fuel Types
- 7.1. Market Analysis, Insights and Forecast - by Application
- 8. Asia Pacific On-Grid Combined Heat and Power Market Analysis, Insights and Forecast, 2019-2031
- 8.1. Market Analysis, Insights and Forecast - by Application
- 8.1.1. Utilities
- 8.1.2. Commercial and Industrial
- 8.1.3. Residential
- 8.2. Market Analysis, Insights and Forecast - by Fuel Type
- 8.2.1. Natural Gas
- 8.2.2. Coal
- 8.2.3. Oil
- 8.2.4. Biomass
- 8.2.5. Other Fuel Types
- 8.1. Market Analysis, Insights and Forecast - by Application
- 9. South America On-Grid Combined Heat and Power Market Analysis, Insights and Forecast, 2019-2031
- 9.1. Market Analysis, Insights and Forecast - by Application
- 9.1.1. Utilities
- 9.1.2. Commercial and Industrial
- 9.1.3. Residential
- 9.2. Market Analysis, Insights and Forecast - by Fuel Type
- 9.2.1. Natural Gas
- 9.2.2. Coal
- 9.2.3. Oil
- 9.2.4. Biomass
- 9.2.5. Other Fuel Types
- 9.1. Market Analysis, Insights and Forecast - by Application
- 10. Middle East On-Grid Combined Heat and Power Market Analysis, Insights and Forecast, 2019-2031
- 10.1. Market Analysis, Insights and Forecast - by Application
- 10.1.1. Utilities
- 10.1.2. Commercial and Industrial
- 10.1.3. Residential
- 10.2. Market Analysis, Insights and Forecast - by Fuel Type
- 10.2.1. Natural Gas
- 10.2.2. Coal
- 10.2.3. Oil
- 10.2.4. Biomass
- 10.2.5. Other Fuel Types
- 10.1. Market Analysis, Insights and Forecast - by Application
- 11. North America On-Grid Combined Heat and Power Market Analysis, Insights and Forecast, 2019-2031
- 11.1. Market Analysis, Insights and Forecast - By Country/Sub-region
- 11.1.1 United States
- 11.1.2 Canada
- 11.1.3 Mexico
- 12. Europe On-Grid Combined Heat and Power Market Analysis, Insights and Forecast, 2019-2031
- 12.1. Market Analysis, Insights and Forecast - By Country/Sub-region
- 12.1.1 Germany
- 12.1.2 United Kingdom
- 12.1.3 France
- 12.1.4 Spain
- 12.1.5 Italy
- 12.1.6 Spain
- 12.1.7 Belgium
- 12.1.8 Netherland
- 12.1.9 Nordics
- 12.1.10 Rest of Europe
- 13. Asia Pacific On-Grid Combined Heat and Power Market Analysis, Insights and Forecast, 2019-2031
- 13.1. Market Analysis, Insights and Forecast - By Country/Sub-region
- 13.1.1 China
- 13.1.2 Japan
- 13.1.3 India
- 13.1.4 South Korea
- 13.1.5 Southeast Asia
- 13.1.6 Australia
- 13.1.7 Indonesia
- 13.1.8 Phillipes
- 13.1.9 Singapore
- 13.1.10 Thailandc
- 13.1.11 Rest of Asia Pacific
- 14. South America On-Grid Combined Heat and Power Market Analysis, Insights and Forecast, 2019-2031
- 14.1. Market Analysis, Insights and Forecast - By Country/Sub-region
- 14.1.1 Brazil
- 14.1.2 Argentina
- 14.1.3 Peru
- 14.1.4 Chile
- 14.1.5 Colombia
- 14.1.6 Ecuador
- 14.1.7 Venezuela
- 14.1.8 Rest of South America
- 15. MEA On-Grid Combined Heat and Power Market Analysis, Insights and Forecast, 2019-2031
- 15.1. Market Analysis, Insights and Forecast - By Country/Sub-region
- 15.1.1 United Arab Emirates
- 15.1.2 Saudi Arabia
- 15.1.3 South Africa
- 15.1.4 Rest of Middle East and Africa
- 16. Competitive Analysis
- 16.1. Global Market Share Analysis 2024
- 16.2. Company Profiles
- 16.2.1 ABB Ltd
- 16.2.1.1. Overview
- 16.2.1.2. Products
- 16.2.1.3. SWOT Analysis
- 16.2.1.4. Recent Developments
- 16.2.1.5. Financials (Based on Availability)
- 16.2.2 FuelCell Energy Inc
- 16.2.2.1. Overview
- 16.2.2.2. Products
- 16.2.2.3. SWOT Analysis
- 16.2.2.4. Recent Developments
- 16.2.2.5. Financials (Based on Availability)
- 16.2.3 Viessmann Werke
- 16.2.3.1. Overview
- 16.2.3.2. Products
- 16.2.3.3. SWOT Analysis
- 16.2.3.4. Recent Developments
- 16.2.3.5. Financials (Based on Availability)
- 16.2.4 Aegis Energy Services LLC
- 16.2.4.1. Overview
- 16.2.4.2. Products
- 16.2.4.3. SWOT Analysis
- 16.2.4.4. Recent Developments
- 16.2.4.5. Financials (Based on Availability)
- 16.2.5 Bosch Thermotechnology GmbH
- 16.2.5.1. Overview
- 16.2.5.2. Products
- 16.2.5.3. SWOT Analysis
- 16.2.5.4. Recent Developments
- 16.2.5.5. Financials (Based on Availability)
- 16.2.6 Mitsubishi Electric Corporation
- 16.2.6.1. Overview
- 16.2.6.2. Products
- 16.2.6.3. SWOT Analysis
- 16.2.6.4. Recent Developments
- 16.2.6.5. Financials (Based on Availability)
- 16.2.7 Caterpillar Inc
- 16.2.7.1. Overview
- 16.2.7.2. Products
- 16.2.7.3. SWOT Analysis
- 16.2.7.4. Recent Developments
- 16.2.7.5. Financials (Based on Availability)
- 16.2.8 Seimens AG
- 16.2.8.1. Overview
- 16.2.8.2. Products
- 16.2.8.3. SWOT Analysis
- 16.2.8.4. Recent Developments
- 16.2.8.5. Financials (Based on Availability)
- 16.2.9 Centrica PLC
- 16.2.9.1. Overview
- 16.2.9.2. Products
- 16.2.9.3. SWOT Analysis
- 16.2.9.4. Recent Developments
- 16.2.9.5. Financials (Based on Availability)
- 16.2.10 Wartsila Oyj Abp
- 16.2.10.1. Overview
- 16.2.10.2. Products
- 16.2.10.3. SWOT Analysis
- 16.2.10.4. Recent Developments
- 16.2.10.5. Financials (Based on Availability)
- 16.2.11 MAN Diesel & Turbo SE
- 16.2.11.1. Overview
- 16.2.11.2. Products
- 16.2.11.3. SWOT Analysis
- 16.2.11.4. Recent Developments
- 16.2.11.5. Financials (Based on Availability)
- 16.2.12 General Electric Company
- 16.2.12.1. Overview
- 16.2.12.2. Products
- 16.2.12.3. SWOT Analysis
- 16.2.12.4. Recent Developments
- 16.2.12.5. Financials (Based on Availability)
- 16.2.13 Kawasaki Heavy Industries Ltd
- 16.2.13.1. Overview
- 16.2.13.2. Products
- 16.2.13.3. SWOT Analysis
- 16.2.13.4. Recent Developments
- 16.2.13.5. Financials (Based on Availability)
- 16.2.1 ABB Ltd
List of Figures
- Figure 1: Global On-Grid Combined Heat and Power Market Revenue Breakdown (Million, %) by Region 2024 & 2032
- Figure 2: Global On-Grid Combined Heat and Power Market Volume Breakdown (Gigawatt, %) by Region 2024 & 2032
- Figure 3: North America On-Grid Combined Heat and Power Market Revenue (Million), by Country 2024 & 2032
- Figure 4: North America On-Grid Combined Heat and Power Market Volume (Gigawatt), by Country 2024 & 2032
- Figure 5: North America On-Grid Combined Heat and Power Market Revenue Share (%), by Country 2024 & 2032
- Figure 6: North America On-Grid Combined Heat and Power Market Volume Share (%), by Country 2024 & 2032
- Figure 7: Europe On-Grid Combined Heat and Power Market Revenue (Million), by Country 2024 & 2032
- Figure 8: Europe On-Grid Combined Heat and Power Market Volume (Gigawatt), by Country 2024 & 2032
- Figure 9: Europe On-Grid Combined Heat and Power Market Revenue Share (%), by Country 2024 & 2032
- Figure 10: Europe On-Grid Combined Heat and Power Market Volume Share (%), by Country 2024 & 2032
- Figure 11: Asia Pacific On-Grid Combined Heat and Power Market Revenue (Million), by Country 2024 & 2032
- Figure 12: Asia Pacific On-Grid Combined Heat and Power Market Volume (Gigawatt), by Country 2024 & 2032
- Figure 13: Asia Pacific On-Grid Combined Heat and Power Market Revenue Share (%), by Country 2024 & 2032
- Figure 14: Asia Pacific On-Grid Combined Heat and Power Market Volume Share (%), by Country 2024 & 2032
- Figure 15: South America On-Grid Combined Heat and Power Market Revenue (Million), by Country 2024 & 2032
- Figure 16: South America On-Grid Combined Heat and Power Market Volume (Gigawatt), by Country 2024 & 2032
- Figure 17: South America On-Grid Combined Heat and Power Market Revenue Share (%), by Country 2024 & 2032
- Figure 18: South America On-Grid Combined Heat and Power Market Volume Share (%), by Country 2024 & 2032
- Figure 19: MEA On-Grid Combined Heat and Power Market Revenue (Million), by Country 2024 & 2032
- Figure 20: MEA On-Grid Combined Heat and Power Market Volume (Gigawatt), by Country 2024 & 2032
- Figure 21: MEA On-Grid Combined Heat and Power Market Revenue Share (%), by Country 2024 & 2032
- Figure 22: MEA On-Grid Combined Heat and Power Market Volume Share (%), by Country 2024 & 2032
- Figure 23: North America On-Grid Combined Heat and Power Market Revenue (Million), by Application 2024 & 2032
- Figure 24: North America On-Grid Combined Heat and Power Market Volume (Gigawatt), by Application 2024 & 2032
- Figure 25: North America On-Grid Combined Heat and Power Market Revenue Share (%), by Application 2024 & 2032
- Figure 26: North America On-Grid Combined Heat and Power Market Volume Share (%), by Application 2024 & 2032
- Figure 27: North America On-Grid Combined Heat and Power Market Revenue (Million), by Fuel Type 2024 & 2032
- Figure 28: North America On-Grid Combined Heat and Power Market Volume (Gigawatt), by Fuel Type 2024 & 2032
- Figure 29: North America On-Grid Combined Heat and Power Market Revenue Share (%), by Fuel Type 2024 & 2032
- Figure 30: North America On-Grid Combined Heat and Power Market Volume Share (%), by Fuel Type 2024 & 2032
- Figure 31: North America On-Grid Combined Heat and Power Market Revenue (Million), by Country 2024 & 2032
- Figure 32: North America On-Grid Combined Heat and Power Market Volume (Gigawatt), by Country 2024 & 2032
- Figure 33: North America On-Grid Combined Heat and Power Market Revenue Share (%), by Country 2024 & 2032
- Figure 34: North America On-Grid Combined Heat and Power Market Volume Share (%), by Country 2024 & 2032
- Figure 35: Europe On-Grid Combined Heat and Power Market Revenue (Million), by Application 2024 & 2032
- Figure 36: Europe On-Grid Combined Heat and Power Market Volume (Gigawatt), by Application 2024 & 2032
- Figure 37: Europe On-Grid Combined Heat and Power Market Revenue Share (%), by Application 2024 & 2032
- Figure 38: Europe On-Grid Combined Heat and Power Market Volume Share (%), by Application 2024 & 2032
- Figure 39: Europe On-Grid Combined Heat and Power Market Revenue (Million), by Fuel Type 2024 & 2032
- Figure 40: Europe On-Grid Combined Heat and Power Market Volume (Gigawatt), by Fuel Type 2024 & 2032
- Figure 41: Europe On-Grid Combined Heat and Power Market Revenue Share (%), by Fuel Type 2024 & 2032
- Figure 42: Europe On-Grid Combined Heat and Power Market Volume Share (%), by Fuel Type 2024 & 2032
- Figure 43: Europe On-Grid Combined Heat and Power Market Revenue (Million), by Country 2024 & 2032
- Figure 44: Europe On-Grid Combined Heat and Power Market Volume (Gigawatt), by Country 2024 & 2032
- Figure 45: Europe On-Grid Combined Heat and Power Market Revenue Share (%), by Country 2024 & 2032
- Figure 46: Europe On-Grid Combined Heat and Power Market Volume Share (%), by Country 2024 & 2032
- Figure 47: Asia Pacific On-Grid Combined Heat and Power Market Revenue (Million), by Application 2024 & 2032
- Figure 48: Asia Pacific On-Grid Combined Heat and Power Market Volume (Gigawatt), by Application 2024 & 2032
- Figure 49: Asia Pacific On-Grid Combined Heat and Power Market Revenue Share (%), by Application 2024 & 2032
- Figure 50: Asia Pacific On-Grid Combined Heat and Power Market Volume Share (%), by Application 2024 & 2032
- Figure 51: Asia Pacific On-Grid Combined Heat and Power Market Revenue (Million), by Fuel Type 2024 & 2032
- Figure 52: Asia Pacific On-Grid Combined Heat and Power Market Volume (Gigawatt), by Fuel Type 2024 & 2032
- Figure 53: Asia Pacific On-Grid Combined Heat and Power Market Revenue Share (%), by Fuel Type 2024 & 2032
- Figure 54: Asia Pacific On-Grid Combined Heat and Power Market Volume Share (%), by Fuel Type 2024 & 2032
- Figure 55: Asia Pacific On-Grid Combined Heat and Power Market Revenue (Million), by Country 2024 & 2032
- Figure 56: Asia Pacific On-Grid Combined Heat and Power Market Volume (Gigawatt), by Country 2024 & 2032
- Figure 57: Asia Pacific On-Grid Combined Heat and Power Market Revenue Share (%), by Country 2024 & 2032
- Figure 58: Asia Pacific On-Grid Combined Heat and Power Market Volume Share (%), by Country 2024 & 2032
- Figure 59: South America On-Grid Combined Heat and Power Market Revenue (Million), by Application 2024 & 2032
- Figure 60: South America On-Grid Combined Heat and Power Market Volume (Gigawatt), by Application 2024 & 2032
- Figure 61: South America On-Grid Combined Heat and Power Market Revenue Share (%), by Application 2024 & 2032
- Figure 62: South America On-Grid Combined Heat and Power Market Volume Share (%), by Application 2024 & 2032
- Figure 63: South America On-Grid Combined Heat and Power Market Revenue (Million), by Fuel Type 2024 & 2032
- Figure 64: South America On-Grid Combined Heat and Power Market Volume (Gigawatt), by Fuel Type 2024 & 2032
- Figure 65: South America On-Grid Combined Heat and Power Market Revenue Share (%), by Fuel Type 2024 & 2032
- Figure 66: South America On-Grid Combined Heat and Power Market Volume Share (%), by Fuel Type 2024 & 2032
- Figure 67: South America On-Grid Combined Heat and Power Market Revenue (Million), by Country 2024 & 2032
- Figure 68: South America On-Grid Combined Heat and Power Market Volume (Gigawatt), by Country 2024 & 2032
- Figure 69: South America On-Grid Combined Heat and Power Market Revenue Share (%), by Country 2024 & 2032
- Figure 70: South America On-Grid Combined Heat and Power Market Volume Share (%), by Country 2024 & 2032
- Figure 71: Middle East On-Grid Combined Heat and Power Market Revenue (Million), by Application 2024 & 2032
- Figure 72: Middle East On-Grid Combined Heat and Power Market Volume (Gigawatt), by Application 2024 & 2032
- Figure 73: Middle East On-Grid Combined Heat and Power Market Revenue Share (%), by Application 2024 & 2032
- Figure 74: Middle East On-Grid Combined Heat and Power Market Volume Share (%), by Application 2024 & 2032
- Figure 75: Middle East On-Grid Combined Heat and Power Market Revenue (Million), by Fuel Type 2024 & 2032
- Figure 76: Middle East On-Grid Combined Heat and Power Market Volume (Gigawatt), by Fuel Type 2024 & 2032
- Figure 77: Middle East On-Grid Combined Heat and Power Market Revenue Share (%), by Fuel Type 2024 & 2032
- Figure 78: Middle East On-Grid Combined Heat and Power Market Volume Share (%), by Fuel Type 2024 & 2032
- Figure 79: Middle East On-Grid Combined Heat and Power Market Revenue (Million), by Country 2024 & 2032
- Figure 80: Middle East On-Grid Combined Heat and Power Market Volume (Gigawatt), by Country 2024 & 2032
- Figure 81: Middle East On-Grid Combined Heat and Power Market Revenue Share (%), by Country 2024 & 2032
- Figure 82: Middle East On-Grid Combined Heat and Power Market Volume Share (%), by Country 2024 & 2032
List of Tables
- Table 1: Global On-Grid Combined Heat and Power Market Revenue Million Forecast, by Region 2019 & 2032
- Table 2: Global On-Grid Combined Heat and Power Market Volume Gigawatt Forecast, by Region 2019 & 2032
- Table 3: Global On-Grid Combined Heat and Power Market Revenue Million Forecast, by Application 2019 & 2032
- Table 4: Global On-Grid Combined Heat and Power Market Volume Gigawatt Forecast, by Application 2019 & 2032
- Table 5: Global On-Grid Combined Heat and Power Market Revenue Million Forecast, by Fuel Type 2019 & 2032
- Table 6: Global On-Grid Combined Heat and Power Market Volume Gigawatt Forecast, by Fuel Type 2019 & 2032
- Table 7: Global On-Grid Combined Heat and Power Market Revenue Million Forecast, by Region 2019 & 2032
- Table 8: Global On-Grid Combined Heat and Power Market Volume Gigawatt Forecast, by Region 2019 & 2032
- Table 9: Global On-Grid Combined Heat and Power Market Revenue Million Forecast, by Country 2019 & 2032
- Table 10: Global On-Grid Combined Heat and Power Market Volume Gigawatt Forecast, by Country 2019 & 2032
- Table 11: United States On-Grid Combined Heat and Power Market Revenue (Million) Forecast, by Application 2019 & 2032
- Table 12: United States On-Grid Combined Heat and Power Market Volume (Gigawatt) Forecast, by Application 2019 & 2032
- Table 13: Canada On-Grid Combined Heat and Power Market Revenue (Million) Forecast, by Application 2019 & 2032
- Table 14: Canada On-Grid Combined Heat and Power Market Volume (Gigawatt) Forecast, by Application 2019 & 2032
- Table 15: Mexico On-Grid Combined Heat and Power Market Revenue (Million) Forecast, by Application 2019 & 2032
- Table 16: Mexico On-Grid Combined Heat and Power Market Volume (Gigawatt) Forecast, by Application 2019 & 2032
- Table 17: Global On-Grid Combined Heat and Power Market Revenue Million Forecast, by Country 2019 & 2032
- Table 18: Global On-Grid Combined Heat and Power Market Volume Gigawatt Forecast, by Country 2019 & 2032
- Table 19: Germany On-Grid Combined Heat and Power Market Revenue (Million) Forecast, by Application 2019 & 2032
- Table 20: Germany On-Grid Combined Heat and Power Market Volume (Gigawatt) Forecast, by Application 2019 & 2032
- Table 21: United Kingdom On-Grid Combined Heat and Power Market Revenue (Million) Forecast, by Application 2019 & 2032
- Table 22: United Kingdom On-Grid Combined Heat and Power Market Volume (Gigawatt) Forecast, by Application 2019 & 2032
- Table 23: France On-Grid Combined Heat and Power Market Revenue (Million) Forecast, by Application 2019 & 2032
- Table 24: France On-Grid Combined Heat and Power Market Volume (Gigawatt) Forecast, by Application 2019 & 2032
- Table 25: Spain On-Grid Combined Heat and Power Market Revenue (Million) Forecast, by Application 2019 & 2032
- Table 26: Spain On-Grid Combined Heat and Power Market Volume (Gigawatt) Forecast, by Application 2019 & 2032
- Table 27: Italy On-Grid Combined Heat and Power Market Revenue (Million) Forecast, by Application 2019 & 2032
- Table 28: Italy On-Grid Combined Heat and Power Market Volume (Gigawatt) Forecast, by Application 2019 & 2032
- Table 29: Spain On-Grid Combined Heat and Power Market Revenue (Million) Forecast, by Application 2019 & 2032
- Table 30: Spain On-Grid Combined Heat and Power Market Volume (Gigawatt) Forecast, by Application 2019 & 2032
- Table 31: Belgium On-Grid Combined Heat and Power Market Revenue (Million) Forecast, by Application 2019 & 2032
- Table 32: Belgium On-Grid Combined Heat and Power Market Volume (Gigawatt) Forecast, by Application 2019 & 2032
- Table 33: Netherland On-Grid Combined Heat and Power Market Revenue (Million) Forecast, by Application 2019 & 2032
- Table 34: Netherland On-Grid Combined Heat and Power Market Volume (Gigawatt) Forecast, by Application 2019 & 2032
- Table 35: Nordics On-Grid Combined Heat and Power Market Revenue (Million) Forecast, by Application 2019 & 2032
- Table 36: Nordics On-Grid Combined Heat and Power Market Volume (Gigawatt) Forecast, by Application 2019 & 2032
- Table 37: Rest of Europe On-Grid Combined Heat and Power Market Revenue (Million) Forecast, by Application 2019 & 2032
- Table 38: Rest of Europe On-Grid Combined Heat and Power Market Volume (Gigawatt) Forecast, by Application 2019 & 2032
- Table 39: Global On-Grid Combined Heat and Power Market Revenue Million Forecast, by Country 2019 & 2032
- Table 40: Global On-Grid Combined Heat and Power Market Volume Gigawatt Forecast, by Country 2019 & 2032
- Table 41: China On-Grid Combined Heat and Power Market Revenue (Million) Forecast, by Application 2019 & 2032
- Table 42: China On-Grid Combined Heat and Power Market Volume (Gigawatt) Forecast, by Application 2019 & 2032
- Table 43: Japan On-Grid Combined Heat and Power Market Revenue (Million) Forecast, by Application 2019 & 2032
- Table 44: Japan On-Grid Combined Heat and Power Market Volume (Gigawatt) Forecast, by Application 2019 & 2032
- Table 45: India On-Grid Combined Heat and Power Market Revenue (Million) Forecast, by Application 2019 & 2032
- Table 46: India On-Grid Combined Heat and Power Market Volume (Gigawatt) Forecast, by Application 2019 & 2032
- Table 47: South Korea On-Grid Combined Heat and Power Market Revenue (Million) Forecast, by Application 2019 & 2032
- Table 48: South Korea On-Grid Combined Heat and Power Market Volume (Gigawatt) Forecast, by Application 2019 & 2032
- Table 49: Southeast Asia On-Grid Combined Heat and Power Market Revenue (Million) Forecast, by Application 2019 & 2032
- Table 50: Southeast Asia On-Grid Combined Heat and Power Market Volume (Gigawatt) Forecast, by Application 2019 & 2032
- Table 51: Australia On-Grid Combined Heat and Power Market Revenue (Million) Forecast, by Application 2019 & 2032
- Table 52: Australia On-Grid Combined Heat and Power Market Volume (Gigawatt) Forecast, by Application 2019 & 2032
- Table 53: Indonesia On-Grid Combined Heat and Power Market Revenue (Million) Forecast, by Application 2019 & 2032
- Table 54: Indonesia On-Grid Combined Heat and Power Market Volume (Gigawatt) Forecast, by Application 2019 & 2032
- Table 55: Phillipes On-Grid Combined Heat and Power Market Revenue (Million) Forecast, by Application 2019 & 2032
- Table 56: Phillipes On-Grid Combined Heat and Power Market Volume (Gigawatt) Forecast, by Application 2019 & 2032
- Table 57: Singapore On-Grid Combined Heat and Power Market Revenue (Million) Forecast, by Application 2019 & 2032
- Table 58: Singapore On-Grid Combined Heat and Power Market Volume (Gigawatt) Forecast, by Application 2019 & 2032
- Table 59: Thailandc On-Grid Combined Heat and Power Market Revenue (Million) Forecast, by Application 2019 & 2032
- Table 60: Thailandc On-Grid Combined Heat and Power Market Volume (Gigawatt) Forecast, by Application 2019 & 2032
- Table 61: Rest of Asia Pacific On-Grid Combined Heat and Power Market Revenue (Million) Forecast, by Application 2019 & 2032
- Table 62: Rest of Asia Pacific On-Grid Combined Heat and Power Market Volume (Gigawatt) Forecast, by Application 2019 & 2032
- Table 63: Global On-Grid Combined Heat and Power Market Revenue Million Forecast, by Country 2019 & 2032
- Table 64: Global On-Grid Combined Heat and Power Market Volume Gigawatt Forecast, by Country 2019 & 2032
- Table 65: Brazil On-Grid Combined Heat and Power Market Revenue (Million) Forecast, by Application 2019 & 2032
- Table 66: Brazil On-Grid Combined Heat and Power Market Volume (Gigawatt) Forecast, by Application 2019 & 2032
- Table 67: Argentina On-Grid Combined Heat and Power Market Revenue (Million) Forecast, by Application 2019 & 2032
- Table 68: Argentina On-Grid Combined Heat and Power Market Volume (Gigawatt) Forecast, by Application 2019 & 2032
- Table 69: Peru On-Grid Combined Heat and Power Market Revenue (Million) Forecast, by Application 2019 & 2032
- Table 70: Peru On-Grid Combined Heat and Power Market Volume (Gigawatt) Forecast, by Application 2019 & 2032
- Table 71: Chile On-Grid Combined Heat and Power Market Revenue (Million) Forecast, by Application 2019 & 2032
- Table 72: Chile On-Grid Combined Heat and Power Market Volume (Gigawatt) Forecast, by Application 2019 & 2032
- Table 73: Colombia On-Grid Combined Heat and Power Market Revenue (Million) Forecast, by Application 2019 & 2032
- Table 74: Colombia On-Grid Combined Heat and Power Market Volume (Gigawatt) Forecast, by Application 2019 & 2032
- Table 75: Ecuador On-Grid Combined Heat and Power Market Revenue (Million) Forecast, by Application 2019 & 2032
- Table 76: Ecuador On-Grid Combined Heat and Power Market Volume (Gigawatt) Forecast, by Application 2019 & 2032
- Table 77: Venezuela On-Grid Combined Heat and Power Market Revenue (Million) Forecast, by Application 2019 & 2032
- Table 78: Venezuela On-Grid Combined Heat and Power Market Volume (Gigawatt) Forecast, by Application 2019 & 2032
- Table 79: Rest of South America On-Grid Combined Heat and Power Market Revenue (Million) Forecast, by Application 2019 & 2032
- Table 80: Rest of South America On-Grid Combined Heat and Power Market Volume (Gigawatt) Forecast, by Application 2019 & 2032
- Table 81: Global On-Grid Combined Heat and Power Market Revenue Million Forecast, by Country 2019 & 2032
- Table 82: Global On-Grid Combined Heat and Power Market Volume Gigawatt Forecast, by Country 2019 & 2032
- Table 83: United Arab Emirates On-Grid Combined Heat and Power Market Revenue (Million) Forecast, by Application 2019 & 2032
- Table 84: United Arab Emirates On-Grid Combined Heat and Power Market Volume (Gigawatt) Forecast, by Application 2019 & 2032
- Table 85: Saudi Arabia On-Grid Combined Heat and Power Market Revenue (Million) Forecast, by Application 2019 & 2032
- Table 86: Saudi Arabia On-Grid Combined Heat and Power Market Volume (Gigawatt) Forecast, by Application 2019 & 2032
- Table 87: South Africa On-Grid Combined Heat and Power Market Revenue (Million) Forecast, by Application 2019 & 2032
- Table 88: South Africa On-Grid Combined Heat and Power Market Volume (Gigawatt) Forecast, by Application 2019 & 2032
- Table 89: Rest of Middle East and Africa On-Grid Combined Heat and Power Market Revenue (Million) Forecast, by Application 2019 & 2032
- Table 90: Rest of Middle East and Africa On-Grid Combined Heat and Power Market Volume (Gigawatt) Forecast, by Application 2019 & 2032
- Table 91: Global On-Grid Combined Heat and Power Market Revenue Million Forecast, by Application 2019 & 2032
- Table 92: Global On-Grid Combined Heat and Power Market Volume Gigawatt Forecast, by Application 2019 & 2032
- Table 93: Global On-Grid Combined Heat and Power Market Revenue Million Forecast, by Fuel Type 2019 & 2032
- Table 94: Global On-Grid Combined Heat and Power Market Volume Gigawatt Forecast, by Fuel Type 2019 & 2032
- Table 95: Global On-Grid Combined Heat and Power Market Revenue Million Forecast, by Country 2019 & 2032
- Table 96: Global On-Grid Combined Heat and Power Market Volume Gigawatt Forecast, by Country 2019 & 2032
- Table 97: Global On-Grid Combined Heat and Power Market Revenue Million Forecast, by Application 2019 & 2032
- Table 98: Global On-Grid Combined Heat and Power Market Volume Gigawatt Forecast, by Application 2019 & 2032
- Table 99: Global On-Grid Combined Heat and Power Market Revenue Million Forecast, by Fuel Type 2019 & 2032
- Table 100: Global On-Grid Combined Heat and Power Market Volume Gigawatt Forecast, by Fuel Type 2019 & 2032
- Table 101: Global On-Grid Combined Heat and Power Market Revenue Million Forecast, by Country 2019 & 2032
- Table 102: Global On-Grid Combined Heat and Power Market Volume Gigawatt Forecast, by Country 2019 & 2032
- Table 103: Global On-Grid Combined Heat and Power Market Revenue Million Forecast, by Application 2019 & 2032
- Table 104: Global On-Grid Combined Heat and Power Market Volume Gigawatt Forecast, by Application 2019 & 2032
- Table 105: Global On-Grid Combined Heat and Power Market Revenue Million Forecast, by Fuel Type 2019 & 2032
- Table 106: Global On-Grid Combined Heat and Power Market Volume Gigawatt Forecast, by Fuel Type 2019 & 2032
- Table 107: Global On-Grid Combined Heat and Power Market Revenue Million Forecast, by Country 2019 & 2032
- Table 108: Global On-Grid Combined Heat and Power Market Volume Gigawatt Forecast, by Country 2019 & 2032
- Table 109: Global On-Grid Combined Heat and Power Market Revenue Million Forecast, by Application 2019 & 2032
- Table 110: Global On-Grid Combined Heat and Power Market Volume Gigawatt Forecast, by Application 2019 & 2032
- Table 111: Global On-Grid Combined Heat and Power Market Revenue Million Forecast, by Fuel Type 2019 & 2032
- Table 112: Global On-Grid Combined Heat and Power Market Volume Gigawatt Forecast, by Fuel Type 2019 & 2032
- Table 113: Global On-Grid Combined Heat and Power Market Revenue Million Forecast, by Country 2019 & 2032
- Table 114: Global On-Grid Combined Heat and Power Market Volume Gigawatt Forecast, by Country 2019 & 2032
- Table 115: Global On-Grid Combined Heat and Power Market Revenue Million Forecast, by Application 2019 & 2032
- Table 116: Global On-Grid Combined Heat and Power Market Volume Gigawatt Forecast, by Application 2019 & 2032
- Table 117: Global On-Grid Combined Heat and Power Market Revenue Million Forecast, by Fuel Type 2019 & 2032
- Table 118: Global On-Grid Combined Heat and Power Market Volume Gigawatt Forecast, by Fuel Type 2019 & 2032
- Table 119: Global On-Grid Combined Heat and Power Market Revenue Million Forecast, by Country 2019 & 2032
- Table 120: Global On-Grid Combined Heat and Power Market Volume Gigawatt Forecast, by Country 2019 & 2032
Frequently Asked Questions
1. What is the projected Compound Annual Growth Rate (CAGR) of the On-Grid Combined Heat and Power Market?
The projected CAGR is approximately > 6.00%.
2. Which companies are prominent players in the On-Grid Combined Heat and Power Market?
Key companies in the market include ABB Ltd, FuelCell Energy Inc, Viessmann Werke, Aegis Energy Services LLC, Bosch Thermotechnology GmbH, Mitsubishi Electric Corporation, Caterpillar Inc, Seimens AG, Centrica PLC, Wartsila Oyj Abp, MAN Diesel & Turbo SE, General Electric Company, Kawasaki Heavy Industries Ltd.
3. What are the main segments of the On-Grid Combined Heat and Power Market?
The market segments include Application, Fuel Type.
4. Can you provide details about the market size?
The market size is estimated to be USD XX Million as of 2022.
5. What are some drivers contributing to market growth?
Supportive Government Policies and Incentives4.; Environmental Concerns.
6. What are the notable trends driving market growth?
Biomass Based Combined Heat and Power to Witness a Significant Growth.
7. Are there any restraints impacting market growth?
Fossil Fuel Subsidies.
8. Can you provide examples of recent developments in the market?
N/A
9. What pricing options are available for accessing the report?
Pricing options include single-user, multi-user, and enterprise licenses priced at USD 4750, USD 5250, and USD 8750 respectively.
10. Is the market size provided in terms of value or volume?
The market size is provided in terms of value, measured in Million and volume, measured in Gigawatt.
11. Are there any specific market keywords associated with the report?
Yes, the market keyword associated with the report is "On-Grid Combined Heat and Power Market," which aids in identifying and referencing the specific market segment covered.
12. How do I determine which pricing option suits my needs best?
The pricing options vary based on user requirements and access needs. Individual users may opt for single-user licenses, while businesses requiring broader access may choose multi-user or enterprise licenses for cost-effective access to the report.
13. Are there any additional resources or data provided in the On-Grid Combined Heat and Power Market report?
While the report offers comprehensive insights, it's advisable to review the specific contents or supplementary materials provided to ascertain if additional resources or data are available.
14. How can I stay updated on further developments or reports in the On-Grid Combined Heat and Power Market?
To stay informed about further developments, trends, and reports in the On-Grid Combined Heat and Power Market, consider subscribing to industry newsletters, following relevant companies and organizations, or regularly checking reputable industry news sources and publications.
Methodology
Step 1 - Identification of Relevant Samples Size from Population Database


Step 2 - Approaches for Defining Global Market Size (Value, Volume* & Price*)

Note*: In applicable scenarios
Step 3 - Data Sources
Primary Research
- Web Analytics
- Survey Reports
- Research Institute
- Latest Research Reports
- Opinion Leaders
Secondary Research
- Annual Reports
- White Paper
- Latest Press Release
- Industry Association
- Paid Database
- Investor Presentations

Step 4 - Data Triangulation
Involves using different sources of information in order to increase the validity of a study
These sources are likely to be stakeholders in a program - participants, other researchers, program staff, other community members, and so on.
Then we put all data in single framework & apply various statistical tools to find out the dynamic on the market.
During the analysis stage, feedback from the stakeholder groups would be compared to determine areas of agreement as well as areas of divergence


