
Key Insights
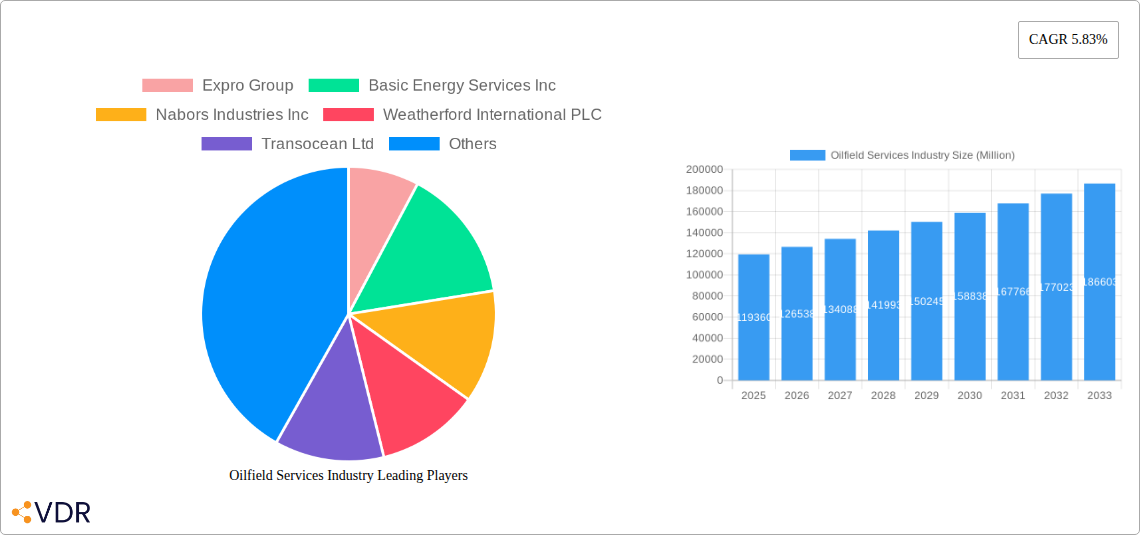
The global oilfield services market, valued at $119.36 billion in 2025, is projected to experience robust growth, driven by increasing global energy demand and ongoing exploration and production activities. A Compound Annual Growth Rate (CAGR) of 5.83% is anticipated from 2025 to 2033, indicating a significant expansion of the market over the forecast period. Key drivers include rising investments in offshore drilling, technological advancements leading to enhanced efficiency and safety in oil and gas extraction, and the growing adoption of digitalization across the oil and gas value chain. The market is segmented by service type (drilling, completion, production & intervention, and others) and location of deployment (onshore and offshore). While offshore services generally command higher pricing, the onshore segment is expected to witness significant growth, particularly in regions with substantial untapped reserves. Growth will be further influenced by government regulations concerning environmental protection and carbon emission reduction, potentially slowing expansion in certain areas. Competitive dynamics are shaped by major players such as Schlumberger, Halliburton, Baker Hughes, and others, who are continuously innovating to improve their service offerings and capture market share.
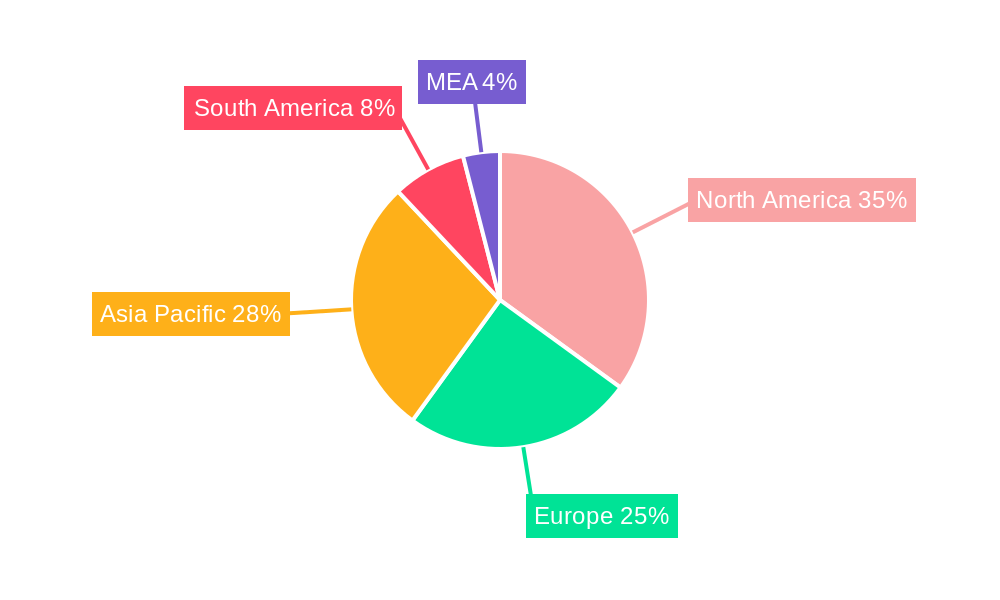
The regional distribution of the oilfield services market is diverse, with North America, Europe, and the Asia-Pacific region representing key market segments. North America, driven by shale gas exploration and production, is expected to retain a substantial market share. However, the Asia-Pacific region, spurred by economic growth and rising energy consumption in developing economies like China and India, is poised for the most significant growth. Europe's market will likely experience moderate growth, influenced by mature oil and gas fields and stricter environmental regulations. South America and the Middle East and Africa (MEA) regions are also important markets, though their growth trajectory will depend on geopolitical factors, investment levels, and the exploration and production activity in these regions. The forecast period will likely witness a continuous evolution of service offerings, with a strong focus on sustainability and technological integration to meet the evolving needs of the oil and gas industry.
Oilfield Services Industry Market Report: 2019-2033
This comprehensive report provides an in-depth analysis of the Oilfield Services industry, encompassing market dynamics, growth trends, regional dominance, product landscape, key players, and future outlook. The study period covers 2019-2033, with 2025 as the base and estimated year. The report delves into both parent and child markets, offering granular insights for strategic decision-making. Market values are presented in Millions.
Oilfield Services Industry Market Dynamics & Structure
The global oilfield services market, valued at xx Million in 2024, is characterized by moderate concentration, with several major players dominating various segments. Technological innovation, particularly in areas like automation, digitalization, and enhanced oil recovery (EOR), are key drivers. Regulatory frameworks, varying significantly across regions, influence operational costs and investment decisions. The market faces competition from substitute technologies like renewable energy sources, impacting overall demand. End-user demographics, primarily driven by exploration and production (E&P) companies and national oil companies (NOCs), significantly shape market dynamics. M&A activity remains a significant feature, with xx deals recorded between 2019 and 2024, primarily focused on consolidation and technological acquisition.
- Market Concentration: Moderately concentrated, with top 10 players holding approximately xx% market share in 2024.
- Technological Innovation: Driven by automation, AI, and data analytics for improved efficiency and reduced operational costs.
- Regulatory Landscape: Varying regulations across regions impact investment decisions and operational costs.
- Competitive Substitutes: Growth of renewable energy sources poses a long-term challenge.
- M&A Activity: xx deals (2019-2024) reflecting consolidation and acquisition of technological capabilities.
- Innovation Barriers: High initial investment costs and technological complexity hinder widespread adoption of certain innovations.
Oilfield Services Industry Growth Trends & Insights
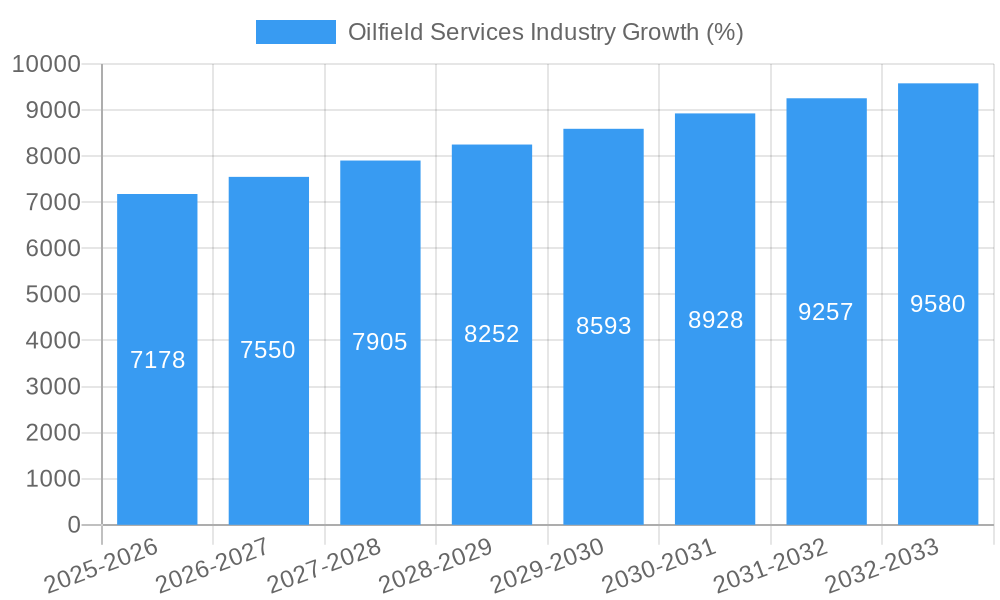
The oilfield services market exhibits a compound annual growth rate (CAGR) of xx% during the forecast period (2025-2033), driven by increasing global energy demand and exploration activities. Market penetration for advanced technologies like automated drilling rigs and remote operations is steadily increasing. Technological disruptions, particularly the adoption of digital twins and AI-powered predictive maintenance, are reshaping operational efficiency and cost structures. Shifts in consumer behavior, including greater emphasis on sustainability and environmental responsibility, are also influencing industry practices. The market size is projected to reach xx Million by 2033.
Dominant Regions, Countries, or Segments in Oilfield Services Industry
The North American region, particularly the US, dominated the oilfield services market in 2024, accounting for xx% of global revenue, followed by the Middle East and Asia Pacific regions. Within service types, Drilling Services holds the largest market share (xx%), driven by consistent exploration and production activities. Offshore deployments represent a significant segment (xx%), fueled by deepwater exploration projects.
- Key Drivers (North America): Robust shale gas production, supportive government policies, and readily available infrastructure.
- Key Drivers (Middle East): Significant oil reserves, large-scale investments in oil and gas projects, and growing demand.
- Key Drivers (Drilling Services): High demand for drilling rigs due to increasing exploration and production activities globally.
- Key Drivers (Offshore Deployment): Focus on deepwater exploration projects in various regions.
- Market Share: North America (xx%), Middle East (xx%), Asia Pacific (xx%), others (xx%).
Oilfield Services Industry Product Landscape
The oilfield services market showcases diverse products encompassing advanced drilling equipment, completion and workover tools, and production optimization solutions. Recent innovations include autonomous drilling systems, intelligent completion technologies, and data-driven analytics platforms for predictive maintenance. These advancements enhance efficiency, reduce operational costs, and improve safety standards. Unique selling propositions (USPs) focus on improved performance, enhanced safety, and reduced environmental impact.
Key Drivers, Barriers & Challenges in Oilfield Services Industry
Key Drivers: Growing global energy demand, rising exploration and production activities in unconventional resources (shale oil and gas), technological advancements, and government support for energy infrastructure development.
Key Challenges: Fluctuating oil and gas prices, environmental regulations, geopolitical uncertainties, supply chain disruptions, and intense competition. Supply chain bottlenecks caused a xx% increase in input costs in 2022, affecting profitability.
Emerging Opportunities in Oilfield Services Industry
Emerging opportunities lie in developing sustainable oilfield technologies, expanding into untapped markets in Africa and South America, and providing services for carbon capture, utilization, and storage (CCUS). The demand for enhanced oil recovery (EOR) technologies and digital solutions for optimizing oil and gas production continues to grow.
Growth Accelerators in the Oilfield Services Industry
Technological breakthroughs in automation, AI, and data analytics are accelerating market growth. Strategic partnerships between service providers and E&P companies facilitate the adoption of new technologies and optimize operations. Expansion into new geographic markets with significant oil and gas potential presents significant growth opportunities.
Key Players Shaping the Oilfield Services Industry Market
- Expro Group
- Basic Energy Services Inc
- Nabors Industries Inc
- Weatherford International PLC
- Transocean Ltd
- Baker Hughes Company
- China Oilfield Services Limited
- Halliburton Company
- OiLSERV
- Schlumberger Limited
- Valaris PLC
Notable Milestones in Oilfield Services Industry Sector
- September 2023: Schlumberger Limited (SLB) signed a subsurface technology agreement with INEOS Energy, focusing on AI-driven operational improvements and CCS.
- April 2023: QatarEnergy and Shell PLC agreed to explore the C-10 block offshore Mauritania, potentially driving demand for offshore oilfield services.
In-Depth Oilfield Services Industry Market Outlook
The oilfield services market is poised for significant growth driven by continuous technological advancements, increasing global energy demand, and exploration activities in new and existing fields. Strategic partnerships, expansion into emerging markets, and the adoption of sustainable practices present lucrative opportunities for market players. The market's long-term outlook is positive, reflecting the sustained need for efficient and technologically advanced oil and gas extraction and production.
Oilfield Services Industry Segmentation
-
1. Service Type
- 1.1. Drilling Services
- 1.2. Completion Services
- 1.3. Production and Intervention Services
- 1.4. Other Services
-
2. Location of Deployment
- 2.1. Onshore
- 2.2. Offshore
Oilfield Services Industry Segmentation By Geography
-
1. North America
- 1.1. United States
- 1.2. Canada
- 1.3. Rest of North America
-
2. Europe
- 2.1. Germany
- 2.2. France
- 2.3. United Kingdom
- 2.4. Italy
- 2.5. Russia
- 2.6. Spain
- 2.7. NORDIC
- 2.8. Turkey
- 2.9. Rest of Europe
-
3. Asia Pacific
- 3.1. China
- 3.2. India
- 3.3. Japan
- 3.4. South Korea
- 3.5. Malaysia
- 3.6. Thailand
- 3.7. Vietnam
- 3.8. Rest of Asia Pacific
-
4. South America
- 4.1. Brazil
- 4.2. Argentina
- 4.3. Colombia
- 4.4. Rest of South America
-
5. Middle East and Africa
- 5.1. Saudi Arabia
- 5.2. United Arab Emirates
- 5.3. South Africa
- 5.4. Nigeria
- 5.5. Qatar
- 5.6. Egypt
- 5.7. Rest of the Middle East and Africa
Oilfield Services Industry REPORT HIGHLIGHTS
| Aspects | Details |
|---|---|
| Study Period | 2019-2033 |
| Base Year | 2024 |
| Estimated Year | 2025 |
| Forecast Period | 2025-2033 |
| Historical Period | 2019-2024 |
| Growth Rate | CAGR of 5.83% from 2019-2033 |
| Segmentation |
|
Table of Contents
- 1. Introduction
- 1.1. Research Scope
- 1.2. Market Segmentation
- 1.3. Research Methodology
- 1.4. Definitions and Assumptions
- 2. Executive Summary
- 2.1. Introduction
- 3. Market Dynamics
- 3.1. Introduction
- 3.2. Market Drivers
- 3.2.1 4.; Increasing Development of Gas Reserves and Advanced Technology
- 3.2.2 Tools
- 3.2.3 and Equipment4.; Increasing Investment in the Oilfield Services across World
- 3.3. Market Restrains
- 3.3.1 4.; The Volatile Oil Prices Over the Recent Period
- 3.3.2 Owing to the Supply-Demand Gap
- 3.4. Market Trends
- 3.4.1. Drilling Services Are Expected to Dominate the Market
- 4. Market Factor Analysis
- 4.1. Porters Five Forces
- 4.2. Supply/Value Chain
- 4.3. PESTEL analysis
- 4.4. Market Entropy
- 4.5. Patent/Trademark Analysis
- 5. Global Oilfield Services Industry Analysis, Insights and Forecast, 2019-2031
- 5.1. Market Analysis, Insights and Forecast - by Service Type
- 5.1.1. Drilling Services
- 5.1.2. Completion Services
- 5.1.3. Production and Intervention Services
- 5.1.4. Other Services
- 5.2. Market Analysis, Insights and Forecast - by Location of Deployment
- 5.2.1. Onshore
- 5.2.2. Offshore
- 5.3. Market Analysis, Insights and Forecast - by Region
- 5.3.1. North America
- 5.3.2. Europe
- 5.3.3. Asia Pacific
- 5.3.4. South America
- 5.3.5. Middle East and Africa
- 5.1. Market Analysis, Insights and Forecast - by Service Type
- 6. North America Oilfield Services Industry Analysis, Insights and Forecast, 2019-2031
- 6.1. Market Analysis, Insights and Forecast - by Service Type
- 6.1.1. Drilling Services
- 6.1.2. Completion Services
- 6.1.3. Production and Intervention Services
- 6.1.4. Other Services
- 6.2. Market Analysis, Insights and Forecast - by Location of Deployment
- 6.2.1. Onshore
- 6.2.2. Offshore
- 6.1. Market Analysis, Insights and Forecast - by Service Type
- 7. Europe Oilfield Services Industry Analysis, Insights and Forecast, 2019-2031
- 7.1. Market Analysis, Insights and Forecast - by Service Type
- 7.1.1. Drilling Services
- 7.1.2. Completion Services
- 7.1.3. Production and Intervention Services
- 7.1.4. Other Services
- 7.2. Market Analysis, Insights and Forecast - by Location of Deployment
- 7.2.1. Onshore
- 7.2.2. Offshore
- 7.1. Market Analysis, Insights and Forecast - by Service Type
- 8. Asia Pacific Oilfield Services Industry Analysis, Insights and Forecast, 2019-2031
- 8.1. Market Analysis, Insights and Forecast - by Service Type
- 8.1.1. Drilling Services
- 8.1.2. Completion Services
- 8.1.3. Production and Intervention Services
- 8.1.4. Other Services
- 8.2. Market Analysis, Insights and Forecast - by Location of Deployment
- 8.2.1. Onshore
- 8.2.2. Offshore
- 8.1. Market Analysis, Insights and Forecast - by Service Type
- 9. South America Oilfield Services Industry Analysis, Insights and Forecast, 2019-2031
- 9.1. Market Analysis, Insights and Forecast - by Service Type
- 9.1.1. Drilling Services
- 9.1.2. Completion Services
- 9.1.3. Production and Intervention Services
- 9.1.4. Other Services
- 9.2. Market Analysis, Insights and Forecast - by Location of Deployment
- 9.2.1. Onshore
- 9.2.2. Offshore
- 9.1. Market Analysis, Insights and Forecast - by Service Type
- 10. Middle East and Africa Oilfield Services Industry Analysis, Insights and Forecast, 2019-2031
- 10.1. Market Analysis, Insights and Forecast - by Service Type
- 10.1.1. Drilling Services
- 10.1.2. Completion Services
- 10.1.3. Production and Intervention Services
- 10.1.4. Other Services
- 10.2. Market Analysis, Insights and Forecast - by Location of Deployment
- 10.2.1. Onshore
- 10.2.2. Offshore
- 10.1. Market Analysis, Insights and Forecast - by Service Type
- 11. North America Oilfield Services Industry Analysis, Insights and Forecast, 2019-2031
- 11.1. Market Analysis, Insights and Forecast - By Country/Sub-region
- 11.1.1 United States
- 11.1.2 Canada
- 11.1.3 Mexico
- 12. Europe Oilfield Services Industry Analysis, Insights and Forecast, 2019-2031
- 12.1. Market Analysis, Insights and Forecast - By Country/Sub-region
- 12.1.1 Germany
- 12.1.2 United Kingdom
- 12.1.3 France
- 12.1.4 Spain
- 12.1.5 Italy
- 12.1.6 Spain
- 12.1.7 Belgium
- 12.1.8 Netherland
- 12.1.9 Nordics
- 12.1.10 Rest of Europe
- 13. Asia Pacific Oilfield Services Industry Analysis, Insights and Forecast, 2019-2031
- 13.1. Market Analysis, Insights and Forecast - By Country/Sub-region
- 13.1.1 China
- 13.1.2 Japan
- 13.1.3 India
- 13.1.4 South Korea
- 13.1.5 Southeast Asia
- 13.1.6 Australia
- 13.1.7 Indonesia
- 13.1.8 Phillipes
- 13.1.9 Singapore
- 13.1.10 Thailandc
- 13.1.11 Rest of Asia Pacific
- 14. South America Oilfield Services Industry Analysis, Insights and Forecast, 2019-2031
- 14.1. Market Analysis, Insights and Forecast - By Country/Sub-region
- 14.1.1 Brazil
- 14.1.2 Argentina
- 14.1.3 Peru
- 14.1.4 Chile
- 14.1.5 Colombia
- 14.1.6 Ecuador
- 14.1.7 Venezuela
- 14.1.8 Rest of South America
- 15. MEA Oilfield Services Industry Analysis, Insights and Forecast, 2019-2031
- 15.1. Market Analysis, Insights and Forecast - By Country/Sub-region
- 15.1.1 United Arab Emirates
- 15.1.2 Saudi Arabia
- 15.1.3 South Africa
- 15.1.4 Rest of Middle East and Africa
- 16. Competitive Analysis
- 16.1. Global Market Share Analysis 2024
- 16.2. Company Profiles
- 16.2.1 Expro Group
- 16.2.1.1. Overview
- 16.2.1.2. Products
- 16.2.1.3. SWOT Analysis
- 16.2.1.4. Recent Developments
- 16.2.1.5. Financials (Based on Availability)
- 16.2.2 Basic Energy Services Inc
- 16.2.2.1. Overview
- 16.2.2.2. Products
- 16.2.2.3. SWOT Analysis
- 16.2.2.4. Recent Developments
- 16.2.2.5. Financials (Based on Availability)
- 16.2.3 Nabors Industries Inc
- 16.2.3.1. Overview
- 16.2.3.2. Products
- 16.2.3.3. SWOT Analysis
- 16.2.3.4. Recent Developments
- 16.2.3.5. Financials (Based on Availability)
- 16.2.4 Weatherford International PLC
- 16.2.4.1. Overview
- 16.2.4.2. Products
- 16.2.4.3. SWOT Analysis
- 16.2.4.4. Recent Developments
- 16.2.4.5. Financials (Based on Availability)
- 16.2.5 Transocean Ltd
- 16.2.5.1. Overview
- 16.2.5.2. Products
- 16.2.5.3. SWOT Analysis
- 16.2.5.4. Recent Developments
- 16.2.5.5. Financials (Based on Availability)
- 16.2.6 Baker Hughes Company
- 16.2.6.1. Overview
- 16.2.6.2. Products
- 16.2.6.3. SWOT Analysis
- 16.2.6.4. Recent Developments
- 16.2.6.5. Financials (Based on Availability)
- 16.2.7 China Oilfield Services Limited
- 16.2.7.1. Overview
- 16.2.7.2. Products
- 16.2.7.3. SWOT Analysis
- 16.2.7.4. Recent Developments
- 16.2.7.5. Financials (Based on Availability)
- 16.2.8 Halliburton Company
- 16.2.8.1. Overview
- 16.2.8.2. Products
- 16.2.8.3. SWOT Analysis
- 16.2.8.4. Recent Developments
- 16.2.8.5. Financials (Based on Availability)
- 16.2.9 OiLSERV
- 16.2.9.1. Overview
- 16.2.9.2. Products
- 16.2.9.3. SWOT Analysis
- 16.2.9.4. Recent Developments
- 16.2.9.5. Financials (Based on Availability)
- 16.2.10 Schlumberger Limited
- 16.2.10.1. Overview
- 16.2.10.2. Products
- 16.2.10.3. SWOT Analysis
- 16.2.10.4. Recent Developments
- 16.2.10.5. Financials (Based on Availability)
- 16.2.11 Valaris PLC
- 16.2.11.1. Overview
- 16.2.11.2. Products
- 16.2.11.3. SWOT Analysis
- 16.2.11.4. Recent Developments
- 16.2.11.5. Financials (Based on Availability)
- 16.2.1 Expro Group
List of Figures
- Figure 1: Global Oilfield Services Industry Revenue Breakdown (Million, %) by Region 2024 & 2032
- Figure 2: North America Oilfield Services Industry Revenue (Million), by Country 2024 & 2032
- Figure 3: North America Oilfield Services Industry Revenue Share (%), by Country 2024 & 2032
- Figure 4: Europe Oilfield Services Industry Revenue (Million), by Country 2024 & 2032
- Figure 5: Europe Oilfield Services Industry Revenue Share (%), by Country 2024 & 2032
- Figure 6: Asia Pacific Oilfield Services Industry Revenue (Million), by Country 2024 & 2032
- Figure 7: Asia Pacific Oilfield Services Industry Revenue Share (%), by Country 2024 & 2032
- Figure 8: South America Oilfield Services Industry Revenue (Million), by Country 2024 & 2032
- Figure 9: South America Oilfield Services Industry Revenue Share (%), by Country 2024 & 2032
- Figure 10: MEA Oilfield Services Industry Revenue (Million), by Country 2024 & 2032
- Figure 11: MEA Oilfield Services Industry Revenue Share (%), by Country 2024 & 2032
- Figure 12: North America Oilfield Services Industry Revenue (Million), by Service Type 2024 & 2032
- Figure 13: North America Oilfield Services Industry Revenue Share (%), by Service Type 2024 & 2032
- Figure 14: North America Oilfield Services Industry Revenue (Million), by Location of Deployment 2024 & 2032
- Figure 15: North America Oilfield Services Industry Revenue Share (%), by Location of Deployment 2024 & 2032
- Figure 16: North America Oilfield Services Industry Revenue (Million), by Country 2024 & 2032
- Figure 17: North America Oilfield Services Industry Revenue Share (%), by Country 2024 & 2032
- Figure 18: Europe Oilfield Services Industry Revenue (Million), by Service Type 2024 & 2032
- Figure 19: Europe Oilfield Services Industry Revenue Share (%), by Service Type 2024 & 2032
- Figure 20: Europe Oilfield Services Industry Revenue (Million), by Location of Deployment 2024 & 2032
- Figure 21: Europe Oilfield Services Industry Revenue Share (%), by Location of Deployment 2024 & 2032
- Figure 22: Europe Oilfield Services Industry Revenue (Million), by Country 2024 & 2032
- Figure 23: Europe Oilfield Services Industry Revenue Share (%), by Country 2024 & 2032
- Figure 24: Asia Pacific Oilfield Services Industry Revenue (Million), by Service Type 2024 & 2032
- Figure 25: Asia Pacific Oilfield Services Industry Revenue Share (%), by Service Type 2024 & 2032
- Figure 26: Asia Pacific Oilfield Services Industry Revenue (Million), by Location of Deployment 2024 & 2032
- Figure 27: Asia Pacific Oilfield Services Industry Revenue Share (%), by Location of Deployment 2024 & 2032
- Figure 28: Asia Pacific Oilfield Services Industry Revenue (Million), by Country 2024 & 2032
- Figure 29: Asia Pacific Oilfield Services Industry Revenue Share (%), by Country 2024 & 2032
- Figure 30: South America Oilfield Services Industry Revenue (Million), by Service Type 2024 & 2032
- Figure 31: South America Oilfield Services Industry Revenue Share (%), by Service Type 2024 & 2032
- Figure 32: South America Oilfield Services Industry Revenue (Million), by Location of Deployment 2024 & 2032
- Figure 33: South America Oilfield Services Industry Revenue Share (%), by Location of Deployment 2024 & 2032
- Figure 34: South America Oilfield Services Industry Revenue (Million), by Country 2024 & 2032
- Figure 35: South America Oilfield Services Industry Revenue Share (%), by Country 2024 & 2032
- Figure 36: Middle East and Africa Oilfield Services Industry Revenue (Million), by Service Type 2024 & 2032
- Figure 37: Middle East and Africa Oilfield Services Industry Revenue Share (%), by Service Type 2024 & 2032
- Figure 38: Middle East and Africa Oilfield Services Industry Revenue (Million), by Location of Deployment 2024 & 2032
- Figure 39: Middle East and Africa Oilfield Services Industry Revenue Share (%), by Location of Deployment 2024 & 2032
- Figure 40: Middle East and Africa Oilfield Services Industry Revenue (Million), by Country 2024 & 2032
- Figure 41: Middle East and Africa Oilfield Services Industry Revenue Share (%), by Country 2024 & 2032
List of Tables
- Table 1: Global Oilfield Services Industry Revenue Million Forecast, by Region 2019 & 2032
- Table 2: Global Oilfield Services Industry Revenue Million Forecast, by Service Type 2019 & 2032
- Table 3: Global Oilfield Services Industry Revenue Million Forecast, by Location of Deployment 2019 & 2032
- Table 4: Global Oilfield Services Industry Revenue Million Forecast, by Region 2019 & 2032
- Table 5: Global Oilfield Services Industry Revenue Million Forecast, by Country 2019 & 2032
- Table 6: United States Oilfield Services Industry Revenue (Million) Forecast, by Application 2019 & 2032
- Table 7: Canada Oilfield Services Industry Revenue (Million) Forecast, by Application 2019 & 2032
- Table 8: Mexico Oilfield Services Industry Revenue (Million) Forecast, by Application 2019 & 2032
- Table 9: Global Oilfield Services Industry Revenue Million Forecast, by Country 2019 & 2032
- Table 10: Germany Oilfield Services Industry Revenue (Million) Forecast, by Application 2019 & 2032
- Table 11: United Kingdom Oilfield Services Industry Revenue (Million) Forecast, by Application 2019 & 2032
- Table 12: France Oilfield Services Industry Revenue (Million) Forecast, by Application 2019 & 2032
- Table 13: Spain Oilfield Services Industry Revenue (Million) Forecast, by Application 2019 & 2032
- Table 14: Italy Oilfield Services Industry Revenue (Million) Forecast, by Application 2019 & 2032
- Table 15: Spain Oilfield Services Industry Revenue (Million) Forecast, by Application 2019 & 2032
- Table 16: Belgium Oilfield Services Industry Revenue (Million) Forecast, by Application 2019 & 2032
- Table 17: Netherland Oilfield Services Industry Revenue (Million) Forecast, by Application 2019 & 2032
- Table 18: Nordics Oilfield Services Industry Revenue (Million) Forecast, by Application 2019 & 2032
- Table 19: Rest of Europe Oilfield Services Industry Revenue (Million) Forecast, by Application 2019 & 2032
- Table 20: Global Oilfield Services Industry Revenue Million Forecast, by Country 2019 & 2032
- Table 21: China Oilfield Services Industry Revenue (Million) Forecast, by Application 2019 & 2032
- Table 22: Japan Oilfield Services Industry Revenue (Million) Forecast, by Application 2019 & 2032
- Table 23: India Oilfield Services Industry Revenue (Million) Forecast, by Application 2019 & 2032
- Table 24: South Korea Oilfield Services Industry Revenue (Million) Forecast, by Application 2019 & 2032
- Table 25: Southeast Asia Oilfield Services Industry Revenue (Million) Forecast, by Application 2019 & 2032
- Table 26: Australia Oilfield Services Industry Revenue (Million) Forecast, by Application 2019 & 2032
- Table 27: Indonesia Oilfield Services Industry Revenue (Million) Forecast, by Application 2019 & 2032
- Table 28: Phillipes Oilfield Services Industry Revenue (Million) Forecast, by Application 2019 & 2032
- Table 29: Singapore Oilfield Services Industry Revenue (Million) Forecast, by Application 2019 & 2032
- Table 30: Thailandc Oilfield Services Industry Revenue (Million) Forecast, by Application 2019 & 2032
- Table 31: Rest of Asia Pacific Oilfield Services Industry Revenue (Million) Forecast, by Application 2019 & 2032
- Table 32: Global Oilfield Services Industry Revenue Million Forecast, by Country 2019 & 2032
- Table 33: Brazil Oilfield Services Industry Revenue (Million) Forecast, by Application 2019 & 2032
- Table 34: Argentina Oilfield Services Industry Revenue (Million) Forecast, by Application 2019 & 2032
- Table 35: Peru Oilfield Services Industry Revenue (Million) Forecast, by Application 2019 & 2032
- Table 36: Chile Oilfield Services Industry Revenue (Million) Forecast, by Application 2019 & 2032
- Table 37: Colombia Oilfield Services Industry Revenue (Million) Forecast, by Application 2019 & 2032
- Table 38: Ecuador Oilfield Services Industry Revenue (Million) Forecast, by Application 2019 & 2032
- Table 39: Venezuela Oilfield Services Industry Revenue (Million) Forecast, by Application 2019 & 2032
- Table 40: Rest of South America Oilfield Services Industry Revenue (Million) Forecast, by Application 2019 & 2032
- Table 41: Global Oilfield Services Industry Revenue Million Forecast, by Country 2019 & 2032
- Table 42: United Arab Emirates Oilfield Services Industry Revenue (Million) Forecast, by Application 2019 & 2032
- Table 43: Saudi Arabia Oilfield Services Industry Revenue (Million) Forecast, by Application 2019 & 2032
- Table 44: South Africa Oilfield Services Industry Revenue (Million) Forecast, by Application 2019 & 2032
- Table 45: Rest of Middle East and Africa Oilfield Services Industry Revenue (Million) Forecast, by Application 2019 & 2032
- Table 46: Global Oilfield Services Industry Revenue Million Forecast, by Service Type 2019 & 2032
- Table 47: Global Oilfield Services Industry Revenue Million Forecast, by Location of Deployment 2019 & 2032
- Table 48: Global Oilfield Services Industry Revenue Million Forecast, by Country 2019 & 2032
- Table 49: United States Oilfield Services Industry Revenue (Million) Forecast, by Application 2019 & 2032
- Table 50: Canada Oilfield Services Industry Revenue (Million) Forecast, by Application 2019 & 2032
- Table 51: Rest of North America Oilfield Services Industry Revenue (Million) Forecast, by Application 2019 & 2032
- Table 52: Global Oilfield Services Industry Revenue Million Forecast, by Service Type 2019 & 2032
- Table 53: Global Oilfield Services Industry Revenue Million Forecast, by Location of Deployment 2019 & 2032
- Table 54: Global Oilfield Services Industry Revenue Million Forecast, by Country 2019 & 2032
- Table 55: Germany Oilfield Services Industry Revenue (Million) Forecast, by Application 2019 & 2032
- Table 56: France Oilfield Services Industry Revenue (Million) Forecast, by Application 2019 & 2032
- Table 57: United Kingdom Oilfield Services Industry Revenue (Million) Forecast, by Application 2019 & 2032
- Table 58: Italy Oilfield Services Industry Revenue (Million) Forecast, by Application 2019 & 2032
- Table 59: Russia Oilfield Services Industry Revenue (Million) Forecast, by Application 2019 & 2032
- Table 60: Spain Oilfield Services Industry Revenue (Million) Forecast, by Application 2019 & 2032
- Table 61: NORDIC Oilfield Services Industry Revenue (Million) Forecast, by Application 2019 & 2032
- Table 62: Turkey Oilfield Services Industry Revenue (Million) Forecast, by Application 2019 & 2032
- Table 63: Rest of Europe Oilfield Services Industry Revenue (Million) Forecast, by Application 2019 & 2032
- Table 64: Global Oilfield Services Industry Revenue Million Forecast, by Service Type 2019 & 2032
- Table 65: Global Oilfield Services Industry Revenue Million Forecast, by Location of Deployment 2019 & 2032
- Table 66: Global Oilfield Services Industry Revenue Million Forecast, by Country 2019 & 2032
- Table 67: China Oilfield Services Industry Revenue (Million) Forecast, by Application 2019 & 2032
- Table 68: India Oilfield Services Industry Revenue (Million) Forecast, by Application 2019 & 2032
- Table 69: Japan Oilfield Services Industry Revenue (Million) Forecast, by Application 2019 & 2032
- Table 70: South Korea Oilfield Services Industry Revenue (Million) Forecast, by Application 2019 & 2032
- Table 71: Malaysia Oilfield Services Industry Revenue (Million) Forecast, by Application 2019 & 2032
- Table 72: Thailand Oilfield Services Industry Revenue (Million) Forecast, by Application 2019 & 2032
- Table 73: Vietnam Oilfield Services Industry Revenue (Million) Forecast, by Application 2019 & 2032
- Table 74: Rest of Asia Pacific Oilfield Services Industry Revenue (Million) Forecast, by Application 2019 & 2032
- Table 75: Global Oilfield Services Industry Revenue Million Forecast, by Service Type 2019 & 2032
- Table 76: Global Oilfield Services Industry Revenue Million Forecast, by Location of Deployment 2019 & 2032
- Table 77: Global Oilfield Services Industry Revenue Million Forecast, by Country 2019 & 2032
- Table 78: Brazil Oilfield Services Industry Revenue (Million) Forecast, by Application 2019 & 2032
- Table 79: Argentina Oilfield Services Industry Revenue (Million) Forecast, by Application 2019 & 2032
- Table 80: Colombia Oilfield Services Industry Revenue (Million) Forecast, by Application 2019 & 2032
- Table 81: Rest of South America Oilfield Services Industry Revenue (Million) Forecast, by Application 2019 & 2032
- Table 82: Global Oilfield Services Industry Revenue Million Forecast, by Service Type 2019 & 2032
- Table 83: Global Oilfield Services Industry Revenue Million Forecast, by Location of Deployment 2019 & 2032
- Table 84: Global Oilfield Services Industry Revenue Million Forecast, by Country 2019 & 2032
- Table 85: Saudi Arabia Oilfield Services Industry Revenue (Million) Forecast, by Application 2019 & 2032
- Table 86: United Arab Emirates Oilfield Services Industry Revenue (Million) Forecast, by Application 2019 & 2032
- Table 87: South Africa Oilfield Services Industry Revenue (Million) Forecast, by Application 2019 & 2032
- Table 88: Nigeria Oilfield Services Industry Revenue (Million) Forecast, by Application 2019 & 2032
- Table 89: Qatar Oilfield Services Industry Revenue (Million) Forecast, by Application 2019 & 2032
- Table 90: Egypt Oilfield Services Industry Revenue (Million) Forecast, by Application 2019 & 2032
- Table 91: Rest of the Middle East and Africa Oilfield Services Industry Revenue (Million) Forecast, by Application 2019 & 2032
Frequently Asked Questions
1. What is the projected Compound Annual Growth Rate (CAGR) of the Oilfield Services Industry?
The projected CAGR is approximately 5.83%.
2. Which companies are prominent players in the Oilfield Services Industry?
Key companies in the market include Expro Group, Basic Energy Services Inc, Nabors Industries Inc, Weatherford International PLC, Transocean Ltd, Baker Hughes Company, China Oilfield Services Limited, Halliburton Company, OiLSERV, Schlumberger Limited, Valaris PLC.
3. What are the main segments of the Oilfield Services Industry?
The market segments include Service Type, Location of Deployment.
4. Can you provide details about the market size?
The market size is estimated to be USD 119.36 Million as of 2022.
5. What are some drivers contributing to market growth?
4.; Increasing Development of Gas Reserves and Advanced Technology. Tools. and Equipment4.; Increasing Investment in the Oilfield Services across World.
6. What are the notable trends driving market growth?
Drilling Services Are Expected to Dominate the Market.
7. Are there any restraints impacting market growth?
4.; The Volatile Oil Prices Over the Recent Period. Owing to the Supply-Demand Gap.
8. Can you provide examples of recent developments in the market?
September 2023: SLB signed a subsurface technology agreement with INEOS Energy, the energy division of INEOS, a global chemical and manufacturing company. INEOS Energy will partner with SLB’s Performance Centre in Aberdeen to collaborate and innovate subsurface technologies, including AI capabilities, to help it drive operational performance for continued growth, new acquisitions, and carbon capture and storage (CCS).
9. What pricing options are available for accessing the report?
Pricing options include single-user, multi-user, and enterprise licenses priced at USD 4750, USD 5250, and USD 8750 respectively.
10. Is the market size provided in terms of value or volume?
The market size is provided in terms of value, measured in Million.
11. Are there any specific market keywords associated with the report?
Yes, the market keyword associated with the report is "Oilfield Services Industry," which aids in identifying and referencing the specific market segment covered.
12. How do I determine which pricing option suits my needs best?
The pricing options vary based on user requirements and access needs. Individual users may opt for single-user licenses, while businesses requiring broader access may choose multi-user or enterprise licenses for cost-effective access to the report.
13. Are there any additional resources or data provided in the Oilfield Services Industry report?
While the report offers comprehensive insights, it's advisable to review the specific contents or supplementary materials provided to ascertain if additional resources or data are available.
14. How can I stay updated on further developments or reports in the Oilfield Services Industry?
To stay informed about further developments, trends, and reports in the Oilfield Services Industry, consider subscribing to industry newsletters, following relevant companies and organizations, or regularly checking reputable industry news sources and publications.
Methodology
Step 1 - Identification of Relevant Samples Size from Population Database


Step 2 - Approaches for Defining Global Market Size (Value, Volume* & Price*)

Note*: In applicable scenarios
Step 3 - Data Sources
Primary Research
- Web Analytics
- Survey Reports
- Research Institute
- Latest Research Reports
- Opinion Leaders
Secondary Research
- Annual Reports
- White Paper
- Latest Press Release
- Industry Association
- Paid Database
- Investor Presentations

Step 4 - Data Triangulation
Involves using different sources of information in order to increase the validity of a study
These sources are likely to be stakeholders in a program - participants, other researchers, program staff, other community members, and so on.
Then we put all data in single framework & apply various statistical tools to find out the dynamic on the market.
During the analysis stage, feedback from the stakeholder groups would be compared to determine areas of agreement as well as areas of divergence


