
Key Insights
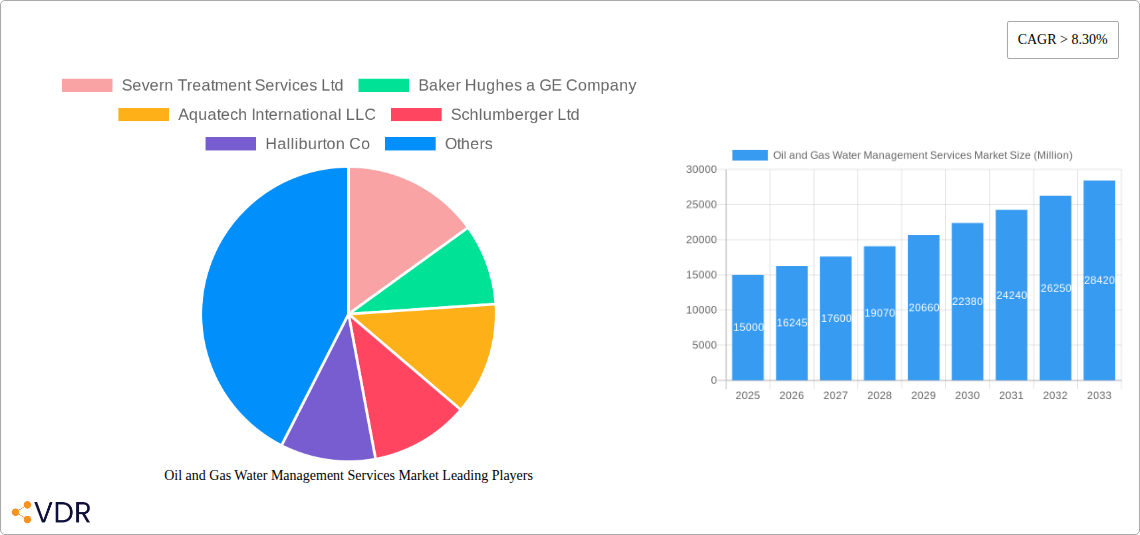
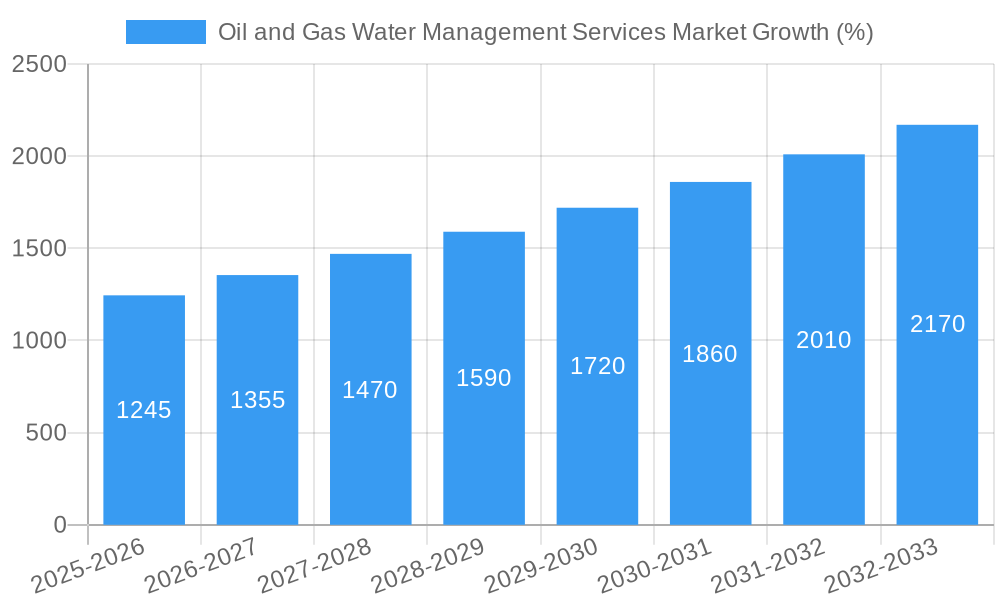
The Oil and Gas Water Management Services market is experiencing robust growth, projected to maintain a Compound Annual Growth Rate (CAGR) exceeding 8.30% from 2025 to 2033. This expansion is driven by several key factors. Firstly, increasing environmental regulations globally are pushing oil and gas operators to adopt more sustainable water management practices, reducing their environmental footprint and minimizing risks associated with water pollution. Secondly, the rising complexity of oil and gas extraction, particularly in unconventional resources like shale gas, necessitates sophisticated water management solutions to handle larger volumes of produced water efficiently and cost-effectively. Technological advancements in water treatment technologies, such as membrane filtration and advanced oxidation processes, are also contributing to market growth by improving efficiency and reducing operational costs. Finally, the growing focus on water recycling and reuse within the industry is fostering innovation and market expansion. The market is segmented by services (water disposal, hauling, treatment, and others) and sectors (upstream, downstream). Upstream activities, such as drilling and production, generate significant water volumes, driving demand for disposal and treatment services. Downstream operations, including refining and processing, also contribute to market demand, although potentially with different water management needs. Key players in this market include established multinational companies like Schlumberger, Halliburton, and Baker Hughes, alongside specialized service providers like Aquatech International and Nuverra Environmental Solutions. Regional variations in market growth are expected, with North America and the Asia-Pacific region anticipated to lead the growth due to high oil and gas production activities and stringent environmental regulations in these areas.
The competitive landscape is characterized by both large multinational corporations and specialized smaller companies. The market's future trajectory will be shaped by further technological innovations in water treatment, the implementation of stricter environmental regulations, fluctuations in oil and gas prices, and the adoption of circular economy principles within the industry. Growth will be influenced by the increasing adoption of sustainable practices, leading to increased investment in water treatment infrastructure and technology. The market will likely witness increased consolidation as larger companies acquire smaller specialized firms to expand their service offerings and geographic reach. A continued focus on improving operational efficiency and reducing the overall environmental impact of oil and gas production will remain a central theme, driving demand for advanced water management solutions throughout the forecast period.
Oil and Gas Water Management Services Market: A Comprehensive Report (2019-2033)
This in-depth report provides a comprehensive analysis of the Oil and Gas Water Management Services market, encompassing market dynamics, growth trends, regional analysis, competitive landscape, and future outlook. The study covers the period from 2019 to 2033, with a focus on the base year 2025 and a forecast period from 2025 to 2033. The market is segmented by sector (Upstream, Downstream) and services (Water Disposal Services, Water Hauling Services, Produced Water Treatment Services, Others). The report’s insights are crucial for industry professionals, investors, and stakeholders seeking to navigate this dynamic market. The market size in 2025 is estimated at xx Million.
Oil and Gas Water Management Services Market Market Dynamics & Structure
The Oil and Gas Water Management Services market is characterized by a moderately concentrated landscape, with key players such as Baker Hughes a GE Company, Schlumberger Ltd, and Halliburton Co holding significant market share. Market concentration is influenced by factors like technological expertise, operational scale, and access to capital. Technological innovation, driven by the need for efficient and environmentally friendly water management solutions, is a key market driver. Stringent regulatory frameworks concerning water discharge and environmental protection significantly impact market dynamics, pushing companies to adopt advanced treatment technologies. The market also witnesses competitive pressures from substitute technologies focusing on water recycling and reuse. End-user demographics, primarily driven by the oil and gas industry’s operational footprint and activity levels in different regions, shape market demand. Finally, M&A activity, observed at a rate of xx deals annually in the historical period (2019-2024), reflects consolidation trends and attempts to gain a competitive edge.
- Market Concentration: Moderately concentrated, with top 5 players holding xx% market share in 2025.
- Technological Innovation: Focus on automation, AI-powered optimization, and sustainable water treatment technologies.
- Regulatory Landscape: Stringent environmental regulations driving adoption of advanced treatment methods.
- Competitive Substitutes: Water recycling and reuse technologies posing competitive pressure.
- M&A Activity: xx deals annually (2019-2024), indicating consolidation and strategic expansion.
- Innovation Barriers: High initial investment costs for advanced technologies and regulatory approvals.
Oil and Gas Water Management Services Market Growth Trends & Insights
The Oil and Gas Water Management Services market experienced robust growth during the historical period (2019-2024), with a CAGR of xx%. This growth is primarily fueled by increasing oil and gas production activities, particularly in regions like North America and the Middle East. The adoption rate of advanced water treatment technologies is steadily increasing, driven by stricter environmental regulations and rising awareness of the environmental impact of produced water. Technological disruptions, such as the emergence of membrane filtration and advanced oxidation processes, are transforming the market landscape. Consumer behavior shifts, towards environmentally sustainable practices, are influencing market demand for eco-friendly water management solutions. The market is expected to maintain a healthy growth trajectory during the forecast period (2025-2033), with a projected CAGR of xx%, reaching a market size of xx Million by 2033. Market penetration of advanced technologies is expected to reach xx% by 2033.
Dominant Regions, Countries, or Segments in Oil and Gas Water Management Services Market
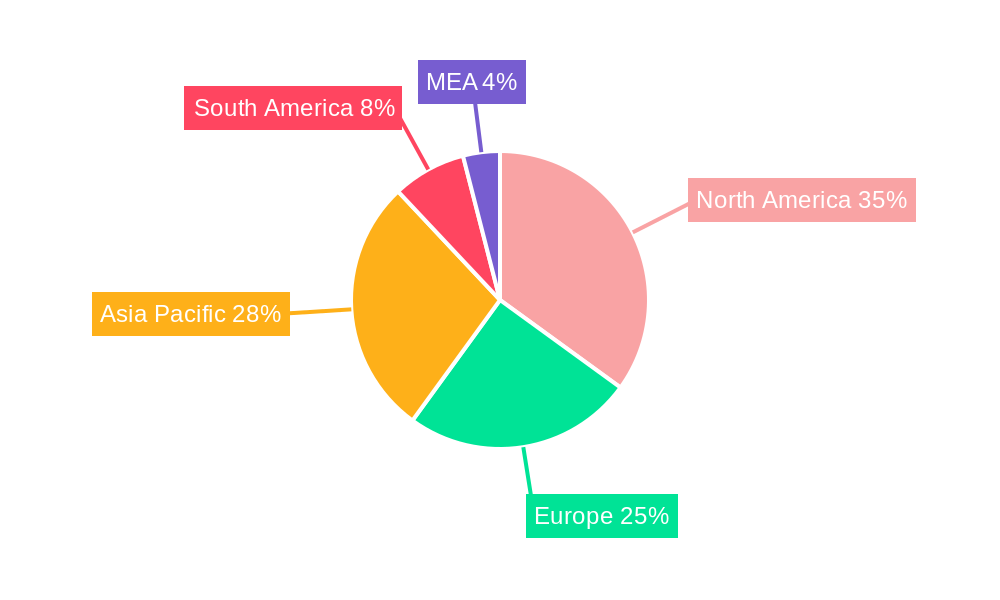
North America, specifically the United States, currently dominates the Oil and Gas Water Management Services market, driven by robust oil and gas production activities and stringent environmental regulations. The Upstream sector accounts for the largest market share, driven by the high volume of produced water generated during oil and gas extraction. Within services, Water Disposal Services holds the largest share, due to the significant volumes of water requiring disposal.
- North America Dominance: Driven by high oil and gas production and stringent environmental regulations.
- Upstream Sector Leadership: High volumes of produced water generated during extraction.
- Water Disposal Services: Largest service segment due to high disposal needs.
- Key Drivers: Favorable economic policies supporting oil and gas exploration, well-established infrastructure, and high technological advancement.
Oil and Gas Water Management Services Market Product Landscape
The Oil and Gas Water Management Services market offers a diverse range of products and services, including various water treatment technologies (membrane filtration, thermal treatment, etc.), water hauling and disposal services, and integrated water management solutions. Recent innovations focus on improving efficiency, reducing environmental impact, and enhancing cost-effectiveness. Key performance metrics include water treatment efficiency, reduced discharge volumes, and cost savings. Unique selling propositions often center on environmentally friendly solutions and innovative technologies that enhance operational efficiency and reduce environmental footprint.
Key Drivers, Barriers & Challenges in Oil and Gas Water Management Services Market
Key Drivers:
- Increasing oil and gas production globally.
- Stringent environmental regulations.
- Growing demand for sustainable water management practices.
- Technological advancements in water treatment technologies.
Challenges & Restraints:
- High initial investment costs for advanced technologies.
- Fluctuations in oil and gas prices impacting investment decisions.
- Regulatory complexities and obtaining permits.
- Competition from established players and emerging technologies. The competitive pressure reduces profit margin by xx% on average.
Emerging Opportunities in Oil and Gas Water Management Services Market
- Untapped markets in developing economies with growing oil and gas activities.
- Increasing demand for water reuse and recycling solutions.
- Development of innovative technologies for zero liquid discharge.
- Focus on digitalization and data analytics to optimize water management.
Growth Accelerators in the Oil and Gas Water Management Services Market Industry
Technological breakthroughs in water treatment, such as the development of advanced membrane technologies and AI-powered optimization tools, are accelerating market growth. Strategic partnerships between service providers and oil and gas operators are fostering innovation and expanding market reach. Expansion into new geographic markets, particularly in developing regions with growing energy demand, presents significant growth potential.
Key Players Shaping the Oil and Gas Water Management Services Market Market
- Severn Treatment Services Ltd
- Baker Hughes a GE Company
- Aquatech International LLC
- Schlumberger Ltd
- Halliburton Co
- Nuverra Environmental Solutions
- Veolia Environnement SA
- Granite Construction Inc
- Ovivo Inc
Notable Milestones in Oil and Gas Water Management Services Market Sector
- 2020: Introduction of a new membrane filtration technology by Schlumberger.
- 2022: Acquisition of a smaller water management company by Baker Hughes.
- 2023: Launch of a zero liquid discharge system by a new entrant.
- 2024: Implementation of stricter water discharge regulations in several key regions.
In-Depth Oil and Gas Water Management Services Market Market Outlook
The Oil and Gas Water Management Services market is poised for sustained growth driven by persistent demand for efficient and environmentally responsible water management solutions. The increasing adoption of advanced technologies, coupled with strategic partnerships and market expansion efforts, will further propel market growth. Opportunities exist in developing economies, particularly in regions with burgeoning oil and gas exploration and production activities. Strategic investments in research and development and environmentally sustainable practices will be crucial for long-term success in this market.
Oil and Gas Water Management Services Market Segmentation
-
1. Sector
- 1.1. Upstream
- 1.2. Downstream
-
2. Services
- 2.1. Water Disposal Services
- 2.2. Water Hauling Services
- 2.3. Produced Water Treatment Services
- 2.4. Others
Oil and Gas Water Management Services Market Segmentation By Geography
- 1. North America
- 2. Europe
- 3. Asia Pacific
- 4. South America
- 5. Middle East and Africa
Oil and Gas Water Management Services Market REPORT HIGHLIGHTS
| Aspects | Details |
|---|---|
| Study Period | 2019-2033 |
| Base Year | 2024 |
| Estimated Year | 2025 |
| Forecast Period | 2025-2033 |
| Historical Period | 2019-2024 |
| Growth Rate | CAGR of > 8.30% from 2019-2033 |
| Segmentation |
|
Table of Contents
- 1. Introduction
- 1.1. Research Scope
- 1.2. Market Segmentation
- 1.3. Research Methodology
- 1.4. Definitions and Assumptions
- 2. Executive Summary
- 2.1. Introduction
- 3. Market Dynamics
- 3.1. Introduction
- 3.2. Market Drivers
- 3.2.1. 4.; Proven Shale Gas Reserves 4.; Technological Advancement in Horizontal Drilling and Hydraulic Fracturing
- 3.3. Market Restrains
- 3.3.1. 4.; High Exploration Cost
- 3.4. Market Trends
- 3.4.1. Upstream Sector to Dominate the Market
- 4. Market Factor Analysis
- 4.1. Porters Five Forces
- 4.2. Supply/Value Chain
- 4.3. PESTEL analysis
- 4.4. Market Entropy
- 4.5. Patent/Trademark Analysis
- 5. Global Oil and Gas Water Management Services Market Analysis, Insights and Forecast, 2019-2031
- 5.1. Market Analysis, Insights and Forecast - by Sector
- 5.1.1. Upstream
- 5.1.2. Downstream
- 5.2. Market Analysis, Insights and Forecast - by Services
- 5.2.1. Water Disposal Services
- 5.2.2. Water Hauling Services
- 5.2.3. Produced Water Treatment Services
- 5.2.4. Others
- 5.3. Market Analysis, Insights and Forecast - by Region
- 5.3.1. North America
- 5.3.2. Europe
- 5.3.3. Asia Pacific
- 5.3.4. South America
- 5.3.5. Middle East and Africa
- 5.1. Market Analysis, Insights and Forecast - by Sector
- 6. North America Oil and Gas Water Management Services Market Analysis, Insights and Forecast, 2019-2031
- 6.1. Market Analysis, Insights and Forecast - by Sector
- 6.1.1. Upstream
- 6.1.2. Downstream
- 6.2. Market Analysis, Insights and Forecast - by Services
- 6.2.1. Water Disposal Services
- 6.2.2. Water Hauling Services
- 6.2.3. Produced Water Treatment Services
- 6.2.4. Others
- 6.1. Market Analysis, Insights and Forecast - by Sector
- 7. Europe Oil and Gas Water Management Services Market Analysis, Insights and Forecast, 2019-2031
- 7.1. Market Analysis, Insights and Forecast - by Sector
- 7.1.1. Upstream
- 7.1.2. Downstream
- 7.2. Market Analysis, Insights and Forecast - by Services
- 7.2.1. Water Disposal Services
- 7.2.2. Water Hauling Services
- 7.2.3. Produced Water Treatment Services
- 7.2.4. Others
- 7.1. Market Analysis, Insights and Forecast - by Sector
- 8. Asia Pacific Oil and Gas Water Management Services Market Analysis, Insights and Forecast, 2019-2031
- 8.1. Market Analysis, Insights and Forecast - by Sector
- 8.1.1. Upstream
- 8.1.2. Downstream
- 8.2. Market Analysis, Insights and Forecast - by Services
- 8.2.1. Water Disposal Services
- 8.2.2. Water Hauling Services
- 8.2.3. Produced Water Treatment Services
- 8.2.4. Others
- 8.1. Market Analysis, Insights and Forecast - by Sector
- 9. South America Oil and Gas Water Management Services Market Analysis, Insights and Forecast, 2019-2031
- 9.1. Market Analysis, Insights and Forecast - by Sector
- 9.1.1. Upstream
- 9.1.2. Downstream
- 9.2. Market Analysis, Insights and Forecast - by Services
- 9.2.1. Water Disposal Services
- 9.2.2. Water Hauling Services
- 9.2.3. Produced Water Treatment Services
- 9.2.4. Others
- 9.1. Market Analysis, Insights and Forecast - by Sector
- 10. Middle East and Africa Oil and Gas Water Management Services Market Analysis, Insights and Forecast, 2019-2031
- 10.1. Market Analysis, Insights and Forecast - by Sector
- 10.1.1. Upstream
- 10.1.2. Downstream
- 10.2. Market Analysis, Insights and Forecast - by Services
- 10.2.1. Water Disposal Services
- 10.2.2. Water Hauling Services
- 10.2.3. Produced Water Treatment Services
- 10.2.4. Others
- 10.1. Market Analysis, Insights and Forecast - by Sector
- 11. North America Oil and Gas Water Management Services Market Analysis, Insights and Forecast, 2019-2031
- 11.1. Market Analysis, Insights and Forecast - By Country/Sub-region
- 11.1.1 United States
- 11.1.2 Canada
- 11.1.3 Mexico
- 12. Europe Oil and Gas Water Management Services Market Analysis, Insights and Forecast, 2019-2031
- 12.1. Market Analysis, Insights and Forecast - By Country/Sub-region
- 12.1.1 Germany
- 12.1.2 United Kingdom
- 12.1.3 France
- 12.1.4 Spain
- 12.1.5 Italy
- 12.1.6 Spain
- 12.1.7 Belgium
- 12.1.8 Netherland
- 12.1.9 Nordics
- 12.1.10 Rest of Europe
- 13. Asia Pacific Oil and Gas Water Management Services Market Analysis, Insights and Forecast, 2019-2031
- 13.1. Market Analysis, Insights and Forecast - By Country/Sub-region
- 13.1.1 China
- 13.1.2 Japan
- 13.1.3 India
- 13.1.4 South Korea
- 13.1.5 Southeast Asia
- 13.1.6 Australia
- 13.1.7 Indonesia
- 13.1.8 Phillipes
- 13.1.9 Singapore
- 13.1.10 Thailandc
- 13.1.11 Rest of Asia Pacific
- 14. South America Oil and Gas Water Management Services Market Analysis, Insights and Forecast, 2019-2031
- 14.1. Market Analysis, Insights and Forecast - By Country/Sub-region
- 14.1.1 Brazil
- 14.1.2 Argentina
- 14.1.3 Peru
- 14.1.4 Chile
- 14.1.5 Colombia
- 14.1.6 Ecuador
- 14.1.7 Venezuela
- 14.1.8 Rest of South America
- 15. North America Oil and Gas Water Management Services Market Analysis, Insights and Forecast, 2019-2031
- 15.1. Market Analysis, Insights and Forecast - By Country/Sub-region
- 15.1.1 United States
- 15.1.2 Canada
- 15.1.3 Mexico
- 16. MEA Oil and Gas Water Management Services Market Analysis, Insights and Forecast, 2019-2031
- 16.1. Market Analysis, Insights and Forecast - By Country/Sub-region
- 16.1.1 United Arab Emirates
- 16.1.2 Saudi Arabia
- 16.1.3 South Africa
- 16.1.4 Rest of Middle East and Africa
- 17. Competitive Analysis
- 17.1. Global Market Share Analysis 2024
- 17.2. Company Profiles
- 17.2.1 Severn Treatment Services Ltd
- 17.2.1.1. Overview
- 17.2.1.2. Products
- 17.2.1.3. SWOT Analysis
- 17.2.1.4. Recent Developments
- 17.2.1.5. Financials (Based on Availability)
- 17.2.2 Baker Hughes a GE Company
- 17.2.2.1. Overview
- 17.2.2.2. Products
- 17.2.2.3. SWOT Analysis
- 17.2.2.4. Recent Developments
- 17.2.2.5. Financials (Based on Availability)
- 17.2.3 Aquatech International LLC
- 17.2.3.1. Overview
- 17.2.3.2. Products
- 17.2.3.3. SWOT Analysis
- 17.2.3.4. Recent Developments
- 17.2.3.5. Financials (Based on Availability)
- 17.2.4 Schlumberger Ltd
- 17.2.4.1. Overview
- 17.2.4.2. Products
- 17.2.4.3. SWOT Analysis
- 17.2.4.4. Recent Developments
- 17.2.4.5. Financials (Based on Availability)
- 17.2.5 Halliburton Co
- 17.2.5.1. Overview
- 17.2.5.2. Products
- 17.2.5.3. SWOT Analysis
- 17.2.5.4. Recent Developments
- 17.2.5.5. Financials (Based on Availability)
- 17.2.6 Nuverra Environmental Solutions
- 17.2.6.1. Overview
- 17.2.6.2. Products
- 17.2.6.3. SWOT Analysis
- 17.2.6.4. Recent Developments
- 17.2.6.5. Financials (Based on Availability)
- 17.2.7 Veolia Environnement SA*List Not Exhaustive
- 17.2.7.1. Overview
- 17.2.7.2. Products
- 17.2.7.3. SWOT Analysis
- 17.2.7.4. Recent Developments
- 17.2.7.5. Financials (Based on Availability)
- 17.2.8 Granite Construction Inc
- 17.2.8.1. Overview
- 17.2.8.2. Products
- 17.2.8.3. SWOT Analysis
- 17.2.8.4. Recent Developments
- 17.2.8.5. Financials (Based on Availability)
- 17.2.9 Ovivo Inc
- 17.2.9.1. Overview
- 17.2.9.2. Products
- 17.2.9.3. SWOT Analysis
- 17.2.9.4. Recent Developments
- 17.2.9.5. Financials (Based on Availability)
- 17.2.1 Severn Treatment Services Ltd
List of Figures
- Figure 1: Global Oil and Gas Water Management Services Market Revenue Breakdown (Million, %) by Region 2024 & 2032
- Figure 2: North America Oil and Gas Water Management Services Market Revenue (Million), by Country 2024 & 2032
- Figure 3: North America Oil and Gas Water Management Services Market Revenue Share (%), by Country 2024 & 2032
- Figure 4: Europe Oil and Gas Water Management Services Market Revenue (Million), by Country 2024 & 2032
- Figure 5: Europe Oil and Gas Water Management Services Market Revenue Share (%), by Country 2024 & 2032
- Figure 6: Asia Pacific Oil and Gas Water Management Services Market Revenue (Million), by Country 2024 & 2032
- Figure 7: Asia Pacific Oil and Gas Water Management Services Market Revenue Share (%), by Country 2024 & 2032
- Figure 8: South America Oil and Gas Water Management Services Market Revenue (Million), by Country 2024 & 2032
- Figure 9: South America Oil and Gas Water Management Services Market Revenue Share (%), by Country 2024 & 2032
- Figure 10: North America Oil and Gas Water Management Services Market Revenue (Million), by Country 2024 & 2032
- Figure 11: North America Oil and Gas Water Management Services Market Revenue Share (%), by Country 2024 & 2032
- Figure 12: MEA Oil and Gas Water Management Services Market Revenue (Million), by Country 2024 & 2032
- Figure 13: MEA Oil and Gas Water Management Services Market Revenue Share (%), by Country 2024 & 2032
- Figure 14: North America Oil and Gas Water Management Services Market Revenue (Million), by Sector 2024 & 2032
- Figure 15: North America Oil and Gas Water Management Services Market Revenue Share (%), by Sector 2024 & 2032
- Figure 16: North America Oil and Gas Water Management Services Market Revenue (Million), by Services 2024 & 2032
- Figure 17: North America Oil and Gas Water Management Services Market Revenue Share (%), by Services 2024 & 2032
- Figure 18: North America Oil and Gas Water Management Services Market Revenue (Million), by Country 2024 & 2032
- Figure 19: North America Oil and Gas Water Management Services Market Revenue Share (%), by Country 2024 & 2032
- Figure 20: Europe Oil and Gas Water Management Services Market Revenue (Million), by Sector 2024 & 2032
- Figure 21: Europe Oil and Gas Water Management Services Market Revenue Share (%), by Sector 2024 & 2032
- Figure 22: Europe Oil and Gas Water Management Services Market Revenue (Million), by Services 2024 & 2032
- Figure 23: Europe Oil and Gas Water Management Services Market Revenue Share (%), by Services 2024 & 2032
- Figure 24: Europe Oil and Gas Water Management Services Market Revenue (Million), by Country 2024 & 2032
- Figure 25: Europe Oil and Gas Water Management Services Market Revenue Share (%), by Country 2024 & 2032
- Figure 26: Asia Pacific Oil and Gas Water Management Services Market Revenue (Million), by Sector 2024 & 2032
- Figure 27: Asia Pacific Oil and Gas Water Management Services Market Revenue Share (%), by Sector 2024 & 2032
- Figure 28: Asia Pacific Oil and Gas Water Management Services Market Revenue (Million), by Services 2024 & 2032
- Figure 29: Asia Pacific Oil and Gas Water Management Services Market Revenue Share (%), by Services 2024 & 2032
- Figure 30: Asia Pacific Oil and Gas Water Management Services Market Revenue (Million), by Country 2024 & 2032
- Figure 31: Asia Pacific Oil and Gas Water Management Services Market Revenue Share (%), by Country 2024 & 2032
- Figure 32: South America Oil and Gas Water Management Services Market Revenue (Million), by Sector 2024 & 2032
- Figure 33: South America Oil and Gas Water Management Services Market Revenue Share (%), by Sector 2024 & 2032
- Figure 34: South America Oil and Gas Water Management Services Market Revenue (Million), by Services 2024 & 2032
- Figure 35: South America Oil and Gas Water Management Services Market Revenue Share (%), by Services 2024 & 2032
- Figure 36: South America Oil and Gas Water Management Services Market Revenue (Million), by Country 2024 & 2032
- Figure 37: South America Oil and Gas Water Management Services Market Revenue Share (%), by Country 2024 & 2032
- Figure 38: Middle East and Africa Oil and Gas Water Management Services Market Revenue (Million), by Sector 2024 & 2032
- Figure 39: Middle East and Africa Oil and Gas Water Management Services Market Revenue Share (%), by Sector 2024 & 2032
- Figure 40: Middle East and Africa Oil and Gas Water Management Services Market Revenue (Million), by Services 2024 & 2032
- Figure 41: Middle East and Africa Oil and Gas Water Management Services Market Revenue Share (%), by Services 2024 & 2032
- Figure 42: Middle East and Africa Oil and Gas Water Management Services Market Revenue (Million), by Country 2024 & 2032
- Figure 43: Middle East and Africa Oil and Gas Water Management Services Market Revenue Share (%), by Country 2024 & 2032
List of Tables
- Table 1: Global Oil and Gas Water Management Services Market Revenue Million Forecast, by Region 2019 & 2032
- Table 2: Global Oil and Gas Water Management Services Market Revenue Million Forecast, by Sector 2019 & 2032
- Table 3: Global Oil and Gas Water Management Services Market Revenue Million Forecast, by Services 2019 & 2032
- Table 4: Global Oil and Gas Water Management Services Market Revenue Million Forecast, by Region 2019 & 2032
- Table 5: Global Oil and Gas Water Management Services Market Revenue Million Forecast, by Country 2019 & 2032
- Table 6: United States Oil and Gas Water Management Services Market Revenue (Million) Forecast, by Application 2019 & 2032
- Table 7: Canada Oil and Gas Water Management Services Market Revenue (Million) Forecast, by Application 2019 & 2032
- Table 8: Mexico Oil and Gas Water Management Services Market Revenue (Million) Forecast, by Application 2019 & 2032
- Table 9: Global Oil and Gas Water Management Services Market Revenue Million Forecast, by Country 2019 & 2032
- Table 10: Germany Oil and Gas Water Management Services Market Revenue (Million) Forecast, by Application 2019 & 2032
- Table 11: United Kingdom Oil and Gas Water Management Services Market Revenue (Million) Forecast, by Application 2019 & 2032
- Table 12: France Oil and Gas Water Management Services Market Revenue (Million) Forecast, by Application 2019 & 2032
- Table 13: Spain Oil and Gas Water Management Services Market Revenue (Million) Forecast, by Application 2019 & 2032
- Table 14: Italy Oil and Gas Water Management Services Market Revenue (Million) Forecast, by Application 2019 & 2032
- Table 15: Spain Oil and Gas Water Management Services Market Revenue (Million) Forecast, by Application 2019 & 2032
- Table 16: Belgium Oil and Gas Water Management Services Market Revenue (Million) Forecast, by Application 2019 & 2032
- Table 17: Netherland Oil and Gas Water Management Services Market Revenue (Million) Forecast, by Application 2019 & 2032
- Table 18: Nordics Oil and Gas Water Management Services Market Revenue (Million) Forecast, by Application 2019 & 2032
- Table 19: Rest of Europe Oil and Gas Water Management Services Market Revenue (Million) Forecast, by Application 2019 & 2032
- Table 20: Global Oil and Gas Water Management Services Market Revenue Million Forecast, by Country 2019 & 2032
- Table 21: China Oil and Gas Water Management Services Market Revenue (Million) Forecast, by Application 2019 & 2032
- Table 22: Japan Oil and Gas Water Management Services Market Revenue (Million) Forecast, by Application 2019 & 2032
- Table 23: India Oil and Gas Water Management Services Market Revenue (Million) Forecast, by Application 2019 & 2032
- Table 24: South Korea Oil and Gas Water Management Services Market Revenue (Million) Forecast, by Application 2019 & 2032
- Table 25: Southeast Asia Oil and Gas Water Management Services Market Revenue (Million) Forecast, by Application 2019 & 2032
- Table 26: Australia Oil and Gas Water Management Services Market Revenue (Million) Forecast, by Application 2019 & 2032
- Table 27: Indonesia Oil and Gas Water Management Services Market Revenue (Million) Forecast, by Application 2019 & 2032
- Table 28: Phillipes Oil and Gas Water Management Services Market Revenue (Million) Forecast, by Application 2019 & 2032
- Table 29: Singapore Oil and Gas Water Management Services Market Revenue (Million) Forecast, by Application 2019 & 2032
- Table 30: Thailandc Oil and Gas Water Management Services Market Revenue (Million) Forecast, by Application 2019 & 2032
- Table 31: Rest of Asia Pacific Oil and Gas Water Management Services Market Revenue (Million) Forecast, by Application 2019 & 2032
- Table 32: Global Oil and Gas Water Management Services Market Revenue Million Forecast, by Country 2019 & 2032
- Table 33: Brazil Oil and Gas Water Management Services Market Revenue (Million) Forecast, by Application 2019 & 2032
- Table 34: Argentina Oil and Gas Water Management Services Market Revenue (Million) Forecast, by Application 2019 & 2032
- Table 35: Peru Oil and Gas Water Management Services Market Revenue (Million) Forecast, by Application 2019 & 2032
- Table 36: Chile Oil and Gas Water Management Services Market Revenue (Million) Forecast, by Application 2019 & 2032
- Table 37: Colombia Oil and Gas Water Management Services Market Revenue (Million) Forecast, by Application 2019 & 2032
- Table 38: Ecuador Oil and Gas Water Management Services Market Revenue (Million) Forecast, by Application 2019 & 2032
- Table 39: Venezuela Oil and Gas Water Management Services Market Revenue (Million) Forecast, by Application 2019 & 2032
- Table 40: Rest of South America Oil and Gas Water Management Services Market Revenue (Million) Forecast, by Application 2019 & 2032
- Table 41: Global Oil and Gas Water Management Services Market Revenue Million Forecast, by Country 2019 & 2032
- Table 42: United States Oil and Gas Water Management Services Market Revenue (Million) Forecast, by Application 2019 & 2032
- Table 43: Canada Oil and Gas Water Management Services Market Revenue (Million) Forecast, by Application 2019 & 2032
- Table 44: Mexico Oil and Gas Water Management Services Market Revenue (Million) Forecast, by Application 2019 & 2032
- Table 45: Global Oil and Gas Water Management Services Market Revenue Million Forecast, by Country 2019 & 2032
- Table 46: United Arab Emirates Oil and Gas Water Management Services Market Revenue (Million) Forecast, by Application 2019 & 2032
- Table 47: Saudi Arabia Oil and Gas Water Management Services Market Revenue (Million) Forecast, by Application 2019 & 2032
- Table 48: South Africa Oil and Gas Water Management Services Market Revenue (Million) Forecast, by Application 2019 & 2032
- Table 49: Rest of Middle East and Africa Oil and Gas Water Management Services Market Revenue (Million) Forecast, by Application 2019 & 2032
- Table 50: Global Oil and Gas Water Management Services Market Revenue Million Forecast, by Sector 2019 & 2032
- Table 51: Global Oil and Gas Water Management Services Market Revenue Million Forecast, by Services 2019 & 2032
- Table 52: Global Oil and Gas Water Management Services Market Revenue Million Forecast, by Country 2019 & 2032
- Table 53: Global Oil and Gas Water Management Services Market Revenue Million Forecast, by Sector 2019 & 2032
- Table 54: Global Oil and Gas Water Management Services Market Revenue Million Forecast, by Services 2019 & 2032
- Table 55: Global Oil and Gas Water Management Services Market Revenue Million Forecast, by Country 2019 & 2032
- Table 56: Global Oil and Gas Water Management Services Market Revenue Million Forecast, by Sector 2019 & 2032
- Table 57: Global Oil and Gas Water Management Services Market Revenue Million Forecast, by Services 2019 & 2032
- Table 58: Global Oil and Gas Water Management Services Market Revenue Million Forecast, by Country 2019 & 2032
- Table 59: Global Oil and Gas Water Management Services Market Revenue Million Forecast, by Sector 2019 & 2032
- Table 60: Global Oil and Gas Water Management Services Market Revenue Million Forecast, by Services 2019 & 2032
- Table 61: Global Oil and Gas Water Management Services Market Revenue Million Forecast, by Country 2019 & 2032
- Table 62: Global Oil and Gas Water Management Services Market Revenue Million Forecast, by Sector 2019 & 2032
- Table 63: Global Oil and Gas Water Management Services Market Revenue Million Forecast, by Services 2019 & 2032
- Table 64: Global Oil and Gas Water Management Services Market Revenue Million Forecast, by Country 2019 & 2032
Frequently Asked Questions
1. What is the projected Compound Annual Growth Rate (CAGR) of the Oil and Gas Water Management Services Market?
The projected CAGR is approximately > 8.30%.
2. Which companies are prominent players in the Oil and Gas Water Management Services Market?
Key companies in the market include Severn Treatment Services Ltd, Baker Hughes a GE Company, Aquatech International LLC, Schlumberger Ltd, Halliburton Co, Nuverra Environmental Solutions, Veolia Environnement SA*List Not Exhaustive, Granite Construction Inc, Ovivo Inc.
3. What are the main segments of the Oil and Gas Water Management Services Market?
The market segments include Sector, Services.
4. Can you provide details about the market size?
The market size is estimated to be USD XX Million as of 2022.
5. What are some drivers contributing to market growth?
4.; Proven Shale Gas Reserves 4.; Technological Advancement in Horizontal Drilling and Hydraulic Fracturing.
6. What are the notable trends driving market growth?
Upstream Sector to Dominate the Market.
7. Are there any restraints impacting market growth?
4.; High Exploration Cost.
8. Can you provide examples of recent developments in the market?
N/A
9. What pricing options are available for accessing the report?
Pricing options include single-user, multi-user, and enterprise licenses priced at USD 4750, USD 5250, and USD 8750 respectively.
10. Is the market size provided in terms of value or volume?
The market size is provided in terms of value, measured in Million.
11. Are there any specific market keywords associated with the report?
Yes, the market keyword associated with the report is "Oil and Gas Water Management Services Market," which aids in identifying and referencing the specific market segment covered.
12. How do I determine which pricing option suits my needs best?
The pricing options vary based on user requirements and access needs. Individual users may opt for single-user licenses, while businesses requiring broader access may choose multi-user or enterprise licenses for cost-effective access to the report.
13. Are there any additional resources or data provided in the Oil and Gas Water Management Services Market report?
While the report offers comprehensive insights, it's advisable to review the specific contents or supplementary materials provided to ascertain if additional resources or data are available.
14. How can I stay updated on further developments or reports in the Oil and Gas Water Management Services Market?
To stay informed about further developments, trends, and reports in the Oil and Gas Water Management Services Market, consider subscribing to industry newsletters, following relevant companies and organizations, or regularly checking reputable industry news sources and publications.
Methodology
Step 1 - Identification of Relevant Samples Size from Population Database


Step 2 - Approaches for Defining Global Market Size (Value, Volume* & Price*)

Note*: In applicable scenarios
Step 3 - Data Sources
Primary Research
- Web Analytics
- Survey Reports
- Research Institute
- Latest Research Reports
- Opinion Leaders
Secondary Research
- Annual Reports
- White Paper
- Latest Press Release
- Industry Association
- Paid Database
- Investor Presentations

Step 4 - Data Triangulation
Involves using different sources of information in order to increase the validity of a study
These sources are likely to be stakeholders in a program - participants, other researchers, program staff, other community members, and so on.
Then we put all data in single framework & apply various statistical tools to find out the dynamic on the market.
During the analysis stage, feedback from the stakeholder groups would be compared to determine areas of agreement as well as areas of divergence


