
Key Insights
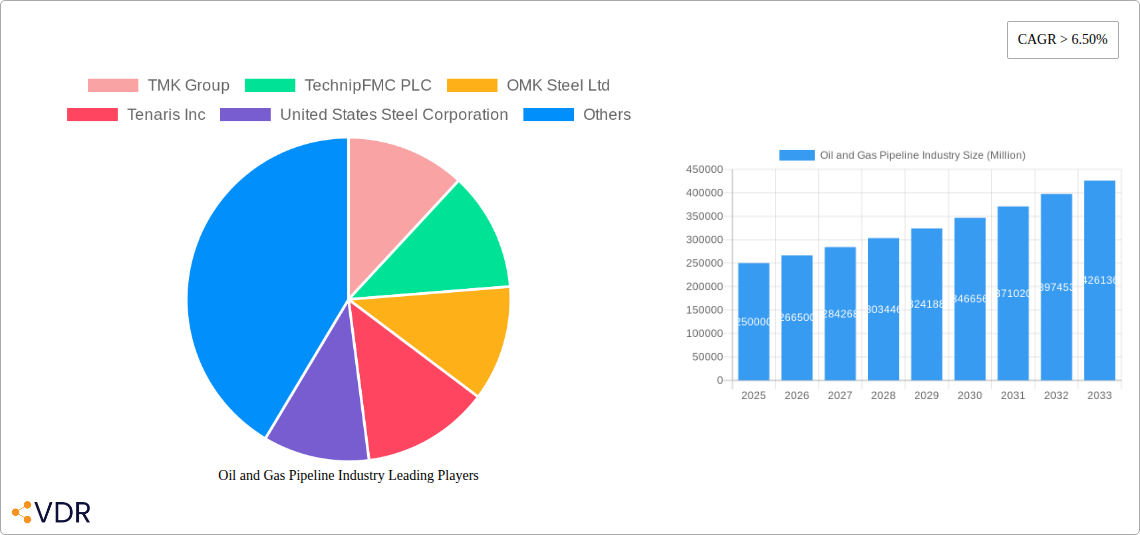
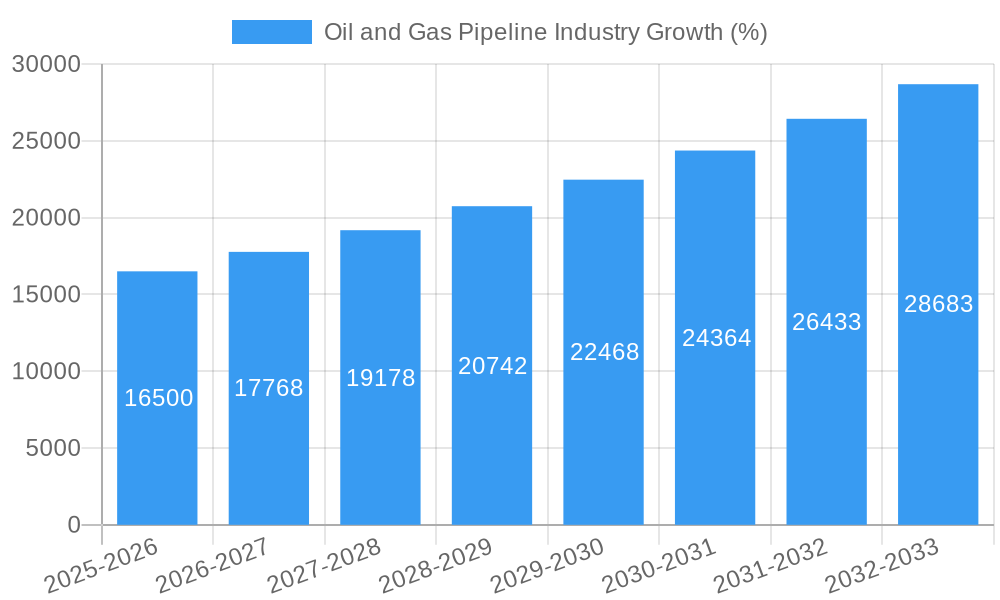
The global oil and gas pipeline industry is experiencing robust growth, projected to maintain a Compound Annual Growth Rate (CAGR) exceeding 6.5% from 2025 to 2033. This expansion is fueled by several key drivers. Increasing global energy demand, particularly in developing economies, necessitates the construction of new pipeline infrastructure to efficiently transport oil and natural gas resources. Furthermore, the ongoing transition towards cleaner energy sources is indirectly driving growth, as pipelines remain crucial for transporting natural gas, a transition fuel, and for the transportation of carbon capture and storage (CCS) projects. Government initiatives promoting energy security and infrastructure development in various regions also contribute significantly. Technological advancements in pipeline materials, construction techniques, and leak detection systems are enhancing efficiency and safety, further stimulating market growth. The industry is segmented by location (onshore and offshore) and pipeline type (crude oil and natural gas). Onshore pipelines currently dominate the market due to lower installation costs and easier accessibility, although offshore projects are showing considerable potential for future expansion as deepwater exploration increases.
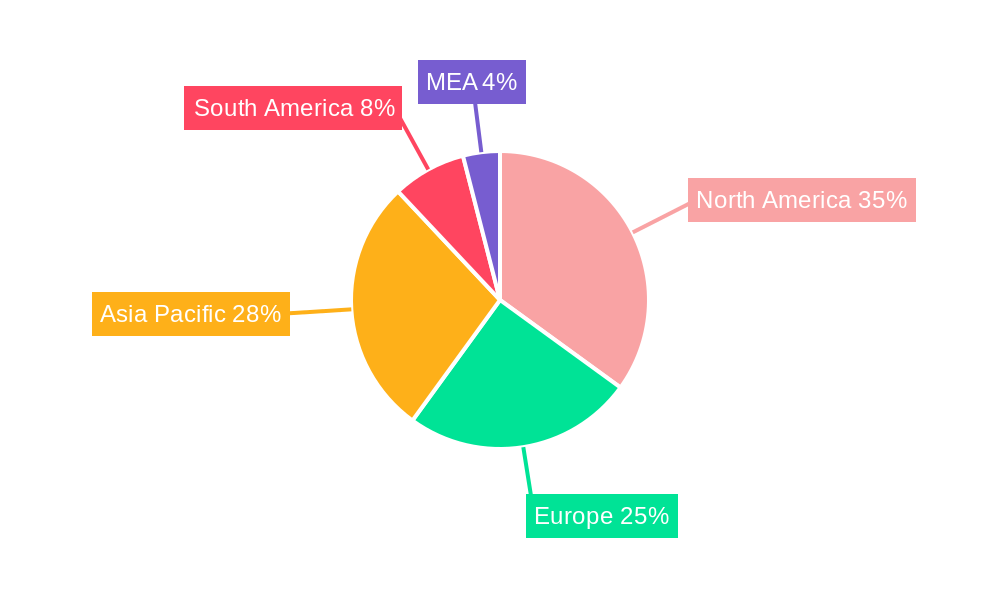
While the industry's growth trajectory remains positive, certain restraints need consideration. Fluctuations in oil and gas prices introduce market volatility, impacting investment decisions. Stringent environmental regulations and concerns regarding pipeline safety pose challenges. Geopolitical instability in certain regions can disrupt project timelines and increase construction risks. Moreover, the competitive landscape is characterized by established players like TMK Group, TechnipFMC PLC, and Tenaris Inc., alongside regional players, creating a dynamic market environment. Despite these challenges, the long-term outlook for the oil and gas pipeline industry remains optimistic, driven by persistent energy demand and the continued importance of pipelines in the global energy infrastructure. The regional distribution shows significant presence across North America, Europe and Asia-Pacific, with growth potential also existing within South America and the Middle East and Africa.
Oil and Gas Pipeline Industry Market Report: 2019-2033
This comprehensive report provides an in-depth analysis of the global Oil and Gas Pipeline Industry, encompassing market dynamics, growth trends, regional performance, and key players. With a focus on both onshore and offshore deployments, and covering both crude oil and gas pipelines, this report offers invaluable insights for industry professionals, investors, and stakeholders. The study period spans from 2019 to 2033, with 2025 serving as the base and estimated year.
Study Period: 2019-2033 Base Year: 2025 Estimated Year: 2025 Forecast Period: 2025-2033 Historical Period: 2019-2024
Oil and Gas Pipeline Industry Market Dynamics & Structure
The oil and gas pipeline industry is characterized by moderate market concentration, with a few major players holding significant market share. Technological innovation, primarily driven by enhanced pipeline materials, leak detection systems, and automation, is a key driver. Stringent regulatory frameworks concerning safety and environmental protection shape industry practices. Competitive substitutes, such as trucking and rail transport, influence market dynamics. The end-user demographics consist primarily of energy companies and government entities. M&A activity remains a significant factor, with xx million in deal volume recorded in 2024.
- Market Concentration: Moderately concentrated, with top 5 players holding xx% market share in 2024.
- Technological Innovation: Focus on materials science (e.g., advanced alloys), leak detection (e.g., smart sensors), and pipeline integrity management (PIM) systems.
- Regulatory Framework: Strict safety standards and environmental regulations impacting investment decisions and operational costs.
- Competitive Substitutes: Trucking and rail transport offering alternative, albeit often less cost-effective, solutions.
- End-User Demographics: Primarily energy companies, government agencies, and industrial consumers.
- M&A Trends: Significant consolidation activity observed, with xx deals completed in 2024 valued at approximately xx million.
Oil and Gas Pipeline Industry Growth Trends & Insights
The global oil and gas pipeline market exhibits a robust growth trajectory, fueled by increasing energy demand and infrastructure development projects globally. The market size is expected to reach xx million by 2025, exhibiting a CAGR of xx% during the forecast period (2025-2033). Technological advancements, such as the adoption of smart pipelines and improved materials, enhance efficiency and safety, driving adoption rates. Shifting consumer behavior towards cleaner energy sources influences the demand for natural gas pipelines. The ongoing investment in infrastructure projects globally is anticipated to continue driving market growth. The increasing need for efficient and reliable energy transportation is the fundamental driver behind the substantial expansion of the global oil and gas pipeline market.
Dominant Regions, Countries, or Segments in Oil and Gas Pipeline Industry
North America and Asia-Pacific dominate the global oil and gas pipeline market due to their extensive existing infrastructure, robust energy consumption, and significant investments in new projects. Within these regions, the onshore segment holds a larger share, driven by comparatively lower installation costs compared to offshore projects. Crude oil pipelines constitute a larger market segment compared to gas pipelines, reflecting the global energy mix.
- Leading Region: North America, followed by Asia-Pacific.
- Key Drivers (North America): Existing infrastructure, strong regulatory support, shale gas development.
- Key Drivers (Asia-Pacific): Rapid economic growth, increasing energy demand, infrastructure development initiatives.
- Onshore vs. Offshore: Onshore segment dominates due to cost-effectiveness.
- Crude Oil vs. Gas Pipelines: Crude oil pipelines hold a larger market share.
- Growth Potential: Significant growth potential exists in emerging economies, particularly in Africa and South America.
Oil and Gas Pipeline Industry Product Landscape
The oil and gas pipeline industry's product landscape comprises pipes made of various materials (steel, polyethylene), coatings (anti-corrosion), and related equipment (valves, pumps, compressors). Technological advancements focus on enhancing pipeline strength, durability, and leak detection capabilities. Smart pipeline technologies, incorporating sensors and data analytics, enable real-time monitoring and proactive maintenance. These advanced features improve safety and reduce operational costs, representing key unique selling propositions.
Key Drivers, Barriers & Challenges in Oil and Gas Pipeline Industry
Key Drivers:
- Increasing global energy demand, particularly for natural gas.
- Expansion of oil and gas exploration and production activities.
- Government initiatives promoting energy infrastructure development.
- Technological advancements leading to improved efficiency and safety.
Key Challenges:
- High capital expenditures associated with pipeline construction and maintenance.
- Environmental concerns and regulatory hurdles related to pipeline construction and operation.
- Geopolitical risks and security concerns.
- Supply chain disruptions affecting material availability and costs (estimated impact: xx million in lost revenue in 2024).
Emerging Opportunities in Oil and Gas Pipeline Industry
- Expansion into new markets with untapped potential (e.g., Africa, South America).
- Development of advanced pipeline technologies, including carbon capture and storage pipelines.
- Growing demand for natural gas pipelines due to increased adoption of cleaner energy sources.
- Implementation of smart pipeline technologies for enhanced efficiency and safety.
Growth Accelerators in the Oil and Gas Pipeline Industry
The long-term growth of the oil and gas pipeline industry is projected to be driven by strategic partnerships between energy companies and infrastructure developers, coupled with technological breakthroughs in pipeline materials and monitoring technologies. Further expansion into emerging markets and the increasing adoption of natural gas globally will also play a crucial role.
Key Players Shaping the Oil and Gas Pipeline Industry Market
- TMK Group
- TechnipFMC PLC
- OMK Steel Ltd
- Tenaris Inc
- United States Steel Corporation
- Nippon Steel Corporation
- ChelPipe Group
- Shengli Oil & Gas Pipe Holdings Limited
- Mott Macdonald Group Ltd
Notable Milestones in Oil and Gas Pipeline Industry Sector
- June 2022: Kalpataru Power Transmission Limited (KPTL) awarded contract for Mumbai-Nagpur Pipeline Project (Section II, Part A) for GAIL (India) Ltd. This highlights the ongoing investment in gas pipeline infrastructure in India.
- December 2022: Argentina secured USD 689 million in financing from BNDES for a natural gas pipeline in the Vaca Muerta shale region. This demonstrates the commitment to developing natural gas resources in South America.
In-Depth Oil and Gas Pipeline Industry Market Outlook
The future of the oil and gas pipeline industry appears bright, driven by sustained energy demand, ongoing infrastructure development, and technological innovations. Strategic partnerships, coupled with a focus on enhancing pipeline safety and efficiency, will be crucial for long-term success. Significant growth opportunities exist in emerging economies and in expanding natural gas pipeline networks, supporting a positive market outlook for the coming decade.
Oil and Gas Pipeline Industry Segmentation
-
1. Location of Deployment
- 1.1. Onshore
- 1.2. Offshore
-
2. Type
- 2.1. Crude Oil Pipeline
- 2.2. Gas Pipeline
Oil and Gas Pipeline Industry Segmentation By Geography
- 1. North America
- 2. Europe
- 3. Asia Pacific
- 4. South America
- 5. Middle East and Africa
Oil and Gas Pipeline Industry REPORT HIGHLIGHTS
| Aspects | Details |
|---|---|
| Study Period | 2019-2033 |
| Base Year | 2024 |
| Estimated Year | 2025 |
| Forecast Period | 2025-2033 |
| Historical Period | 2019-2024 |
| Growth Rate | CAGR of > 6.50% from 2019-2033 |
| Segmentation |
|
Table of Contents
- 1. Introduction
- 1.1. Research Scope
- 1.2. Market Segmentation
- 1.3. Research Methodology
- 1.4. Definitions and Assumptions
- 2. Executive Summary
- 2.1. Introduction
- 3. Market Dynamics
- 3.1. Introduction
- 3.2. Market Drivers
- 3.2.1. 4.; Rising Demand for Increaing Refinening Capacity4.; Increasing Investment in Downstream Sector
- 3.3. Market Restrains
- 3.3.1. 4.; Fluctuating Price of Crude Oil May Impede the Development of the Downstream Sector
- 3.4. Market Trends
- 3.4.1. The Gas Pipeline Segment to Dominate the Market
- 4. Market Factor Analysis
- 4.1. Porters Five Forces
- 4.2. Supply/Value Chain
- 4.3. PESTEL analysis
- 4.4. Market Entropy
- 4.5. Patent/Trademark Analysis
- 5. Global Oil and Gas Pipeline Industry Analysis, Insights and Forecast, 2019-2031
- 5.1. Market Analysis, Insights and Forecast - by Location of Deployment
- 5.1.1. Onshore
- 5.1.2. Offshore
- 5.2. Market Analysis, Insights and Forecast - by Type
- 5.2.1. Crude Oil Pipeline
- 5.2.2. Gas Pipeline
- 5.3. Market Analysis, Insights and Forecast - by Region
- 5.3.1. North America
- 5.3.2. Europe
- 5.3.3. Asia Pacific
- 5.3.4. South America
- 5.3.5. Middle East and Africa
- 5.1. Market Analysis, Insights and Forecast - by Location of Deployment
- 6. North America Oil and Gas Pipeline Industry Analysis, Insights and Forecast, 2019-2031
- 6.1. Market Analysis, Insights and Forecast - by Location of Deployment
- 6.1.1. Onshore
- 6.1.2. Offshore
- 6.2. Market Analysis, Insights and Forecast - by Type
- 6.2.1. Crude Oil Pipeline
- 6.2.2. Gas Pipeline
- 6.1. Market Analysis, Insights and Forecast - by Location of Deployment
- 7. Europe Oil and Gas Pipeline Industry Analysis, Insights and Forecast, 2019-2031
- 7.1. Market Analysis, Insights and Forecast - by Location of Deployment
- 7.1.1. Onshore
- 7.1.2. Offshore
- 7.2. Market Analysis, Insights and Forecast - by Type
- 7.2.1. Crude Oil Pipeline
- 7.2.2. Gas Pipeline
- 7.1. Market Analysis, Insights and Forecast - by Location of Deployment
- 8. Asia Pacific Oil and Gas Pipeline Industry Analysis, Insights and Forecast, 2019-2031
- 8.1. Market Analysis, Insights and Forecast - by Location of Deployment
- 8.1.1. Onshore
- 8.1.2. Offshore
- 8.2. Market Analysis, Insights and Forecast - by Type
- 8.2.1. Crude Oil Pipeline
- 8.2.2. Gas Pipeline
- 8.1. Market Analysis, Insights and Forecast - by Location of Deployment
- 9. South America Oil and Gas Pipeline Industry Analysis, Insights and Forecast, 2019-2031
- 9.1. Market Analysis, Insights and Forecast - by Location of Deployment
- 9.1.1. Onshore
- 9.1.2. Offshore
- 9.2. Market Analysis, Insights and Forecast - by Type
- 9.2.1. Crude Oil Pipeline
- 9.2.2. Gas Pipeline
- 9.1. Market Analysis, Insights and Forecast - by Location of Deployment
- 10. Middle East and Africa Oil and Gas Pipeline Industry Analysis, Insights and Forecast, 2019-2031
- 10.1. Market Analysis, Insights and Forecast - by Location of Deployment
- 10.1.1. Onshore
- 10.1.2. Offshore
- 10.2. Market Analysis, Insights and Forecast - by Type
- 10.2.1. Crude Oil Pipeline
- 10.2.2. Gas Pipeline
- 10.1. Market Analysis, Insights and Forecast - by Location of Deployment
- 11. North America Oil and Gas Pipeline Industry Analysis, Insights and Forecast, 2019-2031
- 11.1. Market Analysis, Insights and Forecast - By Country/Sub-region
- 11.1.1 United States
- 11.1.2 Canada
- 11.1.3 Mexico
- 12. Europe Oil and Gas Pipeline Industry Analysis, Insights and Forecast, 2019-2031
- 12.1. Market Analysis, Insights and Forecast - By Country/Sub-region
- 12.1.1 Germany
- 12.1.2 United Kingdom
- 12.1.3 France
- 12.1.4 Spain
- 12.1.5 Italy
- 12.1.6 Spain
- 12.1.7 Belgium
- 12.1.8 Netherland
- 12.1.9 Nordics
- 12.1.10 Rest of Europe
- 13. Asia Pacific Oil and Gas Pipeline Industry Analysis, Insights and Forecast, 2019-2031
- 13.1. Market Analysis, Insights and Forecast - By Country/Sub-region
- 13.1.1 China
- 13.1.2 Japan
- 13.1.3 India
- 13.1.4 South Korea
- 13.1.5 Southeast Asia
- 13.1.6 Australia
- 13.1.7 Indonesia
- 13.1.8 Phillipes
- 13.1.9 Singapore
- 13.1.10 Thailandc
- 13.1.11 Rest of Asia Pacific
- 14. South America Oil and Gas Pipeline Industry Analysis, Insights and Forecast, 2019-2031
- 14.1. Market Analysis, Insights and Forecast - By Country/Sub-region
- 14.1.1 Brazil
- 14.1.2 Argentina
- 14.1.3 Peru
- 14.1.4 Chile
- 14.1.5 Colombia
- 14.1.6 Ecuador
- 14.1.7 Venezuela
- 14.1.8 Rest of South America
- 15. MEA Oil and Gas Pipeline Industry Analysis, Insights and Forecast, 2019-2031
- 15.1. Market Analysis, Insights and Forecast - By Country/Sub-region
- 15.1.1 United Arab Emirates
- 15.1.2 Saudi Arabia
- 15.1.3 South Africa
- 15.1.4 Rest of Middle East and Africa
- 16. Competitive Analysis
- 16.1. Global Market Share Analysis 2024
- 16.2. Company Profiles
- 16.2.1 TMK Group
- 16.2.1.1. Overview
- 16.2.1.2. Products
- 16.2.1.3. SWOT Analysis
- 16.2.1.4. Recent Developments
- 16.2.1.5. Financials (Based on Availability)
- 16.2.2 TechnipFMC PLC
- 16.2.2.1. Overview
- 16.2.2.2. Products
- 16.2.2.3. SWOT Analysis
- 16.2.2.4. Recent Developments
- 16.2.2.5. Financials (Based on Availability)
- 16.2.3 OMK Steel Ltd
- 16.2.3.1. Overview
- 16.2.3.2. Products
- 16.2.3.3. SWOT Analysis
- 16.2.3.4. Recent Developments
- 16.2.3.5. Financials (Based on Availability)
- 16.2.4 Tenaris Inc
- 16.2.4.1. Overview
- 16.2.4.2. Products
- 16.2.4.3. SWOT Analysis
- 16.2.4.4. Recent Developments
- 16.2.4.5. Financials (Based on Availability)
- 16.2.5 United States Steel Corporation
- 16.2.5.1. Overview
- 16.2.5.2. Products
- 16.2.5.3. SWOT Analysis
- 16.2.5.4. Recent Developments
- 16.2.5.5. Financials (Based on Availability)
- 16.2.6 Nippon Steel Corporation
- 16.2.6.1. Overview
- 16.2.6.2. Products
- 16.2.6.3. SWOT Analysis
- 16.2.6.4. Recent Developments
- 16.2.6.5. Financials (Based on Availability)
- 16.2.7 ChelPipe Group
- 16.2.7.1. Overview
- 16.2.7.2. Products
- 16.2.7.3. SWOT Analysis
- 16.2.7.4. Recent Developments
- 16.2.7.5. Financials (Based on Availability)
- 16.2.8 Shengli Oil & Gas Pipe Holdings Limited
- 16.2.8.1. Overview
- 16.2.8.2. Products
- 16.2.8.3. SWOT Analysis
- 16.2.8.4. Recent Developments
- 16.2.8.5. Financials (Based on Availability)
- 16.2.9 Mott Macdonald Group Ltd
- 16.2.9.1. Overview
- 16.2.9.2. Products
- 16.2.9.3. SWOT Analysis
- 16.2.9.4. Recent Developments
- 16.2.9.5. Financials (Based on Availability)
- 16.2.1 TMK Group
List of Figures
- Figure 1: Global Oil and Gas Pipeline Industry Revenue Breakdown (Million, %) by Region 2024 & 2032
- Figure 2: North America Oil and Gas Pipeline Industry Revenue (Million), by Country 2024 & 2032
- Figure 3: North America Oil and Gas Pipeline Industry Revenue Share (%), by Country 2024 & 2032
- Figure 4: Europe Oil and Gas Pipeline Industry Revenue (Million), by Country 2024 & 2032
- Figure 5: Europe Oil and Gas Pipeline Industry Revenue Share (%), by Country 2024 & 2032
- Figure 6: Asia Pacific Oil and Gas Pipeline Industry Revenue (Million), by Country 2024 & 2032
- Figure 7: Asia Pacific Oil and Gas Pipeline Industry Revenue Share (%), by Country 2024 & 2032
- Figure 8: South America Oil and Gas Pipeline Industry Revenue (Million), by Country 2024 & 2032
- Figure 9: South America Oil and Gas Pipeline Industry Revenue Share (%), by Country 2024 & 2032
- Figure 10: MEA Oil and Gas Pipeline Industry Revenue (Million), by Country 2024 & 2032
- Figure 11: MEA Oil and Gas Pipeline Industry Revenue Share (%), by Country 2024 & 2032
- Figure 12: North America Oil and Gas Pipeline Industry Revenue (Million), by Location of Deployment 2024 & 2032
- Figure 13: North America Oil and Gas Pipeline Industry Revenue Share (%), by Location of Deployment 2024 & 2032
- Figure 14: North America Oil and Gas Pipeline Industry Revenue (Million), by Type 2024 & 2032
- Figure 15: North America Oil and Gas Pipeline Industry Revenue Share (%), by Type 2024 & 2032
- Figure 16: North America Oil and Gas Pipeline Industry Revenue (Million), by Country 2024 & 2032
- Figure 17: North America Oil and Gas Pipeline Industry Revenue Share (%), by Country 2024 & 2032
- Figure 18: Europe Oil and Gas Pipeline Industry Revenue (Million), by Location of Deployment 2024 & 2032
- Figure 19: Europe Oil and Gas Pipeline Industry Revenue Share (%), by Location of Deployment 2024 & 2032
- Figure 20: Europe Oil and Gas Pipeline Industry Revenue (Million), by Type 2024 & 2032
- Figure 21: Europe Oil and Gas Pipeline Industry Revenue Share (%), by Type 2024 & 2032
- Figure 22: Europe Oil and Gas Pipeline Industry Revenue (Million), by Country 2024 & 2032
- Figure 23: Europe Oil and Gas Pipeline Industry Revenue Share (%), by Country 2024 & 2032
- Figure 24: Asia Pacific Oil and Gas Pipeline Industry Revenue (Million), by Location of Deployment 2024 & 2032
- Figure 25: Asia Pacific Oil and Gas Pipeline Industry Revenue Share (%), by Location of Deployment 2024 & 2032
- Figure 26: Asia Pacific Oil and Gas Pipeline Industry Revenue (Million), by Type 2024 & 2032
- Figure 27: Asia Pacific Oil and Gas Pipeline Industry Revenue Share (%), by Type 2024 & 2032
- Figure 28: Asia Pacific Oil and Gas Pipeline Industry Revenue (Million), by Country 2024 & 2032
- Figure 29: Asia Pacific Oil and Gas Pipeline Industry Revenue Share (%), by Country 2024 & 2032
- Figure 30: South America Oil and Gas Pipeline Industry Revenue (Million), by Location of Deployment 2024 & 2032
- Figure 31: South America Oil and Gas Pipeline Industry Revenue Share (%), by Location of Deployment 2024 & 2032
- Figure 32: South America Oil and Gas Pipeline Industry Revenue (Million), by Type 2024 & 2032
- Figure 33: South America Oil and Gas Pipeline Industry Revenue Share (%), by Type 2024 & 2032
- Figure 34: South America Oil and Gas Pipeline Industry Revenue (Million), by Country 2024 & 2032
- Figure 35: South America Oil and Gas Pipeline Industry Revenue Share (%), by Country 2024 & 2032
- Figure 36: Middle East and Africa Oil and Gas Pipeline Industry Revenue (Million), by Location of Deployment 2024 & 2032
- Figure 37: Middle East and Africa Oil and Gas Pipeline Industry Revenue Share (%), by Location of Deployment 2024 & 2032
- Figure 38: Middle East and Africa Oil and Gas Pipeline Industry Revenue (Million), by Type 2024 & 2032
- Figure 39: Middle East and Africa Oil and Gas Pipeline Industry Revenue Share (%), by Type 2024 & 2032
- Figure 40: Middle East and Africa Oil and Gas Pipeline Industry Revenue (Million), by Country 2024 & 2032
- Figure 41: Middle East and Africa Oil and Gas Pipeline Industry Revenue Share (%), by Country 2024 & 2032
List of Tables
- Table 1: Global Oil and Gas Pipeline Industry Revenue Million Forecast, by Region 2019 & 2032
- Table 2: Global Oil and Gas Pipeline Industry Revenue Million Forecast, by Location of Deployment 2019 & 2032
- Table 3: Global Oil and Gas Pipeline Industry Revenue Million Forecast, by Type 2019 & 2032
- Table 4: Global Oil and Gas Pipeline Industry Revenue Million Forecast, by Region 2019 & 2032
- Table 5: Global Oil and Gas Pipeline Industry Revenue Million Forecast, by Country 2019 & 2032
- Table 6: United States Oil and Gas Pipeline Industry Revenue (Million) Forecast, by Application 2019 & 2032
- Table 7: Canada Oil and Gas Pipeline Industry Revenue (Million) Forecast, by Application 2019 & 2032
- Table 8: Mexico Oil and Gas Pipeline Industry Revenue (Million) Forecast, by Application 2019 & 2032
- Table 9: Global Oil and Gas Pipeline Industry Revenue Million Forecast, by Country 2019 & 2032
- Table 10: Germany Oil and Gas Pipeline Industry Revenue (Million) Forecast, by Application 2019 & 2032
- Table 11: United Kingdom Oil and Gas Pipeline Industry Revenue (Million) Forecast, by Application 2019 & 2032
- Table 12: France Oil and Gas Pipeline Industry Revenue (Million) Forecast, by Application 2019 & 2032
- Table 13: Spain Oil and Gas Pipeline Industry Revenue (Million) Forecast, by Application 2019 & 2032
- Table 14: Italy Oil and Gas Pipeline Industry Revenue (Million) Forecast, by Application 2019 & 2032
- Table 15: Spain Oil and Gas Pipeline Industry Revenue (Million) Forecast, by Application 2019 & 2032
- Table 16: Belgium Oil and Gas Pipeline Industry Revenue (Million) Forecast, by Application 2019 & 2032
- Table 17: Netherland Oil and Gas Pipeline Industry Revenue (Million) Forecast, by Application 2019 & 2032
- Table 18: Nordics Oil and Gas Pipeline Industry Revenue (Million) Forecast, by Application 2019 & 2032
- Table 19: Rest of Europe Oil and Gas Pipeline Industry Revenue (Million) Forecast, by Application 2019 & 2032
- Table 20: Global Oil and Gas Pipeline Industry Revenue Million Forecast, by Country 2019 & 2032
- Table 21: China Oil and Gas Pipeline Industry Revenue (Million) Forecast, by Application 2019 & 2032
- Table 22: Japan Oil and Gas Pipeline Industry Revenue (Million) Forecast, by Application 2019 & 2032
- Table 23: India Oil and Gas Pipeline Industry Revenue (Million) Forecast, by Application 2019 & 2032
- Table 24: South Korea Oil and Gas Pipeline Industry Revenue (Million) Forecast, by Application 2019 & 2032
- Table 25: Southeast Asia Oil and Gas Pipeline Industry Revenue (Million) Forecast, by Application 2019 & 2032
- Table 26: Australia Oil and Gas Pipeline Industry Revenue (Million) Forecast, by Application 2019 & 2032
- Table 27: Indonesia Oil and Gas Pipeline Industry Revenue (Million) Forecast, by Application 2019 & 2032
- Table 28: Phillipes Oil and Gas Pipeline Industry Revenue (Million) Forecast, by Application 2019 & 2032
- Table 29: Singapore Oil and Gas Pipeline Industry Revenue (Million) Forecast, by Application 2019 & 2032
- Table 30: Thailandc Oil and Gas Pipeline Industry Revenue (Million) Forecast, by Application 2019 & 2032
- Table 31: Rest of Asia Pacific Oil and Gas Pipeline Industry Revenue (Million) Forecast, by Application 2019 & 2032
- Table 32: Global Oil and Gas Pipeline Industry Revenue Million Forecast, by Country 2019 & 2032
- Table 33: Brazil Oil and Gas Pipeline Industry Revenue (Million) Forecast, by Application 2019 & 2032
- Table 34: Argentina Oil and Gas Pipeline Industry Revenue (Million) Forecast, by Application 2019 & 2032
- Table 35: Peru Oil and Gas Pipeline Industry Revenue (Million) Forecast, by Application 2019 & 2032
- Table 36: Chile Oil and Gas Pipeline Industry Revenue (Million) Forecast, by Application 2019 & 2032
- Table 37: Colombia Oil and Gas Pipeline Industry Revenue (Million) Forecast, by Application 2019 & 2032
- Table 38: Ecuador Oil and Gas Pipeline Industry Revenue (Million) Forecast, by Application 2019 & 2032
- Table 39: Venezuela Oil and Gas Pipeline Industry Revenue (Million) Forecast, by Application 2019 & 2032
- Table 40: Rest of South America Oil and Gas Pipeline Industry Revenue (Million) Forecast, by Application 2019 & 2032
- Table 41: Global Oil and Gas Pipeline Industry Revenue Million Forecast, by Country 2019 & 2032
- Table 42: United Arab Emirates Oil and Gas Pipeline Industry Revenue (Million) Forecast, by Application 2019 & 2032
- Table 43: Saudi Arabia Oil and Gas Pipeline Industry Revenue (Million) Forecast, by Application 2019 & 2032
- Table 44: South Africa Oil and Gas Pipeline Industry Revenue (Million) Forecast, by Application 2019 & 2032
- Table 45: Rest of Middle East and Africa Oil and Gas Pipeline Industry Revenue (Million) Forecast, by Application 2019 & 2032
- Table 46: Global Oil and Gas Pipeline Industry Revenue Million Forecast, by Location of Deployment 2019 & 2032
- Table 47: Global Oil and Gas Pipeline Industry Revenue Million Forecast, by Type 2019 & 2032
- Table 48: Global Oil and Gas Pipeline Industry Revenue Million Forecast, by Country 2019 & 2032
- Table 49: Global Oil and Gas Pipeline Industry Revenue Million Forecast, by Location of Deployment 2019 & 2032
- Table 50: Global Oil and Gas Pipeline Industry Revenue Million Forecast, by Type 2019 & 2032
- Table 51: Global Oil and Gas Pipeline Industry Revenue Million Forecast, by Country 2019 & 2032
- Table 52: Global Oil and Gas Pipeline Industry Revenue Million Forecast, by Location of Deployment 2019 & 2032
- Table 53: Global Oil and Gas Pipeline Industry Revenue Million Forecast, by Type 2019 & 2032
- Table 54: Global Oil and Gas Pipeline Industry Revenue Million Forecast, by Country 2019 & 2032
- Table 55: Global Oil and Gas Pipeline Industry Revenue Million Forecast, by Location of Deployment 2019 & 2032
- Table 56: Global Oil and Gas Pipeline Industry Revenue Million Forecast, by Type 2019 & 2032
- Table 57: Global Oil and Gas Pipeline Industry Revenue Million Forecast, by Country 2019 & 2032
- Table 58: Global Oil and Gas Pipeline Industry Revenue Million Forecast, by Location of Deployment 2019 & 2032
- Table 59: Global Oil and Gas Pipeline Industry Revenue Million Forecast, by Type 2019 & 2032
- Table 60: Global Oil and Gas Pipeline Industry Revenue Million Forecast, by Country 2019 & 2032
Frequently Asked Questions
1. What is the projected Compound Annual Growth Rate (CAGR) of the Oil and Gas Pipeline Industry?
The projected CAGR is approximately > 6.50%.
2. Which companies are prominent players in the Oil and Gas Pipeline Industry?
Key companies in the market include TMK Group, TechnipFMC PLC, OMK Steel Ltd, Tenaris Inc, United States Steel Corporation, Nippon Steel Corporation, ChelPipe Group, Shengli Oil & Gas Pipe Holdings Limited, Mott Macdonald Group Ltd.
3. What are the main segments of the Oil and Gas Pipeline Industry?
The market segments include Location of Deployment, Type.
4. Can you provide details about the market size?
The market size is estimated to be USD XX Million as of 2022.
5. What are some drivers contributing to market growth?
4.; Rising Demand for Increaing Refinening Capacity4.; Increasing Investment in Downstream Sector.
6. What are the notable trends driving market growth?
The Gas Pipeline Segment to Dominate the Market.
7. Are there any restraints impacting market growth?
4.; Fluctuating Price of Crude Oil May Impede the Development of the Downstream Sector.
8. Can you provide examples of recent developments in the market?
June 2022: Kalpataru Power Transmission Limited (KPTL) was awarded the laying & construction of a steel gas pipeline and terminals along with associated facilities for Section II of the Mumbai - Nagpur Pipeline Project (Part A) for GAIL (India) Ltd.
9. What pricing options are available for accessing the report?
Pricing options include single-user, multi-user, and enterprise licenses priced at USD 4750, USD 5250, and USD 8750 respectively.
10. Is the market size provided in terms of value or volume?
The market size is provided in terms of value, measured in Million.
11. Are there any specific market keywords associated with the report?
Yes, the market keyword associated with the report is "Oil and Gas Pipeline Industry," which aids in identifying and referencing the specific market segment covered.
12. How do I determine which pricing option suits my needs best?
The pricing options vary based on user requirements and access needs. Individual users may opt for single-user licenses, while businesses requiring broader access may choose multi-user or enterprise licenses for cost-effective access to the report.
13. Are there any additional resources or data provided in the Oil and Gas Pipeline Industry report?
While the report offers comprehensive insights, it's advisable to review the specific contents or supplementary materials provided to ascertain if additional resources or data are available.
14. How can I stay updated on further developments or reports in the Oil and Gas Pipeline Industry?
To stay informed about further developments, trends, and reports in the Oil and Gas Pipeline Industry, consider subscribing to industry newsletters, following relevant companies and organizations, or regularly checking reputable industry news sources and publications.
Methodology
Step 1 - Identification of Relevant Samples Size from Population Database


Step 2 - Approaches for Defining Global Market Size (Value, Volume* & Price*)

Note*: In applicable scenarios
Step 3 - Data Sources
Primary Research
- Web Analytics
- Survey Reports
- Research Institute
- Latest Research Reports
- Opinion Leaders
Secondary Research
- Annual Reports
- White Paper
- Latest Press Release
- Industry Association
- Paid Database
- Investor Presentations

Step 4 - Data Triangulation
Involves using different sources of information in order to increase the validity of a study
These sources are likely to be stakeholders in a program - participants, other researchers, program staff, other community members, and so on.
Then we put all data in single framework & apply various statistical tools to find out the dynamic on the market.
During the analysis stage, feedback from the stakeholder groups would be compared to determine areas of agreement as well as areas of divergence


