
Key Insights
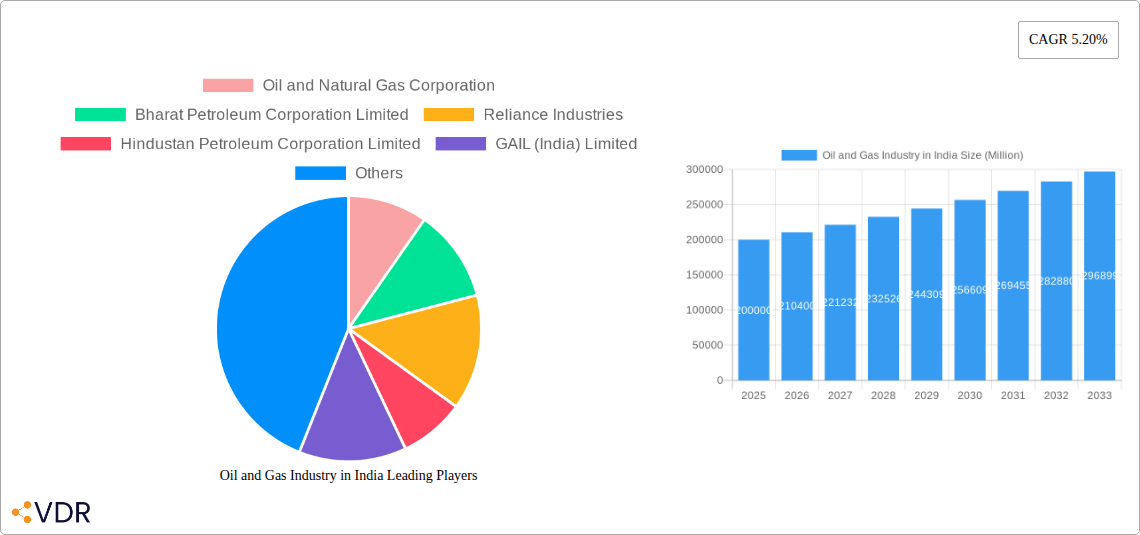
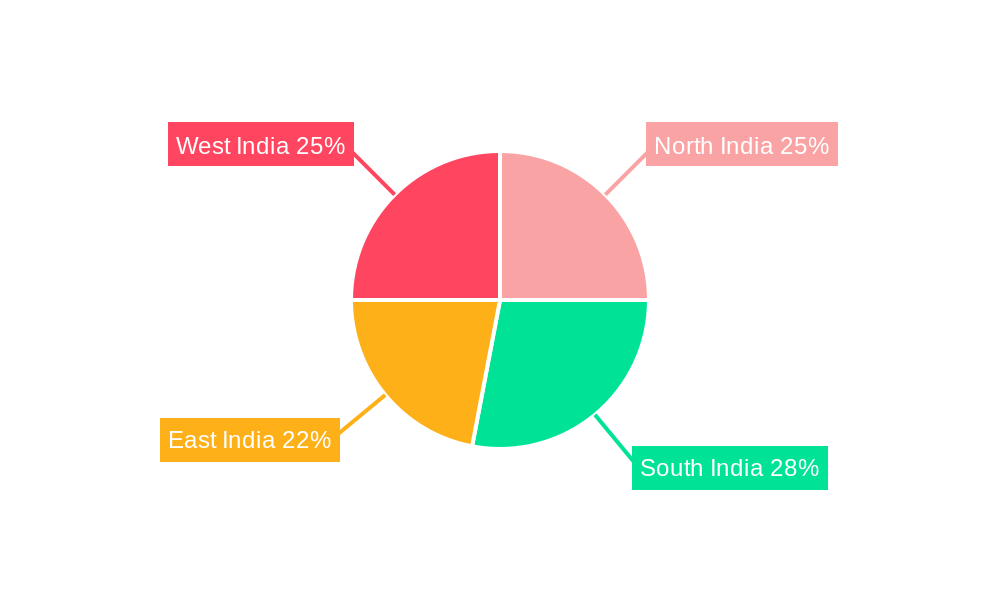
The Indian oil and gas industry, valued at approximately ₹20 trillion (USD 245 Billion) in 2025, is projected to experience robust growth, driven by rising energy demand fueled by a burgeoning population and rapid economic expansion. A compound annual growth rate (CAGR) of 5.20% is anticipated from 2025 to 2033, resulting in a market size exceeding ₹30 trillion (USD 367 Billion) by 2033. Key growth drivers include increasing investments in upstream exploration and production, particularly in offshore fields and unconventional resources like shale gas. Government initiatives promoting energy security and infrastructure development, coupled with the expanding petrochemical sector, further bolster market expansion. However, challenges remain, including price volatility in the global oil market, environmental concerns necessitating cleaner energy solutions, and regulatory hurdles. The industry is witnessing a significant shift toward sustainable practices, with companies investing in renewable energy sources and carbon capture technologies to meet evolving environmental regulations. Segment-wise, the offshore segment is poised for strong growth, driven by technological advancements in deep-sea exploration. Within the sector breakdown, the petrochemical and downstream segments are expected to show the highest growth due to increased demand for plastics and refined petroleum products. Major players like Oil and Natural Gas Corporation, Reliance Industries, and Indian Oil Corporation are leading the charge, investing heavily in capacity expansion and technological upgrades to maintain their market share. The regional distribution of growth is expected to be relatively balanced, although the growth in West and South India might be slightly higher due to industrial concentration and infrastructure development in those regions.
The competitive landscape is characterized by a mix of state-owned and private companies. State-owned enterprises dominate upstream activities, while private players are increasingly active in downstream sectors like refining and petrochemicals. Strategic partnerships and mergers & acquisitions are expected to reshape the industry dynamics in the coming years. Technological advancements like digitalization and automation are enhancing operational efficiency and reducing costs. The focus on energy efficiency and reduced emissions is shaping the industry's future, necessitating innovation and investment in sustainable technologies. This holistic approach to growth and sustainability will determine the future success of players within this dynamic market.
Oil and Gas Industry in India: A Comprehensive Market Report (2019-2033)
This in-depth report provides a comprehensive analysis of the Indian oil and gas industry, covering market dynamics, growth trends, key players, and future outlook. With a focus on both upstream and downstream segments, including petrochemicals, this report is essential for industry professionals, investors, and policymakers seeking to understand this dynamic market. The report utilizes data from the historical period (2019-2024), the base year (2025), and forecasts the market until 2033. The study covers onshore and offshore operations across various segments, providing a granular view of the Indian oil and gas landscape.
Oil and Gas Industry in India Market Dynamics & Structure
The Indian oil and gas industry is characterized by a complex interplay of factors influencing its structure and growth. Market concentration is relatively high, with a few dominant players like Indian Oil Corporation and Reliance Industries holding significant market share (estimated at xx% and xx% respectively in 2025). However, the presence of numerous smaller players, especially in the downstream sector, ensures a competitive landscape. Technological innovation, particularly in enhanced oil recovery techniques and cleaner energy sources, is a key driver, but faces barriers such as high upfront investment costs and regulatory complexities. The regulatory framework, while undergoing reforms to promote private sector participation and attract foreign investment, continues to present challenges. Competition from alternative energy sources and the increasing adoption of electric vehicles pose a long-term threat. M&A activity has been moderate in recent years, with a total deal volume estimated at xx million USD in 2024, primarily focusing on consolidation within the downstream and midstream segments.
- Market Concentration: High, with a few dominant players.
- Technological Innovation: Key driver, but faces investment and regulatory hurdles.
- Regulatory Framework: Undergoing reforms, but still presents challenges.
- Competitive Substitutes: Growing pressure from renewable energy sources.
- End-User Demographics: Increasing energy demand from a growing population and industrial sector.
- M&A Trends: Moderate activity, focused on consolidation.
Oil and Gas Industry in India Growth Trends & Insights
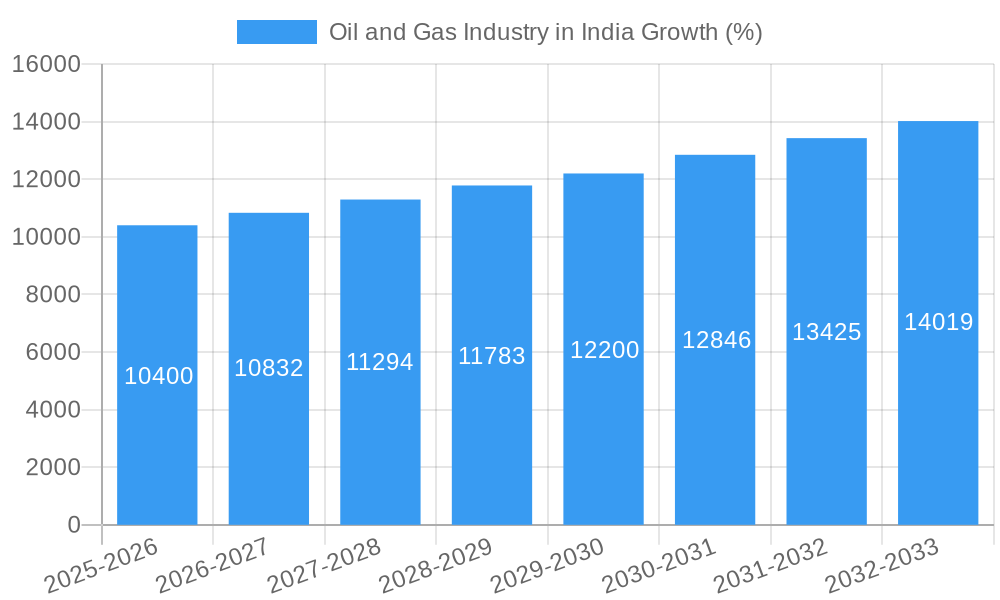
The Indian oil and gas market exhibits robust growth, driven by the nation's rapid economic expansion and rising energy consumption. The market size, valued at xx million USD in 2024, is projected to reach xx million USD by 2033, registering a CAGR of xx% during the forecast period (2025-2033). This growth is fueled by increasing urbanization, industrialization, and rising disposable incomes, leading to higher demand for petroleum products. Technological advancements, such as the exploration of unconventional resources and improved refining efficiency, further contribute to market expansion. However, fluctuating global crude oil prices and government policies influence market dynamics. Consumer behavior is shifting towards cleaner fuels, presenting both challenges and opportunities for the industry. The adoption rate of CNG and LPG continues to increase, driven by government incentives and environmental concerns.
Dominant Regions, Countries, or Segments in Oil and Gas Industry in India
The Upstream sector, particularly onshore operations in states like Assam, Gujarat, and Rajasthan, dominates the Indian oil and gas market due to substantial reserves and established infrastructure. The Downstream segment, characterized by a vast network of refineries and retail outlets, is also a major contributor to market growth, driven by the expanding demand for petroleum products across the country. Petrochemical plants, concentrated in western and eastern coastal regions, represent a significant segment with substantial growth potential.
- Upstream (Onshore): Assam, Gujarat, Rajasthan - Abundant reserves and established infrastructure drive growth.
- Downstream: Nationwide presence - Growing demand for petroleum products.
- Petrochemical Plants: Western & Eastern Coasts - Significant growth potential.
- Offshore: Significant untapped potential, requiring substantial investment.
- Midstream: Steady growth, driven by the need for efficient transportation and storage.
Oil and Gas Industry in India Product Landscape
The Indian oil and gas industry's product landscape is diversifying beyond traditional fuels. Innovations focus on improving efficiency, reducing emissions, and developing value-added products. These include cleaner fuels like CNG and LPG, specialized lubricants, and petrochemicals for various industrial applications. Technological advancements in refinery processes are leading to the production of higher-quality fuels and petrochemicals. The unique selling propositions of these products include environmental compliance and improved performance characteristics.
Key Drivers, Barriers & Challenges in Oil and Gas Industry in India
Key Drivers:
- Increasing energy demand from a growing population and industrial sector.
- Government initiatives promoting domestic exploration and production.
- Investments in infrastructure development, including pipelines and refineries.
Key Challenges:
- Fluctuating global crude oil prices impacting profitability.
- Stringent environmental regulations increasing compliance costs.
- Competition from renewable energy sources.
- xx million USD estimated losses in 2024 due to supply chain disruptions.
Emerging Opportunities in Oil and Gas Industry in India
- Growing demand for cleaner fuels (CNG, LPG).
- Expansion of the petrochemical sector.
- Investments in renewable energy sources and carbon capture technologies.
- Exploring and exploiting unconventional hydrocarbon resources.
Growth Accelerators in the Oil and Gas Industry in India Industry
The Indian oil and gas industry's long-term growth is driven by technological breakthroughs in exploration and production, strategic partnerships between domestic and international companies, and the expansion of infrastructure networks. Government policies promoting domestic energy security and attracting foreign investment play a critical role in accelerating growth.
Key Players Shaping the Oil and Gas Industry in India Market
- Oil and Natural Gas Corporation
- Bharat Petroleum Corporation Limited
- Reliance Industries
- Hindustan Petroleum Corporation Limited
- GAIL (India) Limited
- Indian Oil Corporation Limited
- Oil India Limited
- Cairn India
- Punj Lloyd Limited
Notable Milestones in Oil and Gas Industry in India Sector
- March 2023: Indian Oil Corporation Ltd. announced a USD 742 million investment in a petrochemical complex in Paradip, Odisha.
- January 2022: Adani Total Gas Ltd. won licenses to expand its CGD network to 14 new areas, investing USD 243 million.
In-Depth Oil and Gas Industry in India Market Outlook
The Indian oil and gas industry is poised for sustained growth over the next decade, driven by strong domestic demand, government support for infrastructure development, and ongoing technological advancements. Strategic partnerships and investments in cleaner energy sources will play a crucial role in shaping the industry's future. The market offers significant opportunities for both domestic and international players, particularly in the upstream, downstream, and petrochemical sectors. However, successful navigation of challenges related to price volatility, regulatory changes, and competition from renewable energy sources will be essential for long-term success.
Oil and Gas Industry in India Segmentation
-
1. Sector
-
1.1. Upstream
-
1.1.1. Location of Deployment
- 1.1.1.1. Onshore
- 1.1.1.2. Offshore
-
1.1.1. Location of Deployment
-
1.2. Downstream
- 1.2.1. Refineries
- 1.2.2. Petrochemical Plants
-
1.3. Midstream
- 1.3.1. Transportation
- 1.3.2. Storage
- 1.3.3. LNG Terminals
-
1.1. Upstream
Oil and Gas Industry in India Segmentation By Geography
-
1. North America
- 1.1. United States
- 1.2. Canada
- 1.3. Mexico
-
2. South America
- 2.1. Brazil
- 2.2. Argentina
- 2.3. Rest of South America
-
3. Europe
- 3.1. United Kingdom
- 3.2. Germany
- 3.3. France
- 3.4. Italy
- 3.5. Spain
- 3.6. Russia
- 3.7. Benelux
- 3.8. Nordics
- 3.9. Rest of Europe
-
4. Middle East & Africa
- 4.1. Turkey
- 4.2. Israel
- 4.3. GCC
- 4.4. North Africa
- 4.5. South Africa
- 4.6. Rest of Middle East & Africa
-
5. Asia Pacific
- 5.1. China
- 5.2. India
- 5.3. Japan
- 5.4. South Korea
- 5.5. ASEAN
- 5.6. Oceania
- 5.7. Rest of Asia Pacific
Oil and Gas Industry in India REPORT HIGHLIGHTS
| Aspects | Details |
|---|---|
| Study Period | 2019-2033 |
| Base Year | 2024 |
| Estimated Year | 2025 |
| Forecast Period | 2025-2033 |
| Historical Period | 2019-2024 |
| Growth Rate | CAGR of 5.20% from 2019-2033 |
| Segmentation |
|
Table of Contents
- 1. Introduction
- 1.1. Research Scope
- 1.2. Market Segmentation
- 1.3. Research Methodology
- 1.4. Definitions and Assumptions
- 2. Executive Summary
- 2.1. Introduction
- 3. Market Dynamics
- 3.1. Introduction
- 3.2. Market Drivers
- 3.2.1. 4.; Increasing Investment in the Upstream Sector4.; Supportive Government Policies
- 3.3. Market Restrains
- 3.3.1. 4.; Increasing Demand to Diversify the Power Generation Mix by Introducing Renewable Energy Sources
- 3.4. Market Trends
- 3.4.1. The Downstream Sector is Expected to Witness Significant Growth
- 4. Market Factor Analysis
- 4.1. Porters Five Forces
- 4.2. Supply/Value Chain
- 4.3. PESTEL analysis
- 4.4. Market Entropy
- 4.5. Patent/Trademark Analysis
- 5. Global Oil and Gas Industry in India Analysis, Insights and Forecast, 2019-2031
- 5.1. Market Analysis, Insights and Forecast - by Sector
- 5.1.1. Upstream
- 5.1.1.1. Location of Deployment
- 5.1.1.1.1. Onshore
- 5.1.1.1.2. Offshore
- 5.1.1.1. Location of Deployment
- 5.1.2. Downstream
- 5.1.2.1. Refineries
- 5.1.2.2. Petrochemical Plants
- 5.1.3. Midstream
- 5.1.3.1. Transportation
- 5.1.3.2. Storage
- 5.1.3.3. LNG Terminals
- 5.1.1. Upstream
- 5.2. Market Analysis, Insights and Forecast - by Region
- 5.2.1. North America
- 5.2.2. South America
- 5.2.3. Europe
- 5.2.4. Middle East & Africa
- 5.2.5. Asia Pacific
- 5.1. Market Analysis, Insights and Forecast - by Sector
- 6. North America Oil and Gas Industry in India Analysis, Insights and Forecast, 2019-2031
- 6.1. Market Analysis, Insights and Forecast - by Sector
- 6.1.1. Upstream
- 6.1.1.1. Location of Deployment
- 6.1.1.1.1. Onshore
- 6.1.1.1.2. Offshore
- 6.1.1.1. Location of Deployment
- 6.1.2. Downstream
- 6.1.2.1. Refineries
- 6.1.2.2. Petrochemical Plants
- 6.1.3. Midstream
- 6.1.3.1. Transportation
- 6.1.3.2. Storage
- 6.1.3.3. LNG Terminals
- 6.1.1. Upstream
- 6.1. Market Analysis, Insights and Forecast - by Sector
- 7. South America Oil and Gas Industry in India Analysis, Insights and Forecast, 2019-2031
- 7.1. Market Analysis, Insights and Forecast - by Sector
- 7.1.1. Upstream
- 7.1.1.1. Location of Deployment
- 7.1.1.1.1. Onshore
- 7.1.1.1.2. Offshore
- 7.1.1.1. Location of Deployment
- 7.1.2. Downstream
- 7.1.2.1. Refineries
- 7.1.2.2. Petrochemical Plants
- 7.1.3. Midstream
- 7.1.3.1. Transportation
- 7.1.3.2. Storage
- 7.1.3.3. LNG Terminals
- 7.1.1. Upstream
- 7.1. Market Analysis, Insights and Forecast - by Sector
- 8. Europe Oil and Gas Industry in India Analysis, Insights and Forecast, 2019-2031
- 8.1. Market Analysis, Insights and Forecast - by Sector
- 8.1.1. Upstream
- 8.1.1.1. Location of Deployment
- 8.1.1.1.1. Onshore
- 8.1.1.1.2. Offshore
- 8.1.1.1. Location of Deployment
- 8.1.2. Downstream
- 8.1.2.1. Refineries
- 8.1.2.2. Petrochemical Plants
- 8.1.3. Midstream
- 8.1.3.1. Transportation
- 8.1.3.2. Storage
- 8.1.3.3. LNG Terminals
- 8.1.1. Upstream
- 8.1. Market Analysis, Insights and Forecast - by Sector
- 9. Middle East & Africa Oil and Gas Industry in India Analysis, Insights and Forecast, 2019-2031
- 9.1. Market Analysis, Insights and Forecast - by Sector
- 9.1.1. Upstream
- 9.1.1.1. Location of Deployment
- 9.1.1.1.1. Onshore
- 9.1.1.1.2. Offshore
- 9.1.1.1. Location of Deployment
- 9.1.2. Downstream
- 9.1.2.1. Refineries
- 9.1.2.2. Petrochemical Plants
- 9.1.3. Midstream
- 9.1.3.1. Transportation
- 9.1.3.2. Storage
- 9.1.3.3. LNG Terminals
- 9.1.1. Upstream
- 9.1. Market Analysis, Insights and Forecast - by Sector
- 10. Asia Pacific Oil and Gas Industry in India Analysis, Insights and Forecast, 2019-2031
- 10.1. Market Analysis, Insights and Forecast - by Sector
- 10.1.1. Upstream
- 10.1.1.1. Location of Deployment
- 10.1.1.1.1. Onshore
- 10.1.1.1.2. Offshore
- 10.1.1.1. Location of Deployment
- 10.1.2. Downstream
- 10.1.2.1. Refineries
- 10.1.2.2. Petrochemical Plants
- 10.1.3. Midstream
- 10.1.3.1. Transportation
- 10.1.3.2. Storage
- 10.1.3.3. LNG Terminals
- 10.1.1. Upstream
- 10.1. Market Analysis, Insights and Forecast - by Sector
- 11. North India Oil and Gas Industry in India Analysis, Insights and Forecast, 2019-2031
- 12. South India Oil and Gas Industry in India Analysis, Insights and Forecast, 2019-2031
- 13. East India Oil and Gas Industry in India Analysis, Insights and Forecast, 2019-2031
- 14. West India Oil and Gas Industry in India Analysis, Insights and Forecast, 2019-2031
- 15. Competitive Analysis
- 15.1. Global Market Share Analysis 2024
- 15.2. Company Profiles
- 15.2.1 Oil and Natural Gas Corporation
- 15.2.1.1. Overview
- 15.2.1.2. Products
- 15.2.1.3. SWOT Analysis
- 15.2.1.4. Recent Developments
- 15.2.1.5. Financials (Based on Availability)
- 15.2.2 Bharat Petroleum Corporation Limited
- 15.2.2.1. Overview
- 15.2.2.2. Products
- 15.2.2.3. SWOT Analysis
- 15.2.2.4. Recent Developments
- 15.2.2.5. Financials (Based on Availability)
- 15.2.3 Reliance Industries
- 15.2.3.1. Overview
- 15.2.3.2. Products
- 15.2.3.3. SWOT Analysis
- 15.2.3.4. Recent Developments
- 15.2.3.5. Financials (Based on Availability)
- 15.2.4 Hindustan Petroleum Corporation Limited
- 15.2.4.1. Overview
- 15.2.4.2. Products
- 15.2.4.3. SWOT Analysis
- 15.2.4.4. Recent Developments
- 15.2.4.5. Financials (Based on Availability)
- 15.2.5 GAIL (India) Limited
- 15.2.5.1. Overview
- 15.2.5.2. Products
- 15.2.5.3. SWOT Analysis
- 15.2.5.4. Recent Developments
- 15.2.5.5. Financials (Based on Availability)
- 15.2.6 Indian Oil Corporation Limited
- 15.2.6.1. Overview
- 15.2.6.2. Products
- 15.2.6.3. SWOT Analysis
- 15.2.6.4. Recent Developments
- 15.2.6.5. Financials (Based on Availability)
- 15.2.7 Oil India Limited
- 15.2.7.1. Overview
- 15.2.7.2. Products
- 15.2.7.3. SWOT Analysis
- 15.2.7.4. Recent Developments
- 15.2.7.5. Financials (Based on Availability)
- 15.2.8 Cairn India
- 15.2.8.1. Overview
- 15.2.8.2. Products
- 15.2.8.3. SWOT Analysis
- 15.2.8.4. Recent Developments
- 15.2.8.5. Financials (Based on Availability)
- 15.2.9 Punj Lloyd Limited
- 15.2.9.1. Overview
- 15.2.9.2. Products
- 15.2.9.3. SWOT Analysis
- 15.2.9.4. Recent Developments
- 15.2.9.5. Financials (Based on Availability)
- 15.2.1 Oil and Natural Gas Corporation
List of Figures
- Figure 1: Global Oil and Gas Industry in India Revenue Breakdown (Million, %) by Region 2024 & 2032
- Figure 2: Global Oil and Gas Industry in India Volume Breakdown (Billion, %) by Region 2024 & 2032
- Figure 3: India Oil and Gas Industry in India Revenue (Million), by Country 2024 & 2032
- Figure 4: India Oil and Gas Industry in India Volume (Billion), by Country 2024 & 2032
- Figure 5: India Oil and Gas Industry in India Revenue Share (%), by Country 2024 & 2032
- Figure 6: India Oil and Gas Industry in India Volume Share (%), by Country 2024 & 2032
- Figure 7: North America Oil and Gas Industry in India Revenue (Million), by Sector 2024 & 2032
- Figure 8: North America Oil and Gas Industry in India Volume (Billion), by Sector 2024 & 2032
- Figure 9: North America Oil and Gas Industry in India Revenue Share (%), by Sector 2024 & 2032
- Figure 10: North America Oil and Gas Industry in India Volume Share (%), by Sector 2024 & 2032
- Figure 11: North America Oil and Gas Industry in India Revenue (Million), by Country 2024 & 2032
- Figure 12: North America Oil and Gas Industry in India Volume (Billion), by Country 2024 & 2032
- Figure 13: North America Oil and Gas Industry in India Revenue Share (%), by Country 2024 & 2032
- Figure 14: North America Oil and Gas Industry in India Volume Share (%), by Country 2024 & 2032
- Figure 15: South America Oil and Gas Industry in India Revenue (Million), by Sector 2024 & 2032
- Figure 16: South America Oil and Gas Industry in India Volume (Billion), by Sector 2024 & 2032
- Figure 17: South America Oil and Gas Industry in India Revenue Share (%), by Sector 2024 & 2032
- Figure 18: South America Oil and Gas Industry in India Volume Share (%), by Sector 2024 & 2032
- Figure 19: South America Oil and Gas Industry in India Revenue (Million), by Country 2024 & 2032
- Figure 20: South America Oil and Gas Industry in India Volume (Billion), by Country 2024 & 2032
- Figure 21: South America Oil and Gas Industry in India Revenue Share (%), by Country 2024 & 2032
- Figure 22: South America Oil and Gas Industry in India Volume Share (%), by Country 2024 & 2032
- Figure 23: Europe Oil and Gas Industry in India Revenue (Million), by Sector 2024 & 2032
- Figure 24: Europe Oil and Gas Industry in India Volume (Billion), by Sector 2024 & 2032
- Figure 25: Europe Oil and Gas Industry in India Revenue Share (%), by Sector 2024 & 2032
- Figure 26: Europe Oil and Gas Industry in India Volume Share (%), by Sector 2024 & 2032
- Figure 27: Europe Oil and Gas Industry in India Revenue (Million), by Country 2024 & 2032
- Figure 28: Europe Oil and Gas Industry in India Volume (Billion), by Country 2024 & 2032
- Figure 29: Europe Oil and Gas Industry in India Revenue Share (%), by Country 2024 & 2032
- Figure 30: Europe Oil and Gas Industry in India Volume Share (%), by Country 2024 & 2032
- Figure 31: Middle East & Africa Oil and Gas Industry in India Revenue (Million), by Sector 2024 & 2032
- Figure 32: Middle East & Africa Oil and Gas Industry in India Volume (Billion), by Sector 2024 & 2032
- Figure 33: Middle East & Africa Oil and Gas Industry in India Revenue Share (%), by Sector 2024 & 2032
- Figure 34: Middle East & Africa Oil and Gas Industry in India Volume Share (%), by Sector 2024 & 2032
- Figure 35: Middle East & Africa Oil and Gas Industry in India Revenue (Million), by Country 2024 & 2032
- Figure 36: Middle East & Africa Oil and Gas Industry in India Volume (Billion), by Country 2024 & 2032
- Figure 37: Middle East & Africa Oil and Gas Industry in India Revenue Share (%), by Country 2024 & 2032
- Figure 38: Middle East & Africa Oil and Gas Industry in India Volume Share (%), by Country 2024 & 2032
- Figure 39: Asia Pacific Oil and Gas Industry in India Revenue (Million), by Sector 2024 & 2032
- Figure 40: Asia Pacific Oil and Gas Industry in India Volume (Billion), by Sector 2024 & 2032
- Figure 41: Asia Pacific Oil and Gas Industry in India Revenue Share (%), by Sector 2024 & 2032
- Figure 42: Asia Pacific Oil and Gas Industry in India Volume Share (%), by Sector 2024 & 2032
- Figure 43: Asia Pacific Oil and Gas Industry in India Revenue (Million), by Country 2024 & 2032
- Figure 44: Asia Pacific Oil and Gas Industry in India Volume (Billion), by Country 2024 & 2032
- Figure 45: Asia Pacific Oil and Gas Industry in India Revenue Share (%), by Country 2024 & 2032
- Figure 46: Asia Pacific Oil and Gas Industry in India Volume Share (%), by Country 2024 & 2032
List of Tables
- Table 1: Global Oil and Gas Industry in India Revenue Million Forecast, by Region 2019 & 2032
- Table 2: Global Oil and Gas Industry in India Volume Billion Forecast, by Region 2019 & 2032
- Table 3: Global Oil and Gas Industry in India Revenue Million Forecast, by Sector 2019 & 2032
- Table 4: Global Oil and Gas Industry in India Volume Billion Forecast, by Sector 2019 & 2032
- Table 5: Global Oil and Gas Industry in India Revenue Million Forecast, by Region 2019 & 2032
- Table 6: Global Oil and Gas Industry in India Volume Billion Forecast, by Region 2019 & 2032
- Table 7: Global Oil and Gas Industry in India Revenue Million Forecast, by Country 2019 & 2032
- Table 8: Global Oil and Gas Industry in India Volume Billion Forecast, by Country 2019 & 2032
- Table 9: North India Oil and Gas Industry in India Revenue (Million) Forecast, by Application 2019 & 2032
- Table 10: North India Oil and Gas Industry in India Volume (Billion) Forecast, by Application 2019 & 2032
- Table 11: South India Oil and Gas Industry in India Revenue (Million) Forecast, by Application 2019 & 2032
- Table 12: South India Oil and Gas Industry in India Volume (Billion) Forecast, by Application 2019 & 2032
- Table 13: East India Oil and Gas Industry in India Revenue (Million) Forecast, by Application 2019 & 2032
- Table 14: East India Oil and Gas Industry in India Volume (Billion) Forecast, by Application 2019 & 2032
- Table 15: West India Oil and Gas Industry in India Revenue (Million) Forecast, by Application 2019 & 2032
- Table 16: West India Oil and Gas Industry in India Volume (Billion) Forecast, by Application 2019 & 2032
- Table 17: Global Oil and Gas Industry in India Revenue Million Forecast, by Sector 2019 & 2032
- Table 18: Global Oil and Gas Industry in India Volume Billion Forecast, by Sector 2019 & 2032
- Table 19: Global Oil and Gas Industry in India Revenue Million Forecast, by Country 2019 & 2032
- Table 20: Global Oil and Gas Industry in India Volume Billion Forecast, by Country 2019 & 2032
- Table 21: United States Oil and Gas Industry in India Revenue (Million) Forecast, by Application 2019 & 2032
- Table 22: United States Oil and Gas Industry in India Volume (Billion) Forecast, by Application 2019 & 2032
- Table 23: Canada Oil and Gas Industry in India Revenue (Million) Forecast, by Application 2019 & 2032
- Table 24: Canada Oil and Gas Industry in India Volume (Billion) Forecast, by Application 2019 & 2032
- Table 25: Mexico Oil and Gas Industry in India Revenue (Million) Forecast, by Application 2019 & 2032
- Table 26: Mexico Oil and Gas Industry in India Volume (Billion) Forecast, by Application 2019 & 2032
- Table 27: Global Oil and Gas Industry in India Revenue Million Forecast, by Sector 2019 & 2032
- Table 28: Global Oil and Gas Industry in India Volume Billion Forecast, by Sector 2019 & 2032
- Table 29: Global Oil and Gas Industry in India Revenue Million Forecast, by Country 2019 & 2032
- Table 30: Global Oil and Gas Industry in India Volume Billion Forecast, by Country 2019 & 2032
- Table 31: Brazil Oil and Gas Industry in India Revenue (Million) Forecast, by Application 2019 & 2032
- Table 32: Brazil Oil and Gas Industry in India Volume (Billion) Forecast, by Application 2019 & 2032
- Table 33: Argentina Oil and Gas Industry in India Revenue (Million) Forecast, by Application 2019 & 2032
- Table 34: Argentina Oil and Gas Industry in India Volume (Billion) Forecast, by Application 2019 & 2032
- Table 35: Rest of South America Oil and Gas Industry in India Revenue (Million) Forecast, by Application 2019 & 2032
- Table 36: Rest of South America Oil and Gas Industry in India Volume (Billion) Forecast, by Application 2019 & 2032
- Table 37: Global Oil and Gas Industry in India Revenue Million Forecast, by Sector 2019 & 2032
- Table 38: Global Oil and Gas Industry in India Volume Billion Forecast, by Sector 2019 & 2032
- Table 39: Global Oil and Gas Industry in India Revenue Million Forecast, by Country 2019 & 2032
- Table 40: Global Oil and Gas Industry in India Volume Billion Forecast, by Country 2019 & 2032
- Table 41: United Kingdom Oil and Gas Industry in India Revenue (Million) Forecast, by Application 2019 & 2032
- Table 42: United Kingdom Oil and Gas Industry in India Volume (Billion) Forecast, by Application 2019 & 2032
- Table 43: Germany Oil and Gas Industry in India Revenue (Million) Forecast, by Application 2019 & 2032
- Table 44: Germany Oil and Gas Industry in India Volume (Billion) Forecast, by Application 2019 & 2032
- Table 45: France Oil and Gas Industry in India Revenue (Million) Forecast, by Application 2019 & 2032
- Table 46: France Oil and Gas Industry in India Volume (Billion) Forecast, by Application 2019 & 2032
- Table 47: Italy Oil and Gas Industry in India Revenue (Million) Forecast, by Application 2019 & 2032
- Table 48: Italy Oil and Gas Industry in India Volume (Billion) Forecast, by Application 2019 & 2032
- Table 49: Spain Oil and Gas Industry in India Revenue (Million) Forecast, by Application 2019 & 2032
- Table 50: Spain Oil and Gas Industry in India Volume (Billion) Forecast, by Application 2019 & 2032
- Table 51: Russia Oil and Gas Industry in India Revenue (Million) Forecast, by Application 2019 & 2032
- Table 52: Russia Oil and Gas Industry in India Volume (Billion) Forecast, by Application 2019 & 2032
- Table 53: Benelux Oil and Gas Industry in India Revenue (Million) Forecast, by Application 2019 & 2032
- Table 54: Benelux Oil and Gas Industry in India Volume (Billion) Forecast, by Application 2019 & 2032
- Table 55: Nordics Oil and Gas Industry in India Revenue (Million) Forecast, by Application 2019 & 2032
- Table 56: Nordics Oil and Gas Industry in India Volume (Billion) Forecast, by Application 2019 & 2032
- Table 57: Rest of Europe Oil and Gas Industry in India Revenue (Million) Forecast, by Application 2019 & 2032
- Table 58: Rest of Europe Oil and Gas Industry in India Volume (Billion) Forecast, by Application 2019 & 2032
- Table 59: Global Oil and Gas Industry in India Revenue Million Forecast, by Sector 2019 & 2032
- Table 60: Global Oil and Gas Industry in India Volume Billion Forecast, by Sector 2019 & 2032
- Table 61: Global Oil and Gas Industry in India Revenue Million Forecast, by Country 2019 & 2032
- Table 62: Global Oil and Gas Industry in India Volume Billion Forecast, by Country 2019 & 2032
- Table 63: Turkey Oil and Gas Industry in India Revenue (Million) Forecast, by Application 2019 & 2032
- Table 64: Turkey Oil and Gas Industry in India Volume (Billion) Forecast, by Application 2019 & 2032
- Table 65: Israel Oil and Gas Industry in India Revenue (Million) Forecast, by Application 2019 & 2032
- Table 66: Israel Oil and Gas Industry in India Volume (Billion) Forecast, by Application 2019 & 2032
- Table 67: GCC Oil and Gas Industry in India Revenue (Million) Forecast, by Application 2019 & 2032
- Table 68: GCC Oil and Gas Industry in India Volume (Billion) Forecast, by Application 2019 & 2032
- Table 69: North Africa Oil and Gas Industry in India Revenue (Million) Forecast, by Application 2019 & 2032
- Table 70: North Africa Oil and Gas Industry in India Volume (Billion) Forecast, by Application 2019 & 2032
- Table 71: South Africa Oil and Gas Industry in India Revenue (Million) Forecast, by Application 2019 & 2032
- Table 72: South Africa Oil and Gas Industry in India Volume (Billion) Forecast, by Application 2019 & 2032
- Table 73: Rest of Middle East & Africa Oil and Gas Industry in India Revenue (Million) Forecast, by Application 2019 & 2032
- Table 74: Rest of Middle East & Africa Oil and Gas Industry in India Volume (Billion) Forecast, by Application 2019 & 2032
- Table 75: Global Oil and Gas Industry in India Revenue Million Forecast, by Sector 2019 & 2032
- Table 76: Global Oil and Gas Industry in India Volume Billion Forecast, by Sector 2019 & 2032
- Table 77: Global Oil and Gas Industry in India Revenue Million Forecast, by Country 2019 & 2032
- Table 78: Global Oil and Gas Industry in India Volume Billion Forecast, by Country 2019 & 2032
- Table 79: China Oil and Gas Industry in India Revenue (Million) Forecast, by Application 2019 & 2032
- Table 80: China Oil and Gas Industry in India Volume (Billion) Forecast, by Application 2019 & 2032
- Table 81: India Oil and Gas Industry in India Revenue (Million) Forecast, by Application 2019 & 2032
- Table 82: India Oil and Gas Industry in India Volume (Billion) Forecast, by Application 2019 & 2032
- Table 83: Japan Oil and Gas Industry in India Revenue (Million) Forecast, by Application 2019 & 2032
- Table 84: Japan Oil and Gas Industry in India Volume (Billion) Forecast, by Application 2019 & 2032
- Table 85: South Korea Oil and Gas Industry in India Revenue (Million) Forecast, by Application 2019 & 2032
- Table 86: South Korea Oil and Gas Industry in India Volume (Billion) Forecast, by Application 2019 & 2032
- Table 87: ASEAN Oil and Gas Industry in India Revenue (Million) Forecast, by Application 2019 & 2032
- Table 88: ASEAN Oil and Gas Industry in India Volume (Billion) Forecast, by Application 2019 & 2032
- Table 89: Oceania Oil and Gas Industry in India Revenue (Million) Forecast, by Application 2019 & 2032
- Table 90: Oceania Oil and Gas Industry in India Volume (Billion) Forecast, by Application 2019 & 2032
- Table 91: Rest of Asia Pacific Oil and Gas Industry in India Revenue (Million) Forecast, by Application 2019 & 2032
- Table 92: Rest of Asia Pacific Oil and Gas Industry in India Volume (Billion) Forecast, by Application 2019 & 2032
Frequently Asked Questions
1. What is the projected Compound Annual Growth Rate (CAGR) of the Oil and Gas Industry in India?
The projected CAGR is approximately 5.20%.
2. Which companies are prominent players in the Oil and Gas Industry in India?
Key companies in the market include Oil and Natural Gas Corporation, Bharat Petroleum Corporation Limited, Reliance Industries, Hindustan Petroleum Corporation Limited, GAIL (India) Limited, Indian Oil Corporation Limited, Oil India Limited, Cairn India, Punj Lloyd Limited.
3. What are the main segments of the Oil and Gas Industry in India?
The market segments include Sector.
4. Can you provide details about the market size?
The market size is estimated to be USD XX Million as of 2022.
5. What are some drivers contributing to market growth?
4.; Increasing Investment in the Upstream Sector4.; Supportive Government Policies.
6. What are the notable trends driving market growth?
The Downstream Sector is Expected to Witness Significant Growth.
7. Are there any restraints impacting market growth?
4.; Increasing Demand to Diversify the Power Generation Mix by Introducing Renewable Energy Sources.
8. Can you provide examples of recent developments in the market?
In March 2023, Indian Oil Corporation Ltd. announced that the company would invest USD 742 million in building a petrochemical complex at Paradip in the state of Odisha.
9. What pricing options are available for accessing the report?
Pricing options include single-user, multi-user, and enterprise licenses priced at USD 3800, USD 4500, and USD 5800 respectively.
10. Is the market size provided in terms of value or volume?
The market size is provided in terms of value, measured in Million and volume, measured in Billion.
11. Are there any specific market keywords associated with the report?
Yes, the market keyword associated with the report is "Oil and Gas Industry in India," which aids in identifying and referencing the specific market segment covered.
12. How do I determine which pricing option suits my needs best?
The pricing options vary based on user requirements and access needs. Individual users may opt for single-user licenses, while businesses requiring broader access may choose multi-user or enterprise licenses for cost-effective access to the report.
13. Are there any additional resources or data provided in the Oil and Gas Industry in India report?
While the report offers comprehensive insights, it's advisable to review the specific contents or supplementary materials provided to ascertain if additional resources or data are available.
14. How can I stay updated on further developments or reports in the Oil and Gas Industry in India?
To stay informed about further developments, trends, and reports in the Oil and Gas Industry in India, consider subscribing to industry newsletters, following relevant companies and organizations, or regularly checking reputable industry news sources and publications.
Methodology
Step 1 - Identification of Relevant Samples Size from Population Database


Step 2 - Approaches for Defining Global Market Size (Value, Volume* & Price*)

Note*: In applicable scenarios
Step 3 - Data Sources
Primary Research
- Web Analytics
- Survey Reports
- Research Institute
- Latest Research Reports
- Opinion Leaders
Secondary Research
- Annual Reports
- White Paper
- Latest Press Release
- Industry Association
- Paid Database
- Investor Presentations

Step 4 - Data Triangulation
Involves using different sources of information in order to increase the validity of a study
These sources are likely to be stakeholders in a program - participants, other researchers, program staff, other community members, and so on.
Then we put all data in single framework & apply various statistical tools to find out the dynamic on the market.
During the analysis stage, feedback from the stakeholder groups would be compared to determine areas of agreement as well as areas of divergence


