
Key Insights
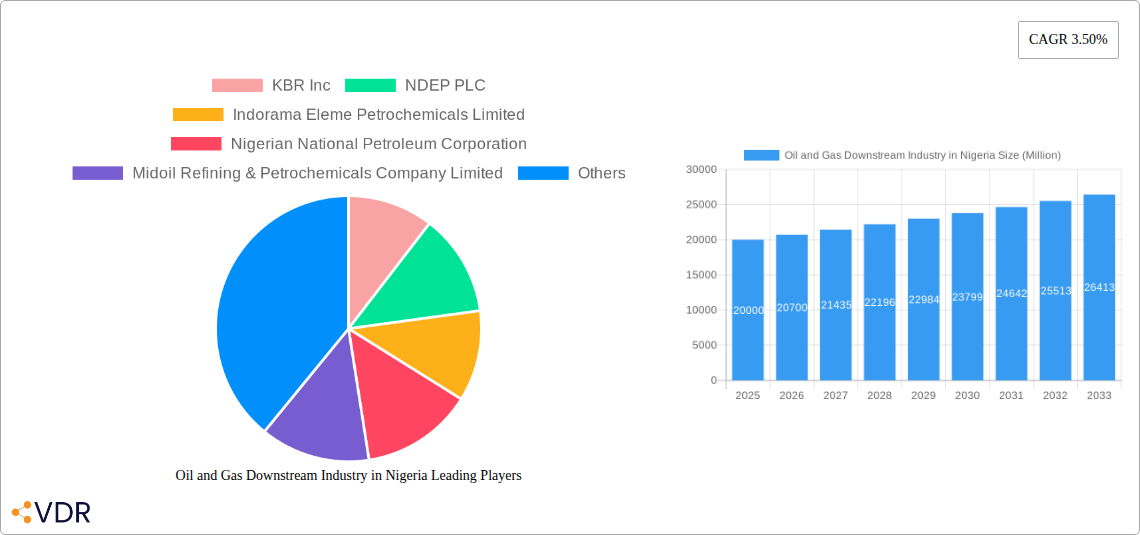
The Nigerian oil and gas downstream sector, encompassing refining, distribution, and end-user sales, presents a dynamic market landscape projected to experience steady growth. With a 2025 market size estimated at $20 billion (based on a reasonable extrapolation from a 3.5% CAGR and considering the significant energy demand in a growing Nigerian economy), the industry is driven by rising domestic consumption, particularly in transportation and industrial sectors. The increasing urbanization and expanding middle class fuel demand for gasoline and diesel, while jet fuel consumption is linked to the growth in air travel. Pipeline infrastructure upgrades and the expansion of distribution networks are key trends shaping the market, alongside government initiatives to improve energy access and security. However, challenges remain, including infrastructure limitations, logistical bottlenecks, and the need for consistent regulatory frameworks. These factors can affect the sector's expansion potential. Competition is present among major players such as KBR Inc, NDEP PLC, Indorama Eleme Petrochemicals Limited, Nigerian National Petroleum Corporation, and Midoil Refining & Petrochemicals Company Limited, who are vying for market share in a sector that faces a constant balancing act between meeting the nation's energy needs and addressing developmental challenges.
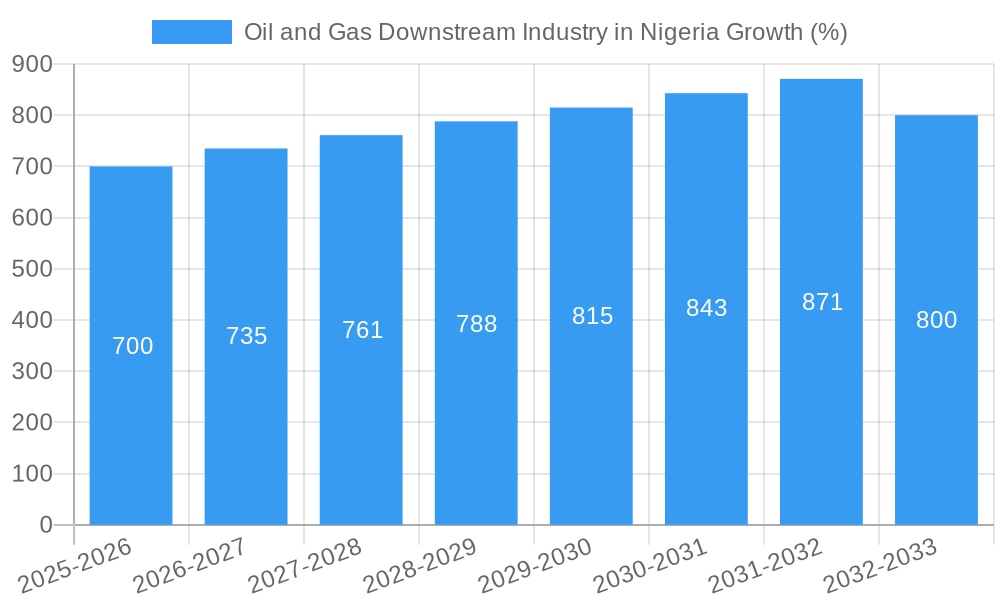
Further growth is anticipated through 2033, driven by continued economic expansion and population growth. Strategic investments in refining capacity, efficient distribution systems, and enhanced regulatory environments are crucial for maximizing the sector's potential. The successful integration of renewable energy sources alongside traditional fossil fuels could also influence the market's long-term trajectory. Focus on improving operational efficiency, enhancing safety standards, and minimizing environmental impact will be important to ensure sustainable growth. Competition and technological advancements will shape the future of the industry as companies optimize operations and develop cost-effective solutions for a potentially volatile global energy landscape.
Oil and Gas Downstream Industry in Nigeria: 2019-2033 Market Report
This comprehensive report provides an in-depth analysis of the Nigerian oil and gas downstream industry, covering the period from 2019 to 2033. It examines market dynamics, growth trends, key players, and future opportunities within the refining, distribution, and end-user segments. This detailed study is essential for industry professionals, investors, and policymakers seeking to understand and capitalize on the evolving landscape of Nigeria's energy sector. The report uses 2025 as its base year and incorporates forecasts extending to 2033.
Oil and Gas Downstream Industry in Nigeria Market Dynamics & Structure
This section analyzes the competitive landscape of Nigeria's oil and gas downstream sector, focusing on market concentration, technological advancements, regulatory influences, and key industry trends. The Nigerian market exhibits a complex interplay of state-owned enterprises like the Nigerian National Petroleum Corporation (NNPC) and private players such as Indorama Eleme Petrochemicals Limited and Midoil Refining & Petrochemicals Company Limited. The market is characterized by significant influence from international players like KBR Inc providing engineering and consulting services.
Market Structure:
- High market concentration with NNPC holding significant market share in refining and distribution.
- Growing participation of private companies, particularly in refining and petrochemical production.
- Fragmented distribution network with numerous independent gas stations.
- Regulatory influence impacting investment decisions and operational efficiency.
- M&A activity remains moderate with a total deal volume of xx Million USD in the period 2019-2024. This is expected to increase in the forecast period due to industry consolidation.
- Market share of top 5 players: xx% (estimated)
Technological Innovation:
- Adoption of advanced refining technologies to improve efficiency and product quality.
- Investment in pipeline infrastructure modernization for enhanced transportation capabilities.
- Barriers to innovation include funding constraints and regulatory complexities.
Regulatory Framework:
- Government policies significantly influence investment decisions and market access.
- Licensing and permitting processes impact project timelines and operational costs.
- Changes in fuel pricing mechanisms affect profitability and market stability.
Competitive Product Substitutes:
- Limited direct substitutes for petroleum products in the short-to-medium term.
- Increased focus on renewable energy may present a long-term competitive challenge.
End-User Demographics:
- Growing demand from a rising population and expanding vehicle ownership.
- Increasing demand from the aviation sector with growth in airport activity.
- Shifting consumption patterns influencing the demand for different fuel types.
Oil and Gas Downstream Industry in Nigeria Growth Trends & Insights
Nigeria's downstream oil and gas market is projected to experience robust growth driven by rising energy demand, infrastructure investments, and government initiatives to enhance the sector’s efficiency. The market size is estimated at xx Million USD in 2025 and is forecast to reach xx Million USD by 2033, exhibiting a CAGR of xx%. This growth is fueled by a variety of factors, including increased vehicle ownership, rising urbanization, and the expansion of the aviation sector. Technological disruptions, such as the adoption of advanced refining techniques and automation in distribution networks, will also contribute significantly to this growth. Consumer behavior is showing a trend toward increased demand for cleaner fuels and higher-quality petroleum products.
Dominant Regions, Countries, or Segments in Oil and Gas Downstream Industry in Nigeria
The Lagos and Port Harcourt regions are the dominant players in Nigeria’s downstream oil and gas sector, driven by their strategic location, existing infrastructure, and significant concentration of refineries and distribution centers. The refining segment, particularly the production of gasoline and diesel, represents the largest portion of the market, owing to high domestic consumption driven by transportation and industrial activities.
Key Drivers:
- High population density and rapid urbanization in Lagos and Port Harcourt.
- Established refining infrastructure and distribution networks.
- Significant presence of major oil and gas companies.
- Government investment in infrastructure projects.
Gasoline, Diesel and Jet Fuel Refining Segment Dominance:
- High demand for transportation fuels due to population and economic growth.
- Limited domestic production capacity for alternative fuels, leading to reliance on conventional fuels.
- Government policies supporting domestic fuel production to ensure energy security.
Distribution Segment:
- Pipelines are vital for fuel transportation and efficiency improvements are prioritized.
- Growth potential in expanding storage and distribution networks in underserved regions.
- Expansion of gas stations and improvements in distribution management systems.
End-Users:
- Gas stations are the main retail outlet, and their expansion is pivotal for market reach.
- Growth in the aviation sector fuels demand for jet fuel and the development of airport refueling infrastructure.
Oil and Gas Downstream Industry in Nigeria Product Landscape
The Nigerian downstream oil and gas market encompasses a range of refined petroleum products, including gasoline, diesel, kerosene, jet fuel, and liquefied petroleum gas (LPG). Product innovation focuses on improving fuel quality, enhancing efficiency, and incorporating environmental sustainability standards. Recent innovations include the introduction of cleaner-burning fuels and the expansion of LPG distribution to support cleaner cooking solutions. Technological advancements are directed towards optimizing refining processes and improving distribution efficiency. Key selling propositions include improved fuel quality, lower emissions, and enhanced performance.
Key Drivers, Barriers & Challenges in Oil and Gas Downstream Industry in Nigeria
Key Drivers:
- Strong domestic demand for petroleum products fueled by population growth and economic activity.
- Government initiatives aimed at improving refining capacity and infrastructure development.
- Investments by private sector companies in new refining and distribution projects.
Key Challenges and Restraints:
- Significant infrastructure deficit impacting distribution efficiency.
- Regulatory uncertainties and licensing delays hinder investment and project implementation.
- Fuel subsidy burden creates fiscal challenges for the government, impacting industry profitability.
- Power shortages disrupt refinery operations and cause significant production losses, estimated at xx Million USD annually.
- Competition from imported products can significantly affect market share for local refineries.
Emerging Opportunities in Oil and Gas Downstream Industry in Nigeria
- Expansion of LPG infrastructure to cater to growing demand for cleaner cooking solutions.
- Investments in renewable energy sources to supplement fossil fuels.
- Development of specialized fuel blends to meet the needs of specific sectors.
- Growth in petrochemical production to support industrial expansion.
Growth Accelerators in the Oil and Gas Downstream Industry in Nigeria Industry
The Nigerian downstream oil and gas industry's future growth is significantly reliant on sustained investment in refining capacity, infrastructure expansion, and technological advancements. Strategic partnerships between domestic and international players will play a crucial role in attracting the necessary capital and expertise. Effective regulatory frameworks that provide clear guidelines and incentives for investment are essential to facilitate this growth. Furthermore, technological innovations, such as advanced refining techniques and automation in distribution networks, will drive efficiency gains and enhance operational capabilities.
Key Players Shaping the Oil and Gas Downstream Industry in Nigeria Market
- KBR Inc
- NDEP PLC
- Indorama Eleme Petrochemicals Limited
- Nigerian National Petroleum Corporation (NNPC)
- Midoil Refining & Petrochemicals Company Limited
Notable Milestones in Oil and Gas Downstream Industry in Nigeria Sector
August 2022: The Nigerian National Petroleum Company announced that the Dangote Refinery is expected to start commercial operations by mid-2023. This refinery, with a capacity of 650,000 barrels per day, represents a significant boost to Nigeria's refining capacity.
November 2022: Nigeria's Gasoline Integrated International announced plans to build a USD 68 million refinery on Tongeji Island, with an initial capacity of 100,000 liters per day, expandable to 400,000 liters per day. This signifies growing private sector interest in refining.
In-Depth Oil and Gas Downstream Industry in Nigeria Market Outlook
The Nigerian downstream oil and gas market holds significant future potential, driven by continued population growth, urbanization, and industrialization. Strategic investments in refining capacity, pipeline infrastructure, and distribution networks are crucial to meet rising energy demand. The successful integration of renewable energy sources alongside fossil fuels will be key to long-term sustainability. Furthermore, embracing technological advancements will be pivotal in enhancing efficiency and competitiveness within the sector. The market offers attractive opportunities for both domestic and international players seeking to capitalize on Nigeria's growing energy needs.
Oil and Gas Downstream Industry in Nigeria Segmentation
- 1. Refining
- 2. Petrochemical
- 3. Retail Sales
Oil and Gas Downstream Industry in Nigeria Segmentation By Geography
-
1. North America
- 1.1. United States
- 1.2. Canada
- 1.3. Mexico
-
2. South America
- 2.1. Brazil
- 2.2. Argentina
- 2.3. Rest of South America
-
3. Europe
- 3.1. United Kingdom
- 3.2. Germany
- 3.3. France
- 3.4. Italy
- 3.5. Spain
- 3.6. Russia
- 3.7. Benelux
- 3.8. Nordics
- 3.9. Rest of Europe
-
4. Middle East & Africa
- 4.1. Turkey
- 4.2. Israel
- 4.3. GCC
- 4.4. North Africa
- 4.5. South Africa
- 4.6. Rest of Middle East & Africa
-
5. Asia Pacific
- 5.1. China
- 5.2. India
- 5.3. Japan
- 5.4. South Korea
- 5.5. ASEAN
- 5.6. Oceania
- 5.7. Rest of Asia Pacific
Oil and Gas Downstream Industry in Nigeria REPORT HIGHLIGHTS
| Aspects | Details |
|---|---|
| Study Period | 2019-2033 |
| Base Year | 2024 |
| Estimated Year | 2025 |
| Forecast Period | 2025-2033 |
| Historical Period | 2019-2024 |
| Growth Rate | CAGR of 3.50% from 2019-2033 |
| Segmentation |
|
Table of Contents
- 1. Introduction
- 1.1. Research Scope
- 1.2. Market Segmentation
- 1.3. Research Methodology
- 1.4. Definitions and Assumptions
- 2. Executive Summary
- 2.1. Introduction
- 3. Market Dynamics
- 3.1. Introduction
- 3.2. Market Drivers
- 3.2.1. 4.; Rising Demand for Increaing Refinening Capacity4.; Increasing Investment in Downstream Sector
- 3.3. Market Restrains
- 3.3.1. 4.; Fluctuating Price of Crude Oil May Impede the Development of the Downstream Sector
- 3.4. Market Trends
- 3.4.1. Refining Segment Expected to Dominate the Market
- 4. Market Factor Analysis
- 4.1. Porters Five Forces
- 4.2. Supply/Value Chain
- 4.3. PESTEL analysis
- 4.4. Market Entropy
- 4.5. Patent/Trademark Analysis
- 5. Global Oil and Gas Downstream Industry in Nigeria Analysis, Insights and Forecast, 2019-2031
- 5.1. Market Analysis, Insights and Forecast - by Refining
- 5.2. Market Analysis, Insights and Forecast - by Petrochemical
- 5.3. Market Analysis, Insights and Forecast - by Retail Sales
- 5.4. Market Analysis, Insights and Forecast - by Region
- 5.4.1. North America
- 5.4.2. South America
- 5.4.3. Europe
- 5.4.4. Middle East & Africa
- 5.4.5. Asia Pacific
- 5.1. Market Analysis, Insights and Forecast - by Refining
- 6. North America Oil and Gas Downstream Industry in Nigeria Analysis, Insights and Forecast, 2019-2031
- 6.1. Market Analysis, Insights and Forecast - by Refining
- 6.2. Market Analysis, Insights and Forecast - by Petrochemical
- 6.3. Market Analysis, Insights and Forecast - by Retail Sales
- 6.1. Market Analysis, Insights and Forecast - by Refining
- 7. South America Oil and Gas Downstream Industry in Nigeria Analysis, Insights and Forecast, 2019-2031
- 7.1. Market Analysis, Insights and Forecast - by Refining
- 7.2. Market Analysis, Insights and Forecast - by Petrochemical
- 7.3. Market Analysis, Insights and Forecast - by Retail Sales
- 7.1. Market Analysis, Insights and Forecast - by Refining
- 8. Europe Oil and Gas Downstream Industry in Nigeria Analysis, Insights and Forecast, 2019-2031
- 8.1. Market Analysis, Insights and Forecast - by Refining
- 8.2. Market Analysis, Insights and Forecast - by Petrochemical
- 8.3. Market Analysis, Insights and Forecast - by Retail Sales
- 8.1. Market Analysis, Insights and Forecast - by Refining
- 9. Middle East & Africa Oil and Gas Downstream Industry in Nigeria Analysis, Insights and Forecast, 2019-2031
- 9.1. Market Analysis, Insights and Forecast - by Refining
- 9.2. Market Analysis, Insights and Forecast - by Petrochemical
- 9.3. Market Analysis, Insights and Forecast - by Retail Sales
- 9.1. Market Analysis, Insights and Forecast - by Refining
- 10. Asia Pacific Oil and Gas Downstream Industry in Nigeria Analysis, Insights and Forecast, 2019-2031
- 10.1. Market Analysis, Insights and Forecast - by Refining
- 10.2. Market Analysis, Insights and Forecast - by Petrochemical
- 10.3. Market Analysis, Insights and Forecast - by Retail Sales
- 10.1. Market Analysis, Insights and Forecast - by Refining
- 11. Competitive Analysis
- 11.1. Global Market Share Analysis 2024
- 11.2. Company Profiles
- 11.2.1 KBR Inc
- 11.2.1.1. Overview
- 11.2.1.2. Products
- 11.2.1.3. SWOT Analysis
- 11.2.1.4. Recent Developments
- 11.2.1.5. Financials (Based on Availability)
- 11.2.2 NDEP PLC
- 11.2.2.1. Overview
- 11.2.2.2. Products
- 11.2.2.3. SWOT Analysis
- 11.2.2.4. Recent Developments
- 11.2.2.5. Financials (Based on Availability)
- 11.2.3 Indorama Eleme Petrochemicals Limited
- 11.2.3.1. Overview
- 11.2.3.2. Products
- 11.2.3.3. SWOT Analysis
- 11.2.3.4. Recent Developments
- 11.2.3.5. Financials (Based on Availability)
- 11.2.4 Nigerian National Petroleum Corporation
- 11.2.4.1. Overview
- 11.2.4.2. Products
- 11.2.4.3. SWOT Analysis
- 11.2.4.4. Recent Developments
- 11.2.4.5. Financials (Based on Availability)
- 11.2.5 Midoil Refining & Petrochemicals Company Limited
- 11.2.5.1. Overview
- 11.2.5.2. Products
- 11.2.5.3. SWOT Analysis
- 11.2.5.4. Recent Developments
- 11.2.5.5. Financials (Based on Availability)
- 11.2.1 KBR Inc
List of Figures
- Figure 1: Global Oil and Gas Downstream Industry in Nigeria Revenue Breakdown (Million, %) by Region 2024 & 2032
- Figure 2: Global Oil and Gas Downstream Industry in Nigeria Volume Breakdown (Million, %) by Region 2024 & 2032
- Figure 3: Nigeria Oil and Gas Downstream Industry in Nigeria Revenue (Million), by Country 2024 & 2032
- Figure 4: Nigeria Oil and Gas Downstream Industry in Nigeria Volume (Million), by Country 2024 & 2032
- Figure 5: Nigeria Oil and Gas Downstream Industry in Nigeria Revenue Share (%), by Country 2024 & 2032
- Figure 6: Nigeria Oil and Gas Downstream Industry in Nigeria Volume Share (%), by Country 2024 & 2032
- Figure 7: North America Oil and Gas Downstream Industry in Nigeria Revenue (Million), by Refining 2024 & 2032
- Figure 8: North America Oil and Gas Downstream Industry in Nigeria Volume (Million), by Refining 2024 & 2032
- Figure 9: North America Oil and Gas Downstream Industry in Nigeria Revenue Share (%), by Refining 2024 & 2032
- Figure 10: North America Oil and Gas Downstream Industry in Nigeria Volume Share (%), by Refining 2024 & 2032
- Figure 11: North America Oil and Gas Downstream Industry in Nigeria Revenue (Million), by Petrochemical 2024 & 2032
- Figure 12: North America Oil and Gas Downstream Industry in Nigeria Volume (Million), by Petrochemical 2024 & 2032
- Figure 13: North America Oil and Gas Downstream Industry in Nigeria Revenue Share (%), by Petrochemical 2024 & 2032
- Figure 14: North America Oil and Gas Downstream Industry in Nigeria Volume Share (%), by Petrochemical 2024 & 2032
- Figure 15: North America Oil and Gas Downstream Industry in Nigeria Revenue (Million), by Retail Sales 2024 & 2032
- Figure 16: North America Oil and Gas Downstream Industry in Nigeria Volume (Million), by Retail Sales 2024 & 2032
- Figure 17: North America Oil and Gas Downstream Industry in Nigeria Revenue Share (%), by Retail Sales 2024 & 2032
- Figure 18: North America Oil and Gas Downstream Industry in Nigeria Volume Share (%), by Retail Sales 2024 & 2032
- Figure 19: North America Oil and Gas Downstream Industry in Nigeria Revenue (Million), by Country 2024 & 2032
- Figure 20: North America Oil and Gas Downstream Industry in Nigeria Volume (Million), by Country 2024 & 2032
- Figure 21: North America Oil and Gas Downstream Industry in Nigeria Revenue Share (%), by Country 2024 & 2032
- Figure 22: North America Oil and Gas Downstream Industry in Nigeria Volume Share (%), by Country 2024 & 2032
- Figure 23: South America Oil and Gas Downstream Industry in Nigeria Revenue (Million), by Refining 2024 & 2032
- Figure 24: South America Oil and Gas Downstream Industry in Nigeria Volume (Million), by Refining 2024 & 2032
- Figure 25: South America Oil and Gas Downstream Industry in Nigeria Revenue Share (%), by Refining 2024 & 2032
- Figure 26: South America Oil and Gas Downstream Industry in Nigeria Volume Share (%), by Refining 2024 & 2032
- Figure 27: South America Oil and Gas Downstream Industry in Nigeria Revenue (Million), by Petrochemical 2024 & 2032
- Figure 28: South America Oil and Gas Downstream Industry in Nigeria Volume (Million), by Petrochemical 2024 & 2032
- Figure 29: South America Oil and Gas Downstream Industry in Nigeria Revenue Share (%), by Petrochemical 2024 & 2032
- Figure 30: South America Oil and Gas Downstream Industry in Nigeria Volume Share (%), by Petrochemical 2024 & 2032
- Figure 31: South America Oil and Gas Downstream Industry in Nigeria Revenue (Million), by Retail Sales 2024 & 2032
- Figure 32: South America Oil and Gas Downstream Industry in Nigeria Volume (Million), by Retail Sales 2024 & 2032
- Figure 33: South America Oil and Gas Downstream Industry in Nigeria Revenue Share (%), by Retail Sales 2024 & 2032
- Figure 34: South America Oil and Gas Downstream Industry in Nigeria Volume Share (%), by Retail Sales 2024 & 2032
- Figure 35: South America Oil and Gas Downstream Industry in Nigeria Revenue (Million), by Country 2024 & 2032
- Figure 36: South America Oil and Gas Downstream Industry in Nigeria Volume (Million), by Country 2024 & 2032
- Figure 37: South America Oil and Gas Downstream Industry in Nigeria Revenue Share (%), by Country 2024 & 2032
- Figure 38: South America Oil and Gas Downstream Industry in Nigeria Volume Share (%), by Country 2024 & 2032
- Figure 39: Europe Oil and Gas Downstream Industry in Nigeria Revenue (Million), by Refining 2024 & 2032
- Figure 40: Europe Oil and Gas Downstream Industry in Nigeria Volume (Million), by Refining 2024 & 2032
- Figure 41: Europe Oil and Gas Downstream Industry in Nigeria Revenue Share (%), by Refining 2024 & 2032
- Figure 42: Europe Oil and Gas Downstream Industry in Nigeria Volume Share (%), by Refining 2024 & 2032
- Figure 43: Europe Oil and Gas Downstream Industry in Nigeria Revenue (Million), by Petrochemical 2024 & 2032
- Figure 44: Europe Oil and Gas Downstream Industry in Nigeria Volume (Million), by Petrochemical 2024 & 2032
- Figure 45: Europe Oil and Gas Downstream Industry in Nigeria Revenue Share (%), by Petrochemical 2024 & 2032
- Figure 46: Europe Oil and Gas Downstream Industry in Nigeria Volume Share (%), by Petrochemical 2024 & 2032
- Figure 47: Europe Oil and Gas Downstream Industry in Nigeria Revenue (Million), by Retail Sales 2024 & 2032
- Figure 48: Europe Oil and Gas Downstream Industry in Nigeria Volume (Million), by Retail Sales 2024 & 2032
- Figure 49: Europe Oil and Gas Downstream Industry in Nigeria Revenue Share (%), by Retail Sales 2024 & 2032
- Figure 50: Europe Oil and Gas Downstream Industry in Nigeria Volume Share (%), by Retail Sales 2024 & 2032
- Figure 51: Europe Oil and Gas Downstream Industry in Nigeria Revenue (Million), by Country 2024 & 2032
- Figure 52: Europe Oil and Gas Downstream Industry in Nigeria Volume (Million), by Country 2024 & 2032
- Figure 53: Europe Oil and Gas Downstream Industry in Nigeria Revenue Share (%), by Country 2024 & 2032
- Figure 54: Europe Oil and Gas Downstream Industry in Nigeria Volume Share (%), by Country 2024 & 2032
- Figure 55: Middle East & Africa Oil and Gas Downstream Industry in Nigeria Revenue (Million), by Refining 2024 & 2032
- Figure 56: Middle East & Africa Oil and Gas Downstream Industry in Nigeria Volume (Million), by Refining 2024 & 2032
- Figure 57: Middle East & Africa Oil and Gas Downstream Industry in Nigeria Revenue Share (%), by Refining 2024 & 2032
- Figure 58: Middle East & Africa Oil and Gas Downstream Industry in Nigeria Volume Share (%), by Refining 2024 & 2032
- Figure 59: Middle East & Africa Oil and Gas Downstream Industry in Nigeria Revenue (Million), by Petrochemical 2024 & 2032
- Figure 60: Middle East & Africa Oil and Gas Downstream Industry in Nigeria Volume (Million), by Petrochemical 2024 & 2032
- Figure 61: Middle East & Africa Oil and Gas Downstream Industry in Nigeria Revenue Share (%), by Petrochemical 2024 & 2032
- Figure 62: Middle East & Africa Oil and Gas Downstream Industry in Nigeria Volume Share (%), by Petrochemical 2024 & 2032
- Figure 63: Middle East & Africa Oil and Gas Downstream Industry in Nigeria Revenue (Million), by Retail Sales 2024 & 2032
- Figure 64: Middle East & Africa Oil and Gas Downstream Industry in Nigeria Volume (Million), by Retail Sales 2024 & 2032
- Figure 65: Middle East & Africa Oil and Gas Downstream Industry in Nigeria Revenue Share (%), by Retail Sales 2024 & 2032
- Figure 66: Middle East & Africa Oil and Gas Downstream Industry in Nigeria Volume Share (%), by Retail Sales 2024 & 2032
- Figure 67: Middle East & Africa Oil and Gas Downstream Industry in Nigeria Revenue (Million), by Country 2024 & 2032
- Figure 68: Middle East & Africa Oil and Gas Downstream Industry in Nigeria Volume (Million), by Country 2024 & 2032
- Figure 69: Middle East & Africa Oil and Gas Downstream Industry in Nigeria Revenue Share (%), by Country 2024 & 2032
- Figure 70: Middle East & Africa Oil and Gas Downstream Industry in Nigeria Volume Share (%), by Country 2024 & 2032
- Figure 71: Asia Pacific Oil and Gas Downstream Industry in Nigeria Revenue (Million), by Refining 2024 & 2032
- Figure 72: Asia Pacific Oil and Gas Downstream Industry in Nigeria Volume (Million), by Refining 2024 & 2032
- Figure 73: Asia Pacific Oil and Gas Downstream Industry in Nigeria Revenue Share (%), by Refining 2024 & 2032
- Figure 74: Asia Pacific Oil and Gas Downstream Industry in Nigeria Volume Share (%), by Refining 2024 & 2032
- Figure 75: Asia Pacific Oil and Gas Downstream Industry in Nigeria Revenue (Million), by Petrochemical 2024 & 2032
- Figure 76: Asia Pacific Oil and Gas Downstream Industry in Nigeria Volume (Million), by Petrochemical 2024 & 2032
- Figure 77: Asia Pacific Oil and Gas Downstream Industry in Nigeria Revenue Share (%), by Petrochemical 2024 & 2032
- Figure 78: Asia Pacific Oil and Gas Downstream Industry in Nigeria Volume Share (%), by Petrochemical 2024 & 2032
- Figure 79: Asia Pacific Oil and Gas Downstream Industry in Nigeria Revenue (Million), by Retail Sales 2024 & 2032
- Figure 80: Asia Pacific Oil and Gas Downstream Industry in Nigeria Volume (Million), by Retail Sales 2024 & 2032
- Figure 81: Asia Pacific Oil and Gas Downstream Industry in Nigeria Revenue Share (%), by Retail Sales 2024 & 2032
- Figure 82: Asia Pacific Oil and Gas Downstream Industry in Nigeria Volume Share (%), by Retail Sales 2024 & 2032
- Figure 83: Asia Pacific Oil and Gas Downstream Industry in Nigeria Revenue (Million), by Country 2024 & 2032
- Figure 84: Asia Pacific Oil and Gas Downstream Industry in Nigeria Volume (Million), by Country 2024 & 2032
- Figure 85: Asia Pacific Oil and Gas Downstream Industry in Nigeria Revenue Share (%), by Country 2024 & 2032
- Figure 86: Asia Pacific Oil and Gas Downstream Industry in Nigeria Volume Share (%), by Country 2024 & 2032
List of Tables
- Table 1: Global Oil and Gas Downstream Industry in Nigeria Revenue Million Forecast, by Region 2019 & 2032
- Table 2: Global Oil and Gas Downstream Industry in Nigeria Volume Million Forecast, by Region 2019 & 2032
- Table 3: Global Oil and Gas Downstream Industry in Nigeria Revenue Million Forecast, by Refining 2019 & 2032
- Table 4: Global Oil and Gas Downstream Industry in Nigeria Volume Million Forecast, by Refining 2019 & 2032
- Table 5: Global Oil and Gas Downstream Industry in Nigeria Revenue Million Forecast, by Petrochemical 2019 & 2032
- Table 6: Global Oil and Gas Downstream Industry in Nigeria Volume Million Forecast, by Petrochemical 2019 & 2032
- Table 7: Global Oil and Gas Downstream Industry in Nigeria Revenue Million Forecast, by Retail Sales 2019 & 2032
- Table 8: Global Oil and Gas Downstream Industry in Nigeria Volume Million Forecast, by Retail Sales 2019 & 2032
- Table 9: Global Oil and Gas Downstream Industry in Nigeria Revenue Million Forecast, by Region 2019 & 2032
- Table 10: Global Oil and Gas Downstream Industry in Nigeria Volume Million Forecast, by Region 2019 & 2032
- Table 11: Global Oil and Gas Downstream Industry in Nigeria Revenue Million Forecast, by Country 2019 & 2032
- Table 12: Global Oil and Gas Downstream Industry in Nigeria Volume Million Forecast, by Country 2019 & 2032
- Table 13: Global Oil and Gas Downstream Industry in Nigeria Revenue Million Forecast, by Refining 2019 & 2032
- Table 14: Global Oil and Gas Downstream Industry in Nigeria Volume Million Forecast, by Refining 2019 & 2032
- Table 15: Global Oil and Gas Downstream Industry in Nigeria Revenue Million Forecast, by Petrochemical 2019 & 2032
- Table 16: Global Oil and Gas Downstream Industry in Nigeria Volume Million Forecast, by Petrochemical 2019 & 2032
- Table 17: Global Oil and Gas Downstream Industry in Nigeria Revenue Million Forecast, by Retail Sales 2019 & 2032
- Table 18: Global Oil and Gas Downstream Industry in Nigeria Volume Million Forecast, by Retail Sales 2019 & 2032
- Table 19: Global Oil and Gas Downstream Industry in Nigeria Revenue Million Forecast, by Country 2019 & 2032
- Table 20: Global Oil and Gas Downstream Industry in Nigeria Volume Million Forecast, by Country 2019 & 2032
- Table 21: United States Oil and Gas Downstream Industry in Nigeria Revenue (Million) Forecast, by Application 2019 & 2032
- Table 22: United States Oil and Gas Downstream Industry in Nigeria Volume (Million) Forecast, by Application 2019 & 2032
- Table 23: Canada Oil and Gas Downstream Industry in Nigeria Revenue (Million) Forecast, by Application 2019 & 2032
- Table 24: Canada Oil and Gas Downstream Industry in Nigeria Volume (Million) Forecast, by Application 2019 & 2032
- Table 25: Mexico Oil and Gas Downstream Industry in Nigeria Revenue (Million) Forecast, by Application 2019 & 2032
- Table 26: Mexico Oil and Gas Downstream Industry in Nigeria Volume (Million) Forecast, by Application 2019 & 2032
- Table 27: Global Oil and Gas Downstream Industry in Nigeria Revenue Million Forecast, by Refining 2019 & 2032
- Table 28: Global Oil and Gas Downstream Industry in Nigeria Volume Million Forecast, by Refining 2019 & 2032
- Table 29: Global Oil and Gas Downstream Industry in Nigeria Revenue Million Forecast, by Petrochemical 2019 & 2032
- Table 30: Global Oil and Gas Downstream Industry in Nigeria Volume Million Forecast, by Petrochemical 2019 & 2032
- Table 31: Global Oil and Gas Downstream Industry in Nigeria Revenue Million Forecast, by Retail Sales 2019 & 2032
- Table 32: Global Oil and Gas Downstream Industry in Nigeria Volume Million Forecast, by Retail Sales 2019 & 2032
- Table 33: Global Oil and Gas Downstream Industry in Nigeria Revenue Million Forecast, by Country 2019 & 2032
- Table 34: Global Oil and Gas Downstream Industry in Nigeria Volume Million Forecast, by Country 2019 & 2032
- Table 35: Brazil Oil and Gas Downstream Industry in Nigeria Revenue (Million) Forecast, by Application 2019 & 2032
- Table 36: Brazil Oil and Gas Downstream Industry in Nigeria Volume (Million) Forecast, by Application 2019 & 2032
- Table 37: Argentina Oil and Gas Downstream Industry in Nigeria Revenue (Million) Forecast, by Application 2019 & 2032
- Table 38: Argentina Oil and Gas Downstream Industry in Nigeria Volume (Million) Forecast, by Application 2019 & 2032
- Table 39: Rest of South America Oil and Gas Downstream Industry in Nigeria Revenue (Million) Forecast, by Application 2019 & 2032
- Table 40: Rest of South America Oil and Gas Downstream Industry in Nigeria Volume (Million) Forecast, by Application 2019 & 2032
- Table 41: Global Oil and Gas Downstream Industry in Nigeria Revenue Million Forecast, by Refining 2019 & 2032
- Table 42: Global Oil and Gas Downstream Industry in Nigeria Volume Million Forecast, by Refining 2019 & 2032
- Table 43: Global Oil and Gas Downstream Industry in Nigeria Revenue Million Forecast, by Petrochemical 2019 & 2032
- Table 44: Global Oil and Gas Downstream Industry in Nigeria Volume Million Forecast, by Petrochemical 2019 & 2032
- Table 45: Global Oil and Gas Downstream Industry in Nigeria Revenue Million Forecast, by Retail Sales 2019 & 2032
- Table 46: Global Oil and Gas Downstream Industry in Nigeria Volume Million Forecast, by Retail Sales 2019 & 2032
- Table 47: Global Oil and Gas Downstream Industry in Nigeria Revenue Million Forecast, by Country 2019 & 2032
- Table 48: Global Oil and Gas Downstream Industry in Nigeria Volume Million Forecast, by Country 2019 & 2032
- Table 49: United Kingdom Oil and Gas Downstream Industry in Nigeria Revenue (Million) Forecast, by Application 2019 & 2032
- Table 50: United Kingdom Oil and Gas Downstream Industry in Nigeria Volume (Million) Forecast, by Application 2019 & 2032
- Table 51: Germany Oil and Gas Downstream Industry in Nigeria Revenue (Million) Forecast, by Application 2019 & 2032
- Table 52: Germany Oil and Gas Downstream Industry in Nigeria Volume (Million) Forecast, by Application 2019 & 2032
- Table 53: France Oil and Gas Downstream Industry in Nigeria Revenue (Million) Forecast, by Application 2019 & 2032
- Table 54: France Oil and Gas Downstream Industry in Nigeria Volume (Million) Forecast, by Application 2019 & 2032
- Table 55: Italy Oil and Gas Downstream Industry in Nigeria Revenue (Million) Forecast, by Application 2019 & 2032
- Table 56: Italy Oil and Gas Downstream Industry in Nigeria Volume (Million) Forecast, by Application 2019 & 2032
- Table 57: Spain Oil and Gas Downstream Industry in Nigeria Revenue (Million) Forecast, by Application 2019 & 2032
- Table 58: Spain Oil and Gas Downstream Industry in Nigeria Volume (Million) Forecast, by Application 2019 & 2032
- Table 59: Russia Oil and Gas Downstream Industry in Nigeria Revenue (Million) Forecast, by Application 2019 & 2032
- Table 60: Russia Oil and Gas Downstream Industry in Nigeria Volume (Million) Forecast, by Application 2019 & 2032
- Table 61: Benelux Oil and Gas Downstream Industry in Nigeria Revenue (Million) Forecast, by Application 2019 & 2032
- Table 62: Benelux Oil and Gas Downstream Industry in Nigeria Volume (Million) Forecast, by Application 2019 & 2032
- Table 63: Nordics Oil and Gas Downstream Industry in Nigeria Revenue (Million) Forecast, by Application 2019 & 2032
- Table 64: Nordics Oil and Gas Downstream Industry in Nigeria Volume (Million) Forecast, by Application 2019 & 2032
- Table 65: Rest of Europe Oil and Gas Downstream Industry in Nigeria Revenue (Million) Forecast, by Application 2019 & 2032
- Table 66: Rest of Europe Oil and Gas Downstream Industry in Nigeria Volume (Million) Forecast, by Application 2019 & 2032
- Table 67: Global Oil and Gas Downstream Industry in Nigeria Revenue Million Forecast, by Refining 2019 & 2032
- Table 68: Global Oil and Gas Downstream Industry in Nigeria Volume Million Forecast, by Refining 2019 & 2032
- Table 69: Global Oil and Gas Downstream Industry in Nigeria Revenue Million Forecast, by Petrochemical 2019 & 2032
- Table 70: Global Oil and Gas Downstream Industry in Nigeria Volume Million Forecast, by Petrochemical 2019 & 2032
- Table 71: Global Oil and Gas Downstream Industry in Nigeria Revenue Million Forecast, by Retail Sales 2019 & 2032
- Table 72: Global Oil and Gas Downstream Industry in Nigeria Volume Million Forecast, by Retail Sales 2019 & 2032
- Table 73: Global Oil and Gas Downstream Industry in Nigeria Revenue Million Forecast, by Country 2019 & 2032
- Table 74: Global Oil and Gas Downstream Industry in Nigeria Volume Million Forecast, by Country 2019 & 2032
- Table 75: Turkey Oil and Gas Downstream Industry in Nigeria Revenue (Million) Forecast, by Application 2019 & 2032
- Table 76: Turkey Oil and Gas Downstream Industry in Nigeria Volume (Million) Forecast, by Application 2019 & 2032
- Table 77: Israel Oil and Gas Downstream Industry in Nigeria Revenue (Million) Forecast, by Application 2019 & 2032
- Table 78: Israel Oil and Gas Downstream Industry in Nigeria Volume (Million) Forecast, by Application 2019 & 2032
- Table 79: GCC Oil and Gas Downstream Industry in Nigeria Revenue (Million) Forecast, by Application 2019 & 2032
- Table 80: GCC Oil and Gas Downstream Industry in Nigeria Volume (Million) Forecast, by Application 2019 & 2032
- Table 81: North Africa Oil and Gas Downstream Industry in Nigeria Revenue (Million) Forecast, by Application 2019 & 2032
- Table 82: North Africa Oil and Gas Downstream Industry in Nigeria Volume (Million) Forecast, by Application 2019 & 2032
- Table 83: South Africa Oil and Gas Downstream Industry in Nigeria Revenue (Million) Forecast, by Application 2019 & 2032
- Table 84: South Africa Oil and Gas Downstream Industry in Nigeria Volume (Million) Forecast, by Application 2019 & 2032
- Table 85: Rest of Middle East & Africa Oil and Gas Downstream Industry in Nigeria Revenue (Million) Forecast, by Application 2019 & 2032
- Table 86: Rest of Middle East & Africa Oil and Gas Downstream Industry in Nigeria Volume (Million) Forecast, by Application 2019 & 2032
- Table 87: Global Oil and Gas Downstream Industry in Nigeria Revenue Million Forecast, by Refining 2019 & 2032
- Table 88: Global Oil and Gas Downstream Industry in Nigeria Volume Million Forecast, by Refining 2019 & 2032
- Table 89: Global Oil and Gas Downstream Industry in Nigeria Revenue Million Forecast, by Petrochemical 2019 & 2032
- Table 90: Global Oil and Gas Downstream Industry in Nigeria Volume Million Forecast, by Petrochemical 2019 & 2032
- Table 91: Global Oil and Gas Downstream Industry in Nigeria Revenue Million Forecast, by Retail Sales 2019 & 2032
- Table 92: Global Oil and Gas Downstream Industry in Nigeria Volume Million Forecast, by Retail Sales 2019 & 2032
- Table 93: Global Oil and Gas Downstream Industry in Nigeria Revenue Million Forecast, by Country 2019 & 2032
- Table 94: Global Oil and Gas Downstream Industry in Nigeria Volume Million Forecast, by Country 2019 & 2032
- Table 95: China Oil and Gas Downstream Industry in Nigeria Revenue (Million) Forecast, by Application 2019 & 2032
- Table 96: China Oil and Gas Downstream Industry in Nigeria Volume (Million) Forecast, by Application 2019 & 2032
- Table 97: India Oil and Gas Downstream Industry in Nigeria Revenue (Million) Forecast, by Application 2019 & 2032
- Table 98: India Oil and Gas Downstream Industry in Nigeria Volume (Million) Forecast, by Application 2019 & 2032
- Table 99: Japan Oil and Gas Downstream Industry in Nigeria Revenue (Million) Forecast, by Application 2019 & 2032
- Table 100: Japan Oil and Gas Downstream Industry in Nigeria Volume (Million) Forecast, by Application 2019 & 2032
- Table 101: South Korea Oil and Gas Downstream Industry in Nigeria Revenue (Million) Forecast, by Application 2019 & 2032
- Table 102: South Korea Oil and Gas Downstream Industry in Nigeria Volume (Million) Forecast, by Application 2019 & 2032
- Table 103: ASEAN Oil and Gas Downstream Industry in Nigeria Revenue (Million) Forecast, by Application 2019 & 2032
- Table 104: ASEAN Oil and Gas Downstream Industry in Nigeria Volume (Million) Forecast, by Application 2019 & 2032
- Table 105: Oceania Oil and Gas Downstream Industry in Nigeria Revenue (Million) Forecast, by Application 2019 & 2032
- Table 106: Oceania Oil and Gas Downstream Industry in Nigeria Volume (Million) Forecast, by Application 2019 & 2032
- Table 107: Rest of Asia Pacific Oil and Gas Downstream Industry in Nigeria Revenue (Million) Forecast, by Application 2019 & 2032
- Table 108: Rest of Asia Pacific Oil and Gas Downstream Industry in Nigeria Volume (Million) Forecast, by Application 2019 & 2032
Frequently Asked Questions
1. What is the projected Compound Annual Growth Rate (CAGR) of the Oil and Gas Downstream Industry in Nigeria?
The projected CAGR is approximately 3.50%.
2. Which companies are prominent players in the Oil and Gas Downstream Industry in Nigeria?
Key companies in the market include KBR Inc, NDEP PLC, Indorama Eleme Petrochemicals Limited, Nigerian National Petroleum Corporation, Midoil Refining & Petrochemicals Company Limited.
3. What are the main segments of the Oil and Gas Downstream Industry in Nigeria?
The market segments include Refining, Petrochemical, Retail Sales.
4. Can you provide details about the market size?
The market size is estimated to be USD XX Million as of 2022.
5. What are some drivers contributing to market growth?
4.; Rising Demand for Increaing Refinening Capacity4.; Increasing Investment in Downstream Sector.
6. What are the notable trends driving market growth?
Refining Segment Expected to Dominate the Market.
7. Are there any restraints impacting market growth?
4.; Fluctuating Price of Crude Oil May Impede the Development of the Downstream Sector.
8. Can you provide examples of recent developments in the market?
August 2022: The Nigerian National Petroleum Company announced that the Dangote Refinery is expected to start commercial operations by mid-2023. The refinery project is one of the largest in Africa, with a refining capacity of 650,000 barrels per day.
9. What pricing options are available for accessing the report?
Pricing options include single-user, multi-user, and enterprise licenses priced at USD 3800, USD 4500, and USD 5800 respectively.
10. Is the market size provided in terms of value or volume?
The market size is provided in terms of value, measured in Million and volume, measured in Million.
11. Are there any specific market keywords associated with the report?
Yes, the market keyword associated with the report is "Oil and Gas Downstream Industry in Nigeria," which aids in identifying and referencing the specific market segment covered.
12. How do I determine which pricing option suits my needs best?
The pricing options vary based on user requirements and access needs. Individual users may opt for single-user licenses, while businesses requiring broader access may choose multi-user or enterprise licenses for cost-effective access to the report.
13. Are there any additional resources or data provided in the Oil and Gas Downstream Industry in Nigeria report?
While the report offers comprehensive insights, it's advisable to review the specific contents or supplementary materials provided to ascertain if additional resources or data are available.
14. How can I stay updated on further developments or reports in the Oil and Gas Downstream Industry in Nigeria?
To stay informed about further developments, trends, and reports in the Oil and Gas Downstream Industry in Nigeria, consider subscribing to industry newsletters, following relevant companies and organizations, or regularly checking reputable industry news sources and publications.
Methodology
Step 1 - Identification of Relevant Samples Size from Population Database


Step 2 - Approaches for Defining Global Market Size (Value, Volume* & Price*)

Note*: In applicable scenarios
Step 3 - Data Sources
Primary Research
- Web Analytics
- Survey Reports
- Research Institute
- Latest Research Reports
- Opinion Leaders
Secondary Research
- Annual Reports
- White Paper
- Latest Press Release
- Industry Association
- Paid Database
- Investor Presentations

Step 4 - Data Triangulation
Involves using different sources of information in order to increase the validity of a study
These sources are likely to be stakeholders in a program - participants, other researchers, program staff, other community members, and so on.
Then we put all data in single framework & apply various statistical tools to find out the dynamic on the market.
During the analysis stage, feedback from the stakeholder groups would be compared to determine areas of agreement as well as areas of divergence


