
Key Insights
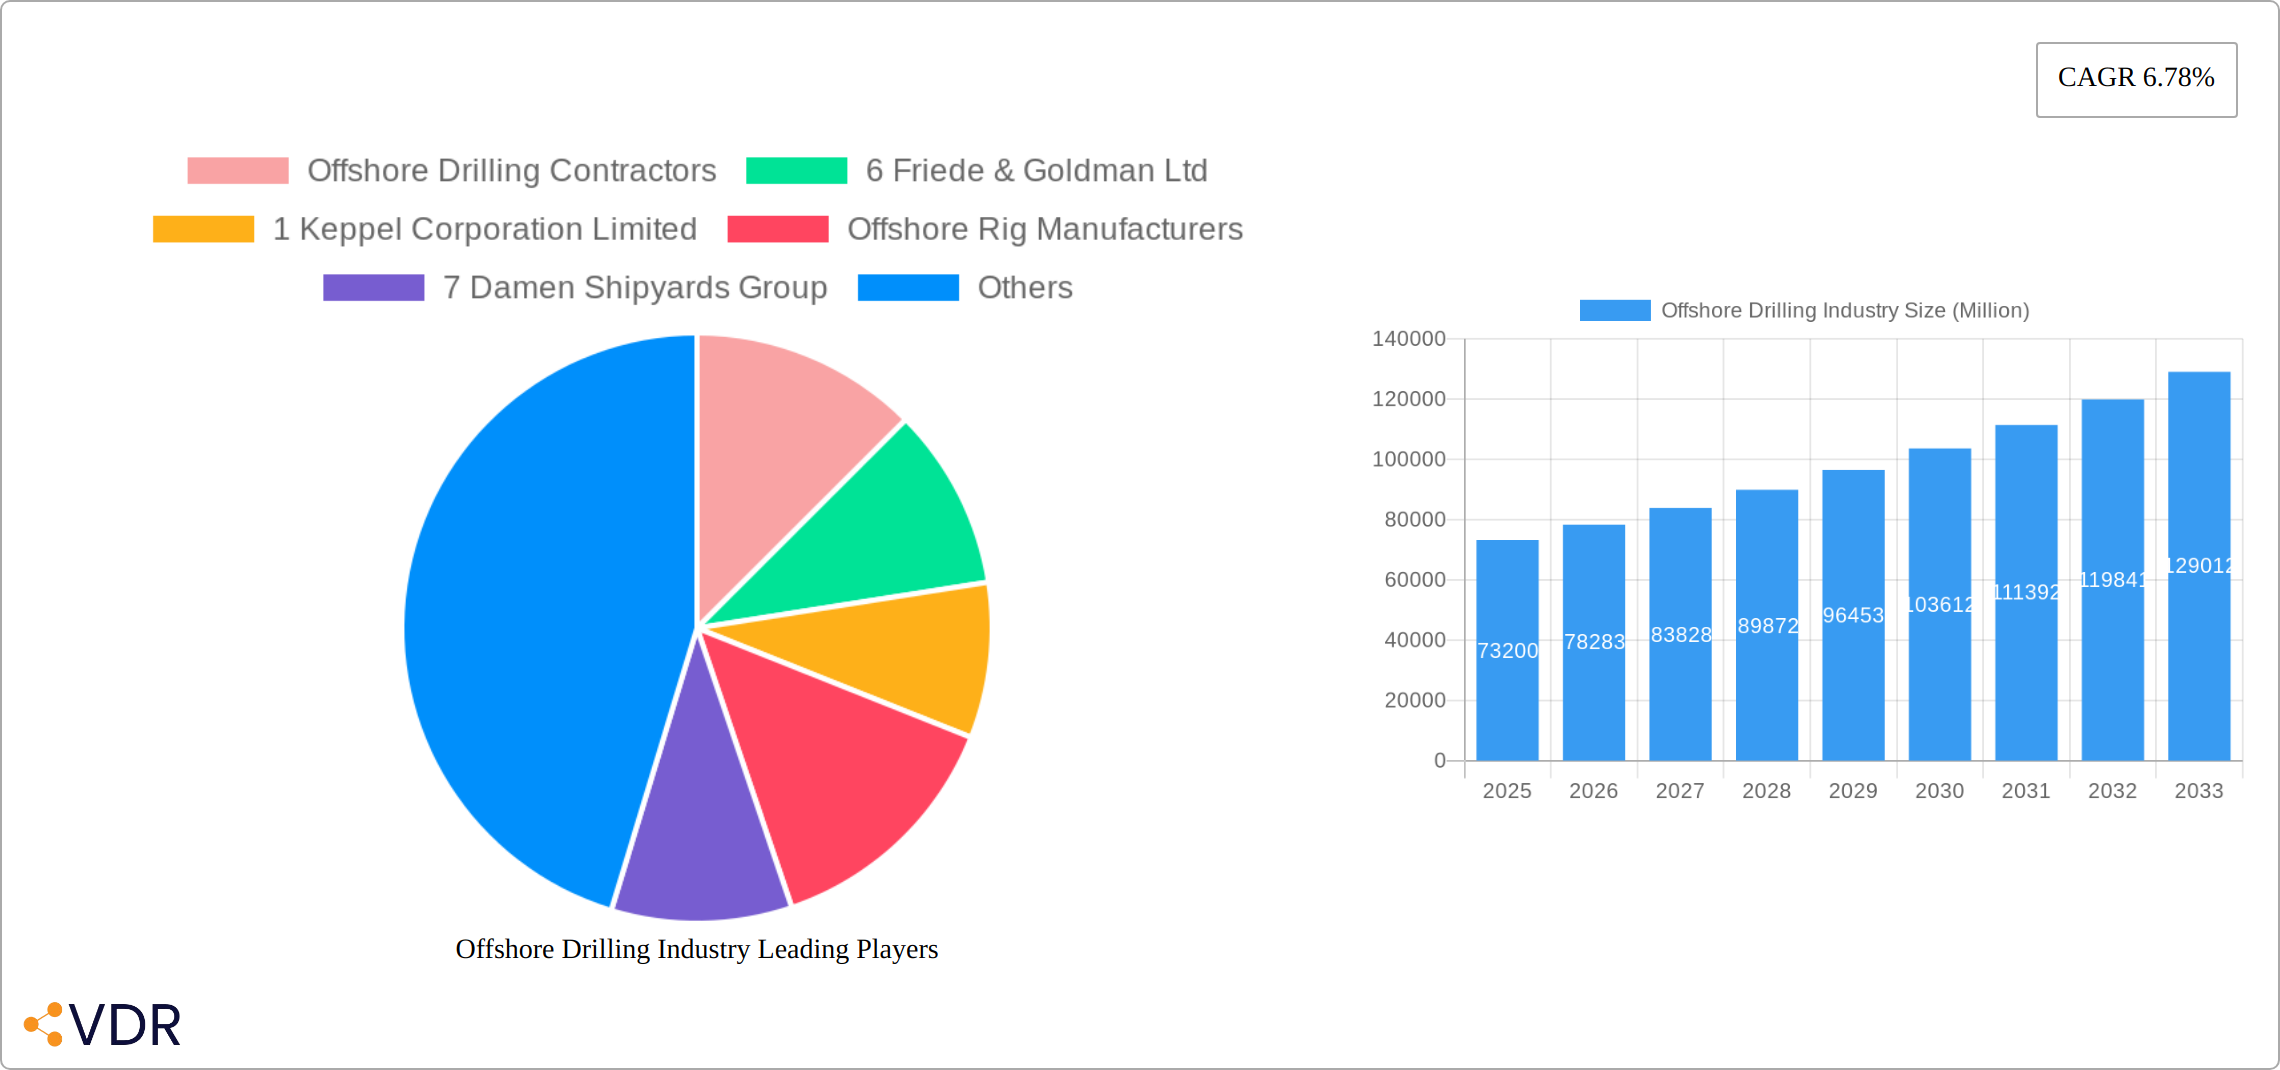
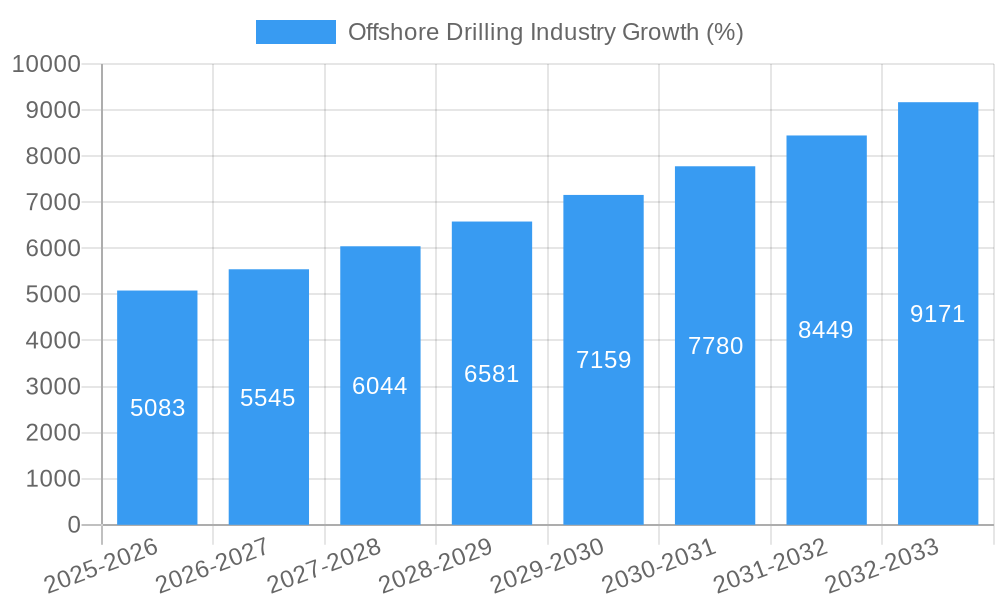
The offshore drilling industry, currently valued at $73.20 billion in 2025, is projected to experience robust growth, exhibiting a Compound Annual Growth Rate (CAGR) of 6.78% from 2025 to 2033. This expansion is driven by several factors. Increased global energy demand, particularly for oil and gas, necessitates exploration and extraction in challenging offshore environments. Technological advancements in drilling technologies, including enhanced automation and improved safety measures for deepwater and ultra-deepwater operations, are also contributing to market growth. Furthermore, the ongoing development of new offshore oil and gas reserves, coupled with government initiatives supporting energy exploration in various regions, is fueling this expansion. The industry is segmented by rig type (jackups, semisubmersibles, drillships, others), and water depth (shallow, deep, ultra-deep water), each exhibiting varying growth rates influenced by technological feasibility and exploration priorities. While challenges remain, such as environmental regulations and fluctuating oil prices, the long-term outlook for the offshore drilling market remains positive.
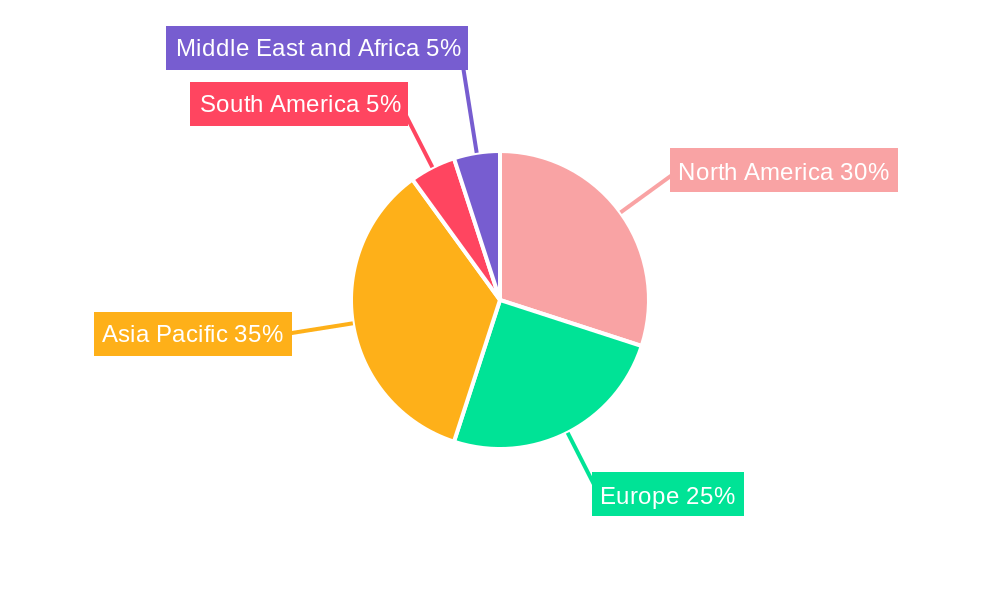
The geographic distribution of the market reveals strong growth potential across several regions. North America, particularly the United States, and the Asia-Pacific region (driven by China and India's energy demands) are expected to be key contributors to market growth. Europe, while a significant market, faces more stringent environmental regulations which may temper growth compared to other regions. The Middle East and Africa also offer substantial opportunities, but their growth is largely dependent on geopolitical stability and investment in new exploration projects. Competition among major offshore drilling contractors and rig manufacturers like Transocean, Seadrill, Diamond Offshore Drilling, Hyundai Heavy Industries, and Samsung Heavy Industries is intense, leading to continuous innovation and cost optimization strategies. The industry's future hinges on the balance between exploration activity, technological breakthroughs, and the evolving global energy landscape.
Offshore Drilling Industry Market Report: 2019-2033
This comprehensive report provides an in-depth analysis of the offshore drilling industry, encompassing market dynamics, growth trends, competitive landscape, and future outlook. The study period covers 2019-2033, with a base year of 2025 and a forecast period of 2025-2033. The report leverages extensive data and insights to offer actionable intelligence for industry professionals, investors, and stakeholders. Key segments analyzed include Jackups, Semisubmersibles, Drill Ships, and Other Types across Shallow Water, Deepwater, and Ultra-deepwater operations.
Offshore Drilling Industry Market Dynamics & Structure
The offshore drilling market is characterized by moderate concentration, with a few major players dominating the landscape. Technological innovation, primarily driven by the need for enhanced efficiency and safety in deeper waters, is a key market driver. Stringent regulatory frameworks, particularly concerning environmental protection and safety standards, significantly impact operational costs and investment decisions. The market also faces competition from alternative energy sources and technological advancements in onshore drilling. Mergers and acquisitions (M&A) activity is relatively frequent, with larger companies seeking to consolidate market share and gain access to new technologies or geographical regions.
- Market Concentration: High (xx%), driven by a few large players.
- Technological Innovation: Focus on automation, enhanced drilling technologies, and improved safety measures.
- Regulatory Framework: Stringent environmental and safety regulations increase operational costs.
- M&A Activity: xx deals in the last five years, resulting in increased market consolidation.
- Competitive Substitutes: Onshore drilling, alternative energy sources (e.g., renewable energy) creating competitive pressure.
Offshore Drilling Industry Growth Trends & Insights
The global offshore drilling market witnessed significant fluctuations during the historical period (2019-2024), largely influenced by oil price volatility and global economic conditions. However, the market is projected to experience a Compound Annual Growth Rate (CAGR) of xx% during the forecast period (2025-2033). This growth is fueled by increasing global energy demand, exploration and production activities in deeper waters, and technological advancements enabling safer and more efficient drilling operations. Market penetration of advanced drilling technologies is gradually increasing, further boosting market growth. Shifting consumer preferences towards more sustainable energy sources pose a long-term challenge to the industry. The market size is projected to reach xx Million by 2033.
Dominant Regions, Countries, or Segments in Offshore Drilling Industry
The deepwater segment, particularly in regions like the Gulf of Mexico, Brazil, and the North Sea, currently dominates the offshore drilling market. These regions benefit from significant oil and gas reserves and established infrastructure. Growth in these regions is driven by factors such as favorable government policies, supportive regulatory frameworks, and significant investments in exploration and production activities. However, the jack-up segment is experiencing strong growth in shallower water regions, driven by cost-effectiveness and suitability for specific projects.
- Key Drivers:
- Favorable government policies and tax incentives in key regions.
- Significant oil and gas reserves in deepwater areas.
- Development of advanced drilling technologies.
- Dominant Regions: Gulf of Mexico, Brazil, North Sea (Deepwater); Southeast Asia (Jackups).
- Market Share: Deepwater: xx%, Jackups: xx%, Semisubmersibles: xx%, Drill Ships: xx%.
Offshore Drilling Industry Product Landscape
The offshore drilling industry showcases a diverse product landscape featuring Jack-up rigs, Semisubmersible rigs, and Drill ships. These rigs continuously undergo technological advancements, enhancing operational efficiency, safety, and drilling capabilities in deeper waters. Recent innovations include enhanced automation systems, improved drilling technology, and better environmental protection measures, enhancing the unique selling propositions of these rigs.
Key Drivers, Barriers & Challenges in Offshore Drilling Industry
Key Drivers:
- Rising global energy demand and exploration activities in deepwater regions.
- Technological advancements enabling efficient and safer drilling operations.
- Favorable government policies and incentives in certain regions.
Challenges and Restraints:
- Oil price volatility significantly impacting investment decisions and profitability.
- Stringent environmental regulations increasing operational costs and complexity.
- Intense competition among offshore drilling contractors.
- Supply chain disruptions causing delays and cost overruns (estimated impact: xx Million annually).
Emerging Opportunities in Offshore Drilling Industry
Emerging opportunities include expanding into untapped markets, particularly in developing economies with significant offshore potential. Focus on specialized services, such as extended reach drilling and subsea drilling, offers significant potential for growth. The development of sustainable and environmentally friendly drilling technologies presents a major opportunity for differentiation and enhanced market competitiveness.
Growth Accelerators in the Offshore Drilling Industry
Technological breakthroughs in automation, remote operations, and data analytics will significantly accelerate industry growth. Strategic partnerships between drilling contractors, oil and gas companies, and technology providers are critical to fostering innovation and efficiency gains. Expanding into new geographical areas with untapped reserves will further enhance market growth.
Key Players Shaping the Offshore Drilling Industry Market
- Transocean Ltd
- Seadrill Ltd
- Diamond Offshore Drilling Inc
- Noble Drilling PLC
- ENSCO PLC
- Keppel Corporation Limited
- Damen Shipyards Group
- Sembcorp Marine Ltd
- Irving Shipbuilding Inc
- Hyundai Heavy Industries Co Ltd
- Samsung Heavy Industries Co Ltd
- Daewoo Shipbuilding & Marine Engineering Co Ltd
- Friede & Goldman Ltd
Notable Milestones in Offshore Drilling Industry Sector
- June 2023: Var Energi's long-term strategic cooperation with Halliburton for drilling services across the Norwegian Continental Shelf. This signifies a shift towards collaborative partnerships for enhanced drilling efficiency.
- June 2023: Vestigo Petroleum's USD 10.9 Million Letter of Award to Velesto Drilling for the NAGA 2 jack-up rig, highlighting ongoing demand for jack-up rigs in specific market segments.
In-Depth Offshore Drilling Industry Market Outlook
The offshore drilling industry is poised for sustained growth, driven by technological advancements, strategic partnerships, and increasing global energy demand. Strategic investments in deepwater exploration and development, coupled with a focus on sustainability and efficiency, will unlock significant opportunities for growth and profitability in the coming years. The market is expected to continue its expansion, creating a lucrative environment for established players and new entrants alike.
Offshore Drilling Industry Segmentation
-
1. Type
- 1.1. Jackups
- 1.2. Semisubmersibles
- 1.3. Drill Ships
- 1.4. Other Types
-
2. Water Depth
- 2.1. Shallow Water
- 2.2. Deepwater and Ultra-deepwater
Offshore Drilling Industry Segmentation By Geography
-
1. North America
- 1.1. United States
- 1.2. Canada
- 1.3. Rest of North America
-
2. Europe
- 2.1. United Kingdom
- 2.2. Russia
- 2.3. Norway
- 2.4. Netherlands
- 2.5. Rest of Europe
-
3. Asia Pacific
- 3.1. China
- 3.2. India
- 3.3. Australia
- 3.4. Malaysia
- 3.5. Rest of Asia Pacific
-
4. South America
- 4.1. Brazil
- 4.2. Argentina
- 4.3. Venezuela
- 4.4. Rest of South America
-
5. Middle East and Africa
- 5.1. Saudi Arabia
- 5.2. United Arab Emirates
- 5.3. Egypt
- 5.4. Nigeria
- 5.5. Rest of Middle East and Africa
Offshore Drilling Industry REPORT HIGHLIGHTS
| Aspects | Details |
|---|---|
| Study Period | 2019-2033 |
| Base Year | 2024 |
| Estimated Year | 2025 |
| Forecast Period | 2025-2033 |
| Historical Period | 2019-2024 |
| Growth Rate | CAGR of 6.78% from 2019-2033 |
| Segmentation |
|
Table of Contents
- 1. Introduction
- 1.1. Research Scope
- 1.2. Market Segmentation
- 1.3. Research Methodology
- 1.4. Definitions and Assumptions
- 2. Executive Summary
- 2.1. Introduction
- 3. Market Dynamics
- 3.1. Introduction
- 3.2. Market Drivers
- 3.2.1. 4.; Increasing Global Energy Demand4.; Exploration of Untapped Offshore Reserves
- 3.3. Market Restrains
- 3.3.1. 4.; Environmental Concerns and Regulations
- 3.4. Market Trends
- 3.4.1. Deepwater and Ultra-deepwater Segment to Witness Significant Growth
- 4. Market Factor Analysis
- 4.1. Porters Five Forces
- 4.2. Supply/Value Chain
- 4.3. PESTEL analysis
- 4.4. Market Entropy
- 4.5. Patent/Trademark Analysis
- 5. Global Offshore Drilling Industry Analysis, Insights and Forecast, 2019-2031
- 5.1. Market Analysis, Insights and Forecast - by Type
- 5.1.1. Jackups
- 5.1.2. Semisubmersibles
- 5.1.3. Drill Ships
- 5.1.4. Other Types
- 5.2. Market Analysis, Insights and Forecast - by Water Depth
- 5.2.1. Shallow Water
- 5.2.2. Deepwater and Ultra-deepwater
- 5.3. Market Analysis, Insights and Forecast - by Region
- 5.3.1. North America
- 5.3.2. Europe
- 5.3.3. Asia Pacific
- 5.3.4. South America
- 5.3.5. Middle East and Africa
- 5.1. Market Analysis, Insights and Forecast - by Type
- 6. North America Offshore Drilling Industry Analysis, Insights and Forecast, 2019-2031
- 6.1. Market Analysis, Insights and Forecast - by Type
- 6.1.1. Jackups
- 6.1.2. Semisubmersibles
- 6.1.3. Drill Ships
- 6.1.4. Other Types
- 6.2. Market Analysis, Insights and Forecast - by Water Depth
- 6.2.1. Shallow Water
- 6.2.2. Deepwater and Ultra-deepwater
- 6.1. Market Analysis, Insights and Forecast - by Type
- 7. Europe Offshore Drilling Industry Analysis, Insights and Forecast, 2019-2031
- 7.1. Market Analysis, Insights and Forecast - by Type
- 7.1.1. Jackups
- 7.1.2. Semisubmersibles
- 7.1.3. Drill Ships
- 7.1.4. Other Types
- 7.2. Market Analysis, Insights and Forecast - by Water Depth
- 7.2.1. Shallow Water
- 7.2.2. Deepwater and Ultra-deepwater
- 7.1. Market Analysis, Insights and Forecast - by Type
- 8. Asia Pacific Offshore Drilling Industry Analysis, Insights and Forecast, 2019-2031
- 8.1. Market Analysis, Insights and Forecast - by Type
- 8.1.1. Jackups
- 8.1.2. Semisubmersibles
- 8.1.3. Drill Ships
- 8.1.4. Other Types
- 8.2. Market Analysis, Insights and Forecast - by Water Depth
- 8.2.1. Shallow Water
- 8.2.2. Deepwater and Ultra-deepwater
- 8.1. Market Analysis, Insights and Forecast - by Type
- 9. South America Offshore Drilling Industry Analysis, Insights and Forecast, 2019-2031
- 9.1. Market Analysis, Insights and Forecast - by Type
- 9.1.1. Jackups
- 9.1.2. Semisubmersibles
- 9.1.3. Drill Ships
- 9.1.4. Other Types
- 9.2. Market Analysis, Insights and Forecast - by Water Depth
- 9.2.1. Shallow Water
- 9.2.2. Deepwater and Ultra-deepwater
- 9.1. Market Analysis, Insights and Forecast - by Type
- 10. Middle East and Africa Offshore Drilling Industry Analysis, Insights and Forecast, 2019-2031
- 10.1. Market Analysis, Insights and Forecast - by Type
- 10.1.1. Jackups
- 10.1.2. Semisubmersibles
- 10.1.3. Drill Ships
- 10.1.4. Other Types
- 10.2. Market Analysis, Insights and Forecast - by Water Depth
- 10.2.1. Shallow Water
- 10.2.2. Deepwater and Ultra-deepwater
- 10.1. Market Analysis, Insights and Forecast - by Type
- 11. North America Offshore Drilling Industry Analysis, Insights and Forecast, 2019-2031
- 11.1. Market Analysis, Insights and Forecast - By Country/Sub-region
- 11.1.1 United States
- 11.1.2 Canada
- 11.1.3 Rest of North America
- 12. Europe Offshore Drilling Industry Analysis, Insights and Forecast, 2019-2031
- 12.1. Market Analysis, Insights and Forecast - By Country/Sub-region
- 12.1.1 United Kingdom
- 12.1.2 Russia
- 12.1.3 Norway
- 12.1.4 Netherlands
- 12.1.5 Rest of Europe
- 13. Asia Pacific Offshore Drilling Industry Analysis, Insights and Forecast, 2019-2031
- 13.1. Market Analysis, Insights and Forecast - By Country/Sub-region
- 13.1.1 China
- 13.1.2 India
- 13.1.3 Australia
- 13.1.4 Malaysia
- 13.1.5 Rest of Asia Pacific
- 14. South America Offshore Drilling Industry Analysis, Insights and Forecast, 2019-2031
- 14.1. Market Analysis, Insights and Forecast - By Country/Sub-region
- 14.1.1 Brazil
- 14.1.2 Argentina
- 14.1.3 Venezuela
- 14.1.4 Rest of South America
- 15. Middle East and Africa Offshore Drilling Industry Analysis, Insights and Forecast, 2019-2031
- 15.1. Market Analysis, Insights and Forecast - By Country/Sub-region
- 15.1.1 Saudi Arabia
- 15.1.2 United Arab Emirates
- 15.1.3 Egypt
- 15.1.4 Nigeria
- 15.1.5 Rest of Middle East and Africa
- 16. Competitive Analysis
- 16.1. Global Market Share Analysis 2024
- 16.2. Company Profiles
- 16.2.1 Offshore Drilling Contractors
- 16.2.1.1. Overview
- 16.2.1.2. Products
- 16.2.1.3. SWOT Analysis
- 16.2.1.4. Recent Developments
- 16.2.1.5. Financials (Based on Availability)
- 16.2.2 6 Friede & Goldman Ltd
- 16.2.2.1. Overview
- 16.2.2.2. Products
- 16.2.2.3. SWOT Analysis
- 16.2.2.4. Recent Developments
- 16.2.2.5. Financials (Based on Availability)
- 16.2.3 1 Keppel Corporation Limited
- 16.2.3.1. Overview
- 16.2.3.2. Products
- 16.2.3.3. SWOT Analysis
- 16.2.3.4. Recent Developments
- 16.2.3.5. Financials (Based on Availability)
- 16.2.4 Offshore Rig Manufacturers
- 16.2.4.1. Overview
- 16.2.4.2. Products
- 16.2.4.3. SWOT Analysis
- 16.2.4.4. Recent Developments
- 16.2.4.5. Financials (Based on Availability)
- 16.2.5 7 Damen Shipyards Group
- 16.2.5.1. Overview
- 16.2.5.2. Products
- 16.2.5.3. SWOT Analysis
- 16.2.5.4. Recent Developments
- 16.2.5.5. Financials (Based on Availability)
- 16.2.6 3 Sembcorp Marine Ltd
- 16.2.6.1. Overview
- 16.2.6.2. Products
- 16.2.6.3. SWOT Analysis
- 16.2.6.4. Recent Developments
- 16.2.6.5. Financials (Based on Availability)
- 16.2.7 1 Transocean Ltd
- 16.2.7.1. Overview
- 16.2.7.2. Products
- 16.2.7.3. SWOT Analysis
- 16.2.7.4. Recent Developments
- 16.2.7.5. Financials (Based on Availability)
- 16.2.8 8 Irving Shipbuilding Inc
- 16.2.8.1. Overview
- 16.2.8.2. Products
- 16.2.8.3. SWOT Analysis
- 16.2.8.4. Recent Developments
- 16.2.8.5. Financials (Based on Availability)
- 16.2.9 5 Hyundai Heavy Industries Co Ltd
- 16.2.9.1. Overview
- 16.2.9.2. Products
- 16.2.9.3. SWOT Analysis
- 16.2.9.4. Recent Developments
- 16.2.9.5. Financials (Based on Availability)
- 16.2.10 2 Samsung Heavy Industries Co Ltd
- 16.2.10.1. Overview
- 16.2.10.2. Products
- 16.2.10.3. SWOT Analysis
- 16.2.10.4. Recent Developments
- 16.2.10.5. Financials (Based on Availability)
- 16.2.11 4 Noble Drilling PLC
- 16.2.11.1. Overview
- 16.2.11.2. Products
- 16.2.11.3. SWOT Analysis
- 16.2.11.4. Recent Developments
- 16.2.11.5. Financials (Based on Availability)
- 16.2.12 2 Seadrill Ltd
- 16.2.12.1. Overview
- 16.2.12.2. Products
- 16.2.12.3. SWOT Analysis
- 16.2.12.4. Recent Developments
- 16.2.12.5. Financials (Based on Availability)
- 16.2.13 5 Diamond Offshore Drilling Inc *List Not Exhaustive
- 16.2.13.1. Overview
- 16.2.13.2. Products
- 16.2.13.3. SWOT Analysis
- 16.2.13.4. Recent Developments
- 16.2.13.5. Financials (Based on Availability)
- 16.2.14 3 ENSCO PLC
- 16.2.14.1. Overview
- 16.2.14.2. Products
- 16.2.14.3. SWOT Analysis
- 16.2.14.4. Recent Developments
- 16.2.14.5. Financials (Based on Availability)
- 16.2.15 4 Daewoo Shipbuilding & Marine Engineering Co Ltd
- 16.2.15.1. Overview
- 16.2.15.2. Products
- 16.2.15.3. SWOT Analysis
- 16.2.15.4. Recent Developments
- 16.2.15.5. Financials (Based on Availability)
- 16.2.1 Offshore Drilling Contractors
List of Figures
- Figure 1: Global Offshore Drilling Industry Revenue Breakdown (Million, %) by Region 2024 & 2032
- Figure 2: North America Offshore Drilling Industry Revenue (Million), by Country 2024 & 2032
- Figure 3: North America Offshore Drilling Industry Revenue Share (%), by Country 2024 & 2032
- Figure 4: Europe Offshore Drilling Industry Revenue (Million), by Country 2024 & 2032
- Figure 5: Europe Offshore Drilling Industry Revenue Share (%), by Country 2024 & 2032
- Figure 6: Asia Pacific Offshore Drilling Industry Revenue (Million), by Country 2024 & 2032
- Figure 7: Asia Pacific Offshore Drilling Industry Revenue Share (%), by Country 2024 & 2032
- Figure 8: South America Offshore Drilling Industry Revenue (Million), by Country 2024 & 2032
- Figure 9: South America Offshore Drilling Industry Revenue Share (%), by Country 2024 & 2032
- Figure 10: Middle East and Africa Offshore Drilling Industry Revenue (Million), by Country 2024 & 2032
- Figure 11: Middle East and Africa Offshore Drilling Industry Revenue Share (%), by Country 2024 & 2032
- Figure 12: North America Offshore Drilling Industry Revenue (Million), by Type 2024 & 2032
- Figure 13: North America Offshore Drilling Industry Revenue Share (%), by Type 2024 & 2032
- Figure 14: North America Offshore Drilling Industry Revenue (Million), by Water Depth 2024 & 2032
- Figure 15: North America Offshore Drilling Industry Revenue Share (%), by Water Depth 2024 & 2032
- Figure 16: North America Offshore Drilling Industry Revenue (Million), by Country 2024 & 2032
- Figure 17: North America Offshore Drilling Industry Revenue Share (%), by Country 2024 & 2032
- Figure 18: Europe Offshore Drilling Industry Revenue (Million), by Type 2024 & 2032
- Figure 19: Europe Offshore Drilling Industry Revenue Share (%), by Type 2024 & 2032
- Figure 20: Europe Offshore Drilling Industry Revenue (Million), by Water Depth 2024 & 2032
- Figure 21: Europe Offshore Drilling Industry Revenue Share (%), by Water Depth 2024 & 2032
- Figure 22: Europe Offshore Drilling Industry Revenue (Million), by Country 2024 & 2032
- Figure 23: Europe Offshore Drilling Industry Revenue Share (%), by Country 2024 & 2032
- Figure 24: Asia Pacific Offshore Drilling Industry Revenue (Million), by Type 2024 & 2032
- Figure 25: Asia Pacific Offshore Drilling Industry Revenue Share (%), by Type 2024 & 2032
- Figure 26: Asia Pacific Offshore Drilling Industry Revenue (Million), by Water Depth 2024 & 2032
- Figure 27: Asia Pacific Offshore Drilling Industry Revenue Share (%), by Water Depth 2024 & 2032
- Figure 28: Asia Pacific Offshore Drilling Industry Revenue (Million), by Country 2024 & 2032
- Figure 29: Asia Pacific Offshore Drilling Industry Revenue Share (%), by Country 2024 & 2032
- Figure 30: South America Offshore Drilling Industry Revenue (Million), by Type 2024 & 2032
- Figure 31: South America Offshore Drilling Industry Revenue Share (%), by Type 2024 & 2032
- Figure 32: South America Offshore Drilling Industry Revenue (Million), by Water Depth 2024 & 2032
- Figure 33: South America Offshore Drilling Industry Revenue Share (%), by Water Depth 2024 & 2032
- Figure 34: South America Offshore Drilling Industry Revenue (Million), by Country 2024 & 2032
- Figure 35: South America Offshore Drilling Industry Revenue Share (%), by Country 2024 & 2032
- Figure 36: Middle East and Africa Offshore Drilling Industry Revenue (Million), by Type 2024 & 2032
- Figure 37: Middle East and Africa Offshore Drilling Industry Revenue Share (%), by Type 2024 & 2032
- Figure 38: Middle East and Africa Offshore Drilling Industry Revenue (Million), by Water Depth 2024 & 2032
- Figure 39: Middle East and Africa Offshore Drilling Industry Revenue Share (%), by Water Depth 2024 & 2032
- Figure 40: Middle East and Africa Offshore Drilling Industry Revenue (Million), by Country 2024 & 2032
- Figure 41: Middle East and Africa Offshore Drilling Industry Revenue Share (%), by Country 2024 & 2032
List of Tables
- Table 1: Global Offshore Drilling Industry Revenue Million Forecast, by Region 2019 & 2032
- Table 2: Global Offshore Drilling Industry Revenue Million Forecast, by Type 2019 & 2032
- Table 3: Global Offshore Drilling Industry Revenue Million Forecast, by Water Depth 2019 & 2032
- Table 4: Global Offshore Drilling Industry Revenue Million Forecast, by Region 2019 & 2032
- Table 5: Global Offshore Drilling Industry Revenue Million Forecast, by Country 2019 & 2032
- Table 6: United States Offshore Drilling Industry Revenue (Million) Forecast, by Application 2019 & 2032
- Table 7: Canada Offshore Drilling Industry Revenue (Million) Forecast, by Application 2019 & 2032
- Table 8: Rest of North America Offshore Drilling Industry Revenue (Million) Forecast, by Application 2019 & 2032
- Table 9: Global Offshore Drilling Industry Revenue Million Forecast, by Country 2019 & 2032
- Table 10: United Kingdom Offshore Drilling Industry Revenue (Million) Forecast, by Application 2019 & 2032
- Table 11: Russia Offshore Drilling Industry Revenue (Million) Forecast, by Application 2019 & 2032
- Table 12: Norway Offshore Drilling Industry Revenue (Million) Forecast, by Application 2019 & 2032
- Table 13: Netherlands Offshore Drilling Industry Revenue (Million) Forecast, by Application 2019 & 2032
- Table 14: Rest of Europe Offshore Drilling Industry Revenue (Million) Forecast, by Application 2019 & 2032
- Table 15: Global Offshore Drilling Industry Revenue Million Forecast, by Country 2019 & 2032
- Table 16: China Offshore Drilling Industry Revenue (Million) Forecast, by Application 2019 & 2032
- Table 17: India Offshore Drilling Industry Revenue (Million) Forecast, by Application 2019 & 2032
- Table 18: Australia Offshore Drilling Industry Revenue (Million) Forecast, by Application 2019 & 2032
- Table 19: Malaysia Offshore Drilling Industry Revenue (Million) Forecast, by Application 2019 & 2032
- Table 20: Rest of Asia Pacific Offshore Drilling Industry Revenue (Million) Forecast, by Application 2019 & 2032
- Table 21: Global Offshore Drilling Industry Revenue Million Forecast, by Country 2019 & 2032
- Table 22: Brazil Offshore Drilling Industry Revenue (Million) Forecast, by Application 2019 & 2032
- Table 23: Argentina Offshore Drilling Industry Revenue (Million) Forecast, by Application 2019 & 2032
- Table 24: Venezuela Offshore Drilling Industry Revenue (Million) Forecast, by Application 2019 & 2032
- Table 25: Rest of South America Offshore Drilling Industry Revenue (Million) Forecast, by Application 2019 & 2032
- Table 26: Global Offshore Drilling Industry Revenue Million Forecast, by Country 2019 & 2032
- Table 27: Saudi Arabia Offshore Drilling Industry Revenue (Million) Forecast, by Application 2019 & 2032
- Table 28: United Arab Emirates Offshore Drilling Industry Revenue (Million) Forecast, by Application 2019 & 2032
- Table 29: Egypt Offshore Drilling Industry Revenue (Million) Forecast, by Application 2019 & 2032
- Table 30: Nigeria Offshore Drilling Industry Revenue (Million) Forecast, by Application 2019 & 2032
- Table 31: Rest of Middle East and Africa Offshore Drilling Industry Revenue (Million) Forecast, by Application 2019 & 2032
- Table 32: Global Offshore Drilling Industry Revenue Million Forecast, by Type 2019 & 2032
- Table 33: Global Offshore Drilling Industry Revenue Million Forecast, by Water Depth 2019 & 2032
- Table 34: Global Offshore Drilling Industry Revenue Million Forecast, by Country 2019 & 2032
- Table 35: United States Offshore Drilling Industry Revenue (Million) Forecast, by Application 2019 & 2032
- Table 36: Canada Offshore Drilling Industry Revenue (Million) Forecast, by Application 2019 & 2032
- Table 37: Rest of North America Offshore Drilling Industry Revenue (Million) Forecast, by Application 2019 & 2032
- Table 38: Global Offshore Drilling Industry Revenue Million Forecast, by Type 2019 & 2032
- Table 39: Global Offshore Drilling Industry Revenue Million Forecast, by Water Depth 2019 & 2032
- Table 40: Global Offshore Drilling Industry Revenue Million Forecast, by Country 2019 & 2032
- Table 41: United Kingdom Offshore Drilling Industry Revenue (Million) Forecast, by Application 2019 & 2032
- Table 42: Russia Offshore Drilling Industry Revenue (Million) Forecast, by Application 2019 & 2032
- Table 43: Norway Offshore Drilling Industry Revenue (Million) Forecast, by Application 2019 & 2032
- Table 44: Netherlands Offshore Drilling Industry Revenue (Million) Forecast, by Application 2019 & 2032
- Table 45: Rest of Europe Offshore Drilling Industry Revenue (Million) Forecast, by Application 2019 & 2032
- Table 46: Global Offshore Drilling Industry Revenue Million Forecast, by Type 2019 & 2032
- Table 47: Global Offshore Drilling Industry Revenue Million Forecast, by Water Depth 2019 & 2032
- Table 48: Global Offshore Drilling Industry Revenue Million Forecast, by Country 2019 & 2032
- Table 49: China Offshore Drilling Industry Revenue (Million) Forecast, by Application 2019 & 2032
- Table 50: India Offshore Drilling Industry Revenue (Million) Forecast, by Application 2019 & 2032
- Table 51: Australia Offshore Drilling Industry Revenue (Million) Forecast, by Application 2019 & 2032
- Table 52: Malaysia Offshore Drilling Industry Revenue (Million) Forecast, by Application 2019 & 2032
- Table 53: Rest of Asia Pacific Offshore Drilling Industry Revenue (Million) Forecast, by Application 2019 & 2032
- Table 54: Global Offshore Drilling Industry Revenue Million Forecast, by Type 2019 & 2032
- Table 55: Global Offshore Drilling Industry Revenue Million Forecast, by Water Depth 2019 & 2032
- Table 56: Global Offshore Drilling Industry Revenue Million Forecast, by Country 2019 & 2032
- Table 57: Brazil Offshore Drilling Industry Revenue (Million) Forecast, by Application 2019 & 2032
- Table 58: Argentina Offshore Drilling Industry Revenue (Million) Forecast, by Application 2019 & 2032
- Table 59: Venezuela Offshore Drilling Industry Revenue (Million) Forecast, by Application 2019 & 2032
- Table 60: Rest of South America Offshore Drilling Industry Revenue (Million) Forecast, by Application 2019 & 2032
- Table 61: Global Offshore Drilling Industry Revenue Million Forecast, by Type 2019 & 2032
- Table 62: Global Offshore Drilling Industry Revenue Million Forecast, by Water Depth 2019 & 2032
- Table 63: Global Offshore Drilling Industry Revenue Million Forecast, by Country 2019 & 2032
- Table 64: Saudi Arabia Offshore Drilling Industry Revenue (Million) Forecast, by Application 2019 & 2032
- Table 65: United Arab Emirates Offshore Drilling Industry Revenue (Million) Forecast, by Application 2019 & 2032
- Table 66: Egypt Offshore Drilling Industry Revenue (Million) Forecast, by Application 2019 & 2032
- Table 67: Nigeria Offshore Drilling Industry Revenue (Million) Forecast, by Application 2019 & 2032
- Table 68: Rest of Middle East and Africa Offshore Drilling Industry Revenue (Million) Forecast, by Application 2019 & 2032
Frequently Asked Questions
1. What is the projected Compound Annual Growth Rate (CAGR) of the Offshore Drilling Industry?
The projected CAGR is approximately 6.78%.
2. Which companies are prominent players in the Offshore Drilling Industry?
Key companies in the market include Offshore Drilling Contractors, 6 Friede & Goldman Ltd, 1 Keppel Corporation Limited, Offshore Rig Manufacturers, 7 Damen Shipyards Group, 3 Sembcorp Marine Ltd, 1 Transocean Ltd, 8 Irving Shipbuilding Inc, 5 Hyundai Heavy Industries Co Ltd, 2 Samsung Heavy Industries Co Ltd, 4 Noble Drilling PLC, 2 Seadrill Ltd, 5 Diamond Offshore Drilling Inc *List Not Exhaustive, 3 ENSCO PLC, 4 Daewoo Shipbuilding & Marine Engineering Co Ltd.
3. What are the main segments of the Offshore Drilling Industry?
The market segments include Type, Water Depth.
4. Can you provide details about the market size?
The market size is estimated to be USD 73.20 Million as of 2022.
5. What are some drivers contributing to market growth?
4.; Increasing Global Energy Demand4.; Exploration of Untapped Offshore Reserves.
6. What are the notable trends driving market growth?
Deepwater and Ultra-deepwater Segment to Witness Significant Growth.
7. Are there any restraints impacting market growth?
4.; Environmental Concerns and Regulations.
8. Can you provide examples of recent developments in the market?
June 2023: Var Energi, a Norwegian offshore oil and gas producer, announced a long-term strategic cooperation with Halliburton, a US oilfield services firm, for drilling services to improve drilling and well performance and increase value creation. The partnership includes drilling services for Var Energi relating to exploration and production drilling across the Norwegian Continental Shelf. The contract is for five years with an option for an extra four years.
9. What pricing options are available for accessing the report?
Pricing options include single-user, multi-user, and enterprise licenses priced at USD 4750, USD 5250, and USD 8750 respectively.
10. Is the market size provided in terms of value or volume?
The market size is provided in terms of value, measured in Million.
11. Are there any specific market keywords associated with the report?
Yes, the market keyword associated with the report is "Offshore Drilling Industry," which aids in identifying and referencing the specific market segment covered.
12. How do I determine which pricing option suits my needs best?
The pricing options vary based on user requirements and access needs. Individual users may opt for single-user licenses, while businesses requiring broader access may choose multi-user or enterprise licenses for cost-effective access to the report.
13. Are there any additional resources or data provided in the Offshore Drilling Industry report?
While the report offers comprehensive insights, it's advisable to review the specific contents or supplementary materials provided to ascertain if additional resources or data are available.
14. How can I stay updated on further developments or reports in the Offshore Drilling Industry?
To stay informed about further developments, trends, and reports in the Offshore Drilling Industry, consider subscribing to industry newsletters, following relevant companies and organizations, or regularly checking reputable industry news sources and publications.
Methodology
Step 1 - Identification of Relevant Samples Size from Population Database


Step 2 - Approaches for Defining Global Market Size (Value, Volume* & Price*)

Note*: In applicable scenarios
Step 3 - Data Sources
Primary Research
- Web Analytics
- Survey Reports
- Research Institute
- Latest Research Reports
- Opinion Leaders
Secondary Research
- Annual Reports
- White Paper
- Latest Press Release
- Industry Association
- Paid Database
- Investor Presentations

Step 4 - Data Triangulation
Involves using different sources of information in order to increase the validity of a study
These sources are likely to be stakeholders in a program - participants, other researchers, program staff, other community members, and so on.
Then we put all data in single framework & apply various statistical tools to find out the dynamic on the market.
During the analysis stage, feedback from the stakeholder groups would be compared to determine areas of agreement as well as areas of divergence


