
Key Insights
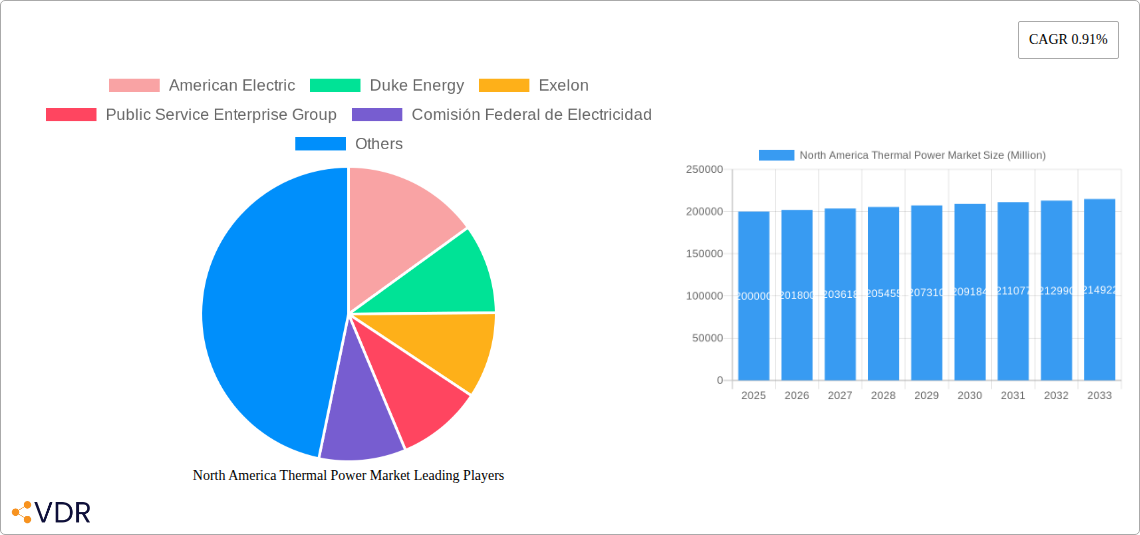
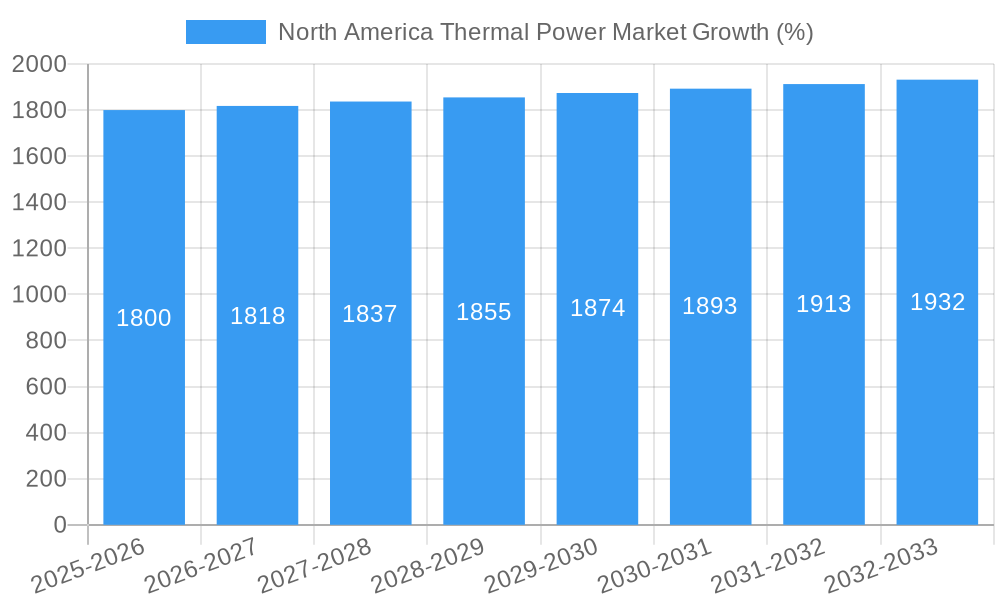
The North America thermal power market, encompassing coal, gas, nuclear, and other fuel types, is a mature yet dynamic sector exhibiting moderate growth. While the provided CAGR of 0.91% suggests a relatively slow expansion from 2019-2033, a deeper analysis reveals nuanced trends within the market segments. The increasing emphasis on environmental regulations and the transition towards renewable energy sources are significant restraints, particularly impacting the coal segment, which is likely experiencing a decline. Conversely, the natural gas segment is anticipated to maintain a relatively stable position due to its role as a transitional fuel source in the energy transition. The nuclear power segment, while facing challenges related to plant aging and licensing, might experience modest growth due to its carbon-free nature and potential role in grid stabilization. The "other fuel types" category, encompassing emerging technologies and biofuels, may exhibit higher growth rates compared to traditional sources, driven by technological advancements and government incentives. Major players like American Electric, Duke Energy, and Exelon, along with regional variations across the United States, Canada, and Mexico, further shape market dynamics. The market size in 2025 is estimated based on the 0.91% CAGR, and taking into account the likely declines in coal and the steady performance of gas. Accurate sizing requires access to more detailed revenue data.
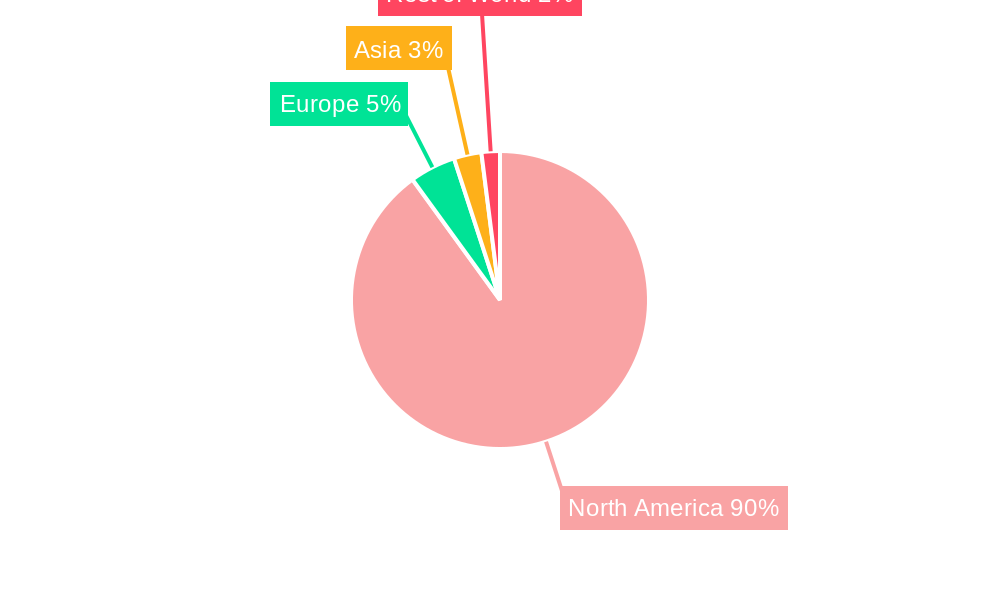
Considering the geographic distribution, the United States constitutes the largest portion of the North American thermal power market due to its extensive energy infrastructure and high energy consumption. Canada and Mexico contribute smaller, though still significant, shares. Growth in the region will be driven by factors such as increasing electricity demand, particularly in certain high-growth sectors. However, regulatory hurdles, including stricter emission standards and permitting processes, could impede expansion. The competition among established players is intense, fostering a focus on operational efficiency and strategic investments in modernizing existing facilities and exploring diverse fuel sources to enhance profitability and sustainability. The forecast period (2025-2033) will be defined by a gradual shift in fuel mix, with gas retaining importance while renewable energy continues its ascendancy.
North America Thermal Power Market: A Comprehensive Report (2019-2033)
This in-depth report provides a comprehensive analysis of the North America thermal power market, encompassing market dynamics, growth trends, key players, and future outlook. With a focus on the parent market of North American Energy and the child market of Thermal Power Generation, this report is an essential resource for industry professionals, investors, and policymakers seeking actionable insights into this dynamic sector. The study period covers 2019-2033, with 2025 as the base and estimated year. The market size is presented in Million units.
North America Thermal Power Market Market Dynamics & Structure
The North America thermal power market is characterized by moderate concentration, with a handful of major players holding significant market share. Technological innovation, primarily driven by efficiency improvements and emissions reduction technologies, is a key driver. Stringent environmental regulations, including carbon emission limits and air quality standards, heavily influence market dynamics. The market also faces competition from renewable energy sources, particularly solar and wind power. End-user demographics are largely driven by industrial and residential electricity demand, with variations across regions. M&A activity has been significant, reflecting consolidation and strategic expansion within the sector.
- Market Concentration: High, with the top 10 players accounting for approximately xx% of the market share in 2025.
- Technological Innovation: Focus on higher efficiency turbines, carbon capture technologies, and hydrogen fuel integration.
- Regulatory Framework: Stringent environmental regulations drive the adoption of cleaner technologies.
- Competitive Product Substitutes: Growing competition from renewable energy sources (Solar, Wind).
- M&A Activity: xx major transactions recorded between 2019 and 2024, resulting in a xx% increase in market consolidation.
- Innovation Barriers: High capital investment requirements and technological complexities hinder innovation.
North America Thermal Power Market Growth Trends & Insights
The North America thermal power market experienced a compound annual growth rate (CAGR) of xx% during the historical period (2019-2024), reaching a market size of xx Million units in 2024. This growth was primarily driven by increasing energy demand, particularly in the industrial and commercial sectors. However, the market is expected to witness a moderated CAGR of xx% during the forecast period (2025-2033), influenced by the increasing adoption of renewable energy sources and stricter environmental regulations. Technological disruptions, such as advancements in hydrogen fuel technology and carbon capture utilization and storage (CCUS), will significantly shape market growth trajectories. Consumer behavior shifts toward sustainability are also impacting market dynamics. Market penetration of cleaner thermal technologies is expected to increase from xx% in 2025 to xx% by 2033.
Dominant Regions, Countries, or Segments in North America Thermal Power Market
The United States dominates the North America thermal power market, accounting for the largest share of installed capacity and electricity generation. Within the United States, Texas, California, and Florida are leading states, driven by high energy demand and existing infrastructure. In terms of fuel type, natural gas currently holds the largest market share, followed by coal and nuclear. The market share of other fuel types, including biomass and geothermal, remains relatively small. However, the shift towards cleaner energy sources is expected to drive growth in renewable-integrated gas turbines.
- Key Drivers (US): Strong industrial activity, expanding population, and robust infrastructure.
- Key Drivers (Gas Segment): Relatively lower cost compared to other fuel types, readily available infrastructure.
- Growth Potential: The shift towards cleaner fuel options and integrated solutions will be a significant growth driver.
North America Thermal Power Market Product Landscape
The North America thermal power market offers a diverse range of products, including gas turbines, steam turbines, and combined cycle power plants. Innovation focuses on enhancing efficiency, reducing emissions, and integrating renewable energy sources. The integration of green hydrogen into existing gas turbine infrastructure is becoming a key focus. Products are differentiated based on fuel type, efficiency levels, emission control technologies, and digital capabilities for remote monitoring and predictive maintenance. These advancements offer unique selling propositions by enabling improved operational flexibility, reduced environmental impact, and optimized performance.
Key Drivers, Barriers & Challenges in North America Thermal Power Market
Key Drivers:
- Increasing energy demand from growing industrial and residential sectors.
- Investments in modernization and efficiency upgrades of existing power plants.
- Government incentives and policies promoting cleaner energy technologies.
Challenges & Restraints:
- Stringent environmental regulations and carbon emission reduction targets.
- High capital investment required for new power plants and technology upgrades.
- Competition from renewable energy sources, impacting profitability.
- Supply chain disruptions impacting the availability of components and materials. This has led to a xx% increase in project delays since 2021.
Emerging Opportunities in North America Thermal Power Market
- Growth in combined cycle power plants integrating renewable energy sources.
- Expansion of green hydrogen production and utilization in thermal power generation.
- Advanced digital technologies for improved grid management and plant optimization.
- Development of small-scale, decentralized thermal power solutions for remote locations.
Growth Accelerators in the North America Thermal Power Market Industry
Technological advancements, particularly in CCUS and hydrogen integration, are accelerating market growth. Strategic partnerships between thermal power companies and technology providers are driving innovation and deployment. Government policies supportive of clean energy transition, along with market expansion strategies by major players, contribute to the market’s positive outlook.
Key Players Shaping the North America Thermal Power Market Market
- American Electric Power
- Duke Energy
- Exelon
- Public Service Enterprise Group
- Comisión Federal de Electricidad
- Consolidated Edison
- Dominion Energy
- Xcel Energy
- Southern Company
- NextEra Energy
Notable Milestones in North America Thermal Power Market Sector
- November 2023: GE Vernova supports Duke Energy's green hydrogen system at the DeBary plant, signifying a pivotal shift toward cleaner power generation.
- November 2022: Eight new natural gas-fired CCGT plants added 7,775 MW to the US grid, demonstrating ongoing investment despite renewable energy growth.
- May 2022: JERA Americas acquires 1.63 GW of thermal power generation assets in Massachusetts and Maine, indicating consolidation within the sector.
In-Depth North America Thermal Power Market Market Outlook
The North America thermal power market is poised for continued growth, albeit at a moderated pace. The focus on decarbonization and cleaner energy sources will drive innovation and investment in advanced technologies. Strategic partnerships, regulatory support, and the increasing demand for reliable baseload power generation will present significant opportunities for market expansion and profitability. The transition to a cleaner energy mix will involve a combination of continued use of thermal power plants equipped with emissions reduction technologies, along with an increase in renewable energy sources.
North America Thermal Power Market Segmentation
-
1. Fuel Type
- 1.1. Coal
- 1.2. Gas
- 1.3. Nuclear
- 1.4. Other Fuel Types
-
2. Geography
- 2.1. United States
- 2.2. Canada
- 2.3. Mexico
North America Thermal Power Market Segmentation By Geography
- 1. United States
- 2. Canada
- 3. Mexico
North America Thermal Power Market REPORT HIGHLIGHTS
| Aspects | Details |
|---|---|
| Study Period | 2019-2033 |
| Base Year | 2024 |
| Estimated Year | 2025 |
| Forecast Period | 2025-2033 |
| Historical Period | 2019-2024 |
| Growth Rate | CAGR of 0.91% from 2019-2033 |
| Segmentation |
|
Table of Contents
- 1. Introduction
- 1.1. Research Scope
- 1.2. Market Segmentation
- 1.3. Research Methodology
- 1.4. Definitions and Assumptions
- 2. Executive Summary
- 2.1. Introduction
- 3. Market Dynamics
- 3.1. Introduction
- 3.2. Market Drivers
- 3.2.1. 4.; Increasing Investments in Thermal Power Plants
- 3.3. Market Restrains
- 3.3.1. 4.; Increase in Renewable Energy Share in the Total Power Generation Mix
- 3.4. Market Trends
- 3.4.1. Natural Gas to Dominate the Market
- 4. Market Factor Analysis
- 4.1. Porters Five Forces
- 4.2. Supply/Value Chain
- 4.3. PESTEL analysis
- 4.4. Market Entropy
- 4.5. Patent/Trademark Analysis
- 5. North America Thermal Power Market Analysis, Insights and Forecast, 2019-2031
- 5.1. Market Analysis, Insights and Forecast - by Fuel Type
- 5.1.1. Coal
- 5.1.2. Gas
- 5.1.3. Nuclear
- 5.1.4. Other Fuel Types
- 5.2. Market Analysis, Insights and Forecast - by Geography
- 5.2.1. United States
- 5.2.2. Canada
- 5.2.3. Mexico
- 5.3. Market Analysis, Insights and Forecast - by Region
- 5.3.1. United States
- 5.3.2. Canada
- 5.3.3. Mexico
- 5.1. Market Analysis, Insights and Forecast - by Fuel Type
- 6. United States North America Thermal Power Market Analysis, Insights and Forecast, 2019-2031
- 6.1. Market Analysis, Insights and Forecast - by Fuel Type
- 6.1.1. Coal
- 6.1.2. Gas
- 6.1.3. Nuclear
- 6.1.4. Other Fuel Types
- 6.2. Market Analysis, Insights and Forecast - by Geography
- 6.2.1. United States
- 6.2.2. Canada
- 6.2.3. Mexico
- 6.1. Market Analysis, Insights and Forecast - by Fuel Type
- 7. Canada North America Thermal Power Market Analysis, Insights and Forecast, 2019-2031
- 7.1. Market Analysis, Insights and Forecast - by Fuel Type
- 7.1.1. Coal
- 7.1.2. Gas
- 7.1.3. Nuclear
- 7.1.4. Other Fuel Types
- 7.2. Market Analysis, Insights and Forecast - by Geography
- 7.2.1. United States
- 7.2.2. Canada
- 7.2.3. Mexico
- 7.1. Market Analysis, Insights and Forecast - by Fuel Type
- 8. Mexico North America Thermal Power Market Analysis, Insights and Forecast, 2019-2031
- 8.1. Market Analysis, Insights and Forecast - by Fuel Type
- 8.1.1. Coal
- 8.1.2. Gas
- 8.1.3. Nuclear
- 8.1.4. Other Fuel Types
- 8.2. Market Analysis, Insights and Forecast - by Geography
- 8.2.1. United States
- 8.2.2. Canada
- 8.2.3. Mexico
- 8.1. Market Analysis, Insights and Forecast - by Fuel Type
- 9. United States North America Thermal Power Market Analysis, Insights and Forecast, 2019-2031
- 10. Canada North America Thermal Power Market Analysis, Insights and Forecast, 2019-2031
- 11. Mexico North America Thermal Power Market Analysis, Insights and Forecast, 2019-2031
- 12. Rest of North America North America Thermal Power Market Analysis, Insights and Forecast, 2019-2031
- 13. Competitive Analysis
- 13.1. Market Share Analysis 2024
- 13.2. Company Profiles
- 13.2.1 American Electric
- 13.2.1.1. Overview
- 13.2.1.2. Products
- 13.2.1.3. SWOT Analysis
- 13.2.1.4. Recent Developments
- 13.2.1.5. Financials (Based on Availability)
- 13.2.2 Duke Energy
- 13.2.2.1. Overview
- 13.2.2.2. Products
- 13.2.2.3. SWOT Analysis
- 13.2.2.4. Recent Developments
- 13.2.2.5. Financials (Based on Availability)
- 13.2.3 Exelon
- 13.2.3.1. Overview
- 13.2.3.2. Products
- 13.2.3.3. SWOT Analysis
- 13.2.3.4. Recent Developments
- 13.2.3.5. Financials (Based on Availability)
- 13.2.4 Public Service Enterprise Group
- 13.2.4.1. Overview
- 13.2.4.2. Products
- 13.2.4.3. SWOT Analysis
- 13.2.4.4. Recent Developments
- 13.2.4.5. Financials (Based on Availability)
- 13.2.5 Comisión Federal de Electricidad
- 13.2.5.1. Overview
- 13.2.5.2. Products
- 13.2.5.3. SWOT Analysis
- 13.2.5.4. Recent Developments
- 13.2.5.5. Financials (Based on Availability)
- 13.2.6 Consolidated Edison
- 13.2.6.1. Overview
- 13.2.6.2. Products
- 13.2.6.3. SWOT Analysis
- 13.2.6.4. Recent Developments
- 13.2.6.5. Financials (Based on Availability)
- 13.2.7 Dominion Energy
- 13.2.7.1. Overview
- 13.2.7.2. Products
- 13.2.7.3. SWOT Analysis
- 13.2.7.4. Recent Developments
- 13.2.7.5. Financials (Based on Availability)
- 13.2.8 Xcel Energy
- 13.2.8.1. Overview
- 13.2.8.2. Products
- 13.2.8.3. SWOT Analysis
- 13.2.8.4. Recent Developments
- 13.2.8.5. Financials (Based on Availability)
- 13.2.9 Southern Company
- 13.2.9.1. Overview
- 13.2.9.2. Products
- 13.2.9.3. SWOT Analysis
- 13.2.9.4. Recent Developments
- 13.2.9.5. Financials (Based on Availability)
- 13.2.10 NextEra Energy
- 13.2.10.1. Overview
- 13.2.10.2. Products
- 13.2.10.3. SWOT Analysis
- 13.2.10.4. Recent Developments
- 13.2.10.5. Financials (Based on Availability)
- 13.2.1 American Electric
List of Figures
- Figure 1: North America Thermal Power Market Revenue Breakdown (Million, %) by Product 2024 & 2032
- Figure 2: North America Thermal Power Market Share (%) by Company 2024
List of Tables
- Table 1: North America Thermal Power Market Revenue Million Forecast, by Region 2019 & 2032
- Table 2: North America Thermal Power Market Volume gigawatt Forecast, by Region 2019 & 2032
- Table 3: North America Thermal Power Market Revenue Million Forecast, by Fuel Type 2019 & 2032
- Table 4: North America Thermal Power Market Volume gigawatt Forecast, by Fuel Type 2019 & 2032
- Table 5: North America Thermal Power Market Revenue Million Forecast, by Geography 2019 & 2032
- Table 6: North America Thermal Power Market Volume gigawatt Forecast, by Geography 2019 & 2032
- Table 7: North America Thermal Power Market Revenue Million Forecast, by Region 2019 & 2032
- Table 8: North America Thermal Power Market Volume gigawatt Forecast, by Region 2019 & 2032
- Table 9: North America Thermal Power Market Revenue Million Forecast, by Country 2019 & 2032
- Table 10: North America Thermal Power Market Volume gigawatt Forecast, by Country 2019 & 2032
- Table 11: United States North America Thermal Power Market Revenue (Million) Forecast, by Application 2019 & 2032
- Table 12: United States North America Thermal Power Market Volume (gigawatt) Forecast, by Application 2019 & 2032
- Table 13: Canada North America Thermal Power Market Revenue (Million) Forecast, by Application 2019 & 2032
- Table 14: Canada North America Thermal Power Market Volume (gigawatt) Forecast, by Application 2019 & 2032
- Table 15: Mexico North America Thermal Power Market Revenue (Million) Forecast, by Application 2019 & 2032
- Table 16: Mexico North America Thermal Power Market Volume (gigawatt) Forecast, by Application 2019 & 2032
- Table 17: Rest of North America North America Thermal Power Market Revenue (Million) Forecast, by Application 2019 & 2032
- Table 18: Rest of North America North America Thermal Power Market Volume (gigawatt) Forecast, by Application 2019 & 2032
- Table 19: North America Thermal Power Market Revenue Million Forecast, by Fuel Type 2019 & 2032
- Table 20: North America Thermal Power Market Volume gigawatt Forecast, by Fuel Type 2019 & 2032
- Table 21: North America Thermal Power Market Revenue Million Forecast, by Geography 2019 & 2032
- Table 22: North America Thermal Power Market Volume gigawatt Forecast, by Geography 2019 & 2032
- Table 23: North America Thermal Power Market Revenue Million Forecast, by Country 2019 & 2032
- Table 24: North America Thermal Power Market Volume gigawatt Forecast, by Country 2019 & 2032
- Table 25: North America Thermal Power Market Revenue Million Forecast, by Fuel Type 2019 & 2032
- Table 26: North America Thermal Power Market Volume gigawatt Forecast, by Fuel Type 2019 & 2032
- Table 27: North America Thermal Power Market Revenue Million Forecast, by Geography 2019 & 2032
- Table 28: North America Thermal Power Market Volume gigawatt Forecast, by Geography 2019 & 2032
- Table 29: North America Thermal Power Market Revenue Million Forecast, by Country 2019 & 2032
- Table 30: North America Thermal Power Market Volume gigawatt Forecast, by Country 2019 & 2032
- Table 31: North America Thermal Power Market Revenue Million Forecast, by Fuel Type 2019 & 2032
- Table 32: North America Thermal Power Market Volume gigawatt Forecast, by Fuel Type 2019 & 2032
- Table 33: North America Thermal Power Market Revenue Million Forecast, by Geography 2019 & 2032
- Table 34: North America Thermal Power Market Volume gigawatt Forecast, by Geography 2019 & 2032
- Table 35: North America Thermal Power Market Revenue Million Forecast, by Country 2019 & 2032
- Table 36: North America Thermal Power Market Volume gigawatt Forecast, by Country 2019 & 2032
Frequently Asked Questions
1. What is the projected Compound Annual Growth Rate (CAGR) of the North America Thermal Power Market?
The projected CAGR is approximately 0.91%.
2. Which companies are prominent players in the North America Thermal Power Market?
Key companies in the market include American Electric, Duke Energy, Exelon, Public Service Enterprise Group, Comisión Federal de Electricidad, Consolidated Edison, Dominion Energy, Xcel Energy, Southern Company, NextEra Energy.
3. What are the main segments of the North America Thermal Power Market?
The market segments include Fuel Type, Geography.
4. Can you provide details about the market size?
The market size is estimated to be USD XX Million as of 2022.
5. What are some drivers contributing to market growth?
4.; Increasing Investments in Thermal Power Plants.
6. What are the notable trends driving market growth?
Natural Gas to Dominate the Market.
7. Are there any restraints impacting market growth?
4.; Increase in Renewable Energy Share in the Total Power Generation Mix.
8. Can you provide examples of recent developments in the market?
November 2023: GE Vernova’s Gas Power business announced that it would support the development of an end-to-end green hydrogen system that Duke Energy plans to build and operate at its DeBary plant, located in Volusia County, Florida, near Orlando. When operational in 2024, the new hydrogen system will provide peak power to Duke’s customers at times of increased electricity demand. The plant is expected to be the first in the United States and among the world’s first power plants to produce and use green hydrogen to power a gas turbine for peaking power applications when the grid requires additional electrical generation to meet demand. The production, storage, and end-use will be co-located at the DeBary power plant. GE Vernova will support the integration of the turbine with green hydrogen, including the upgrade of one of the four GE 7E gas turbines installed at the site to accommodate hydrogen fuel blends of significant volumes.
9. What pricing options are available for accessing the report?
Pricing options include single-user, multi-user, and enterprise licenses priced at USD 4750, USD 5250, and USD 8750 respectively.
10. Is the market size provided in terms of value or volume?
The market size is provided in terms of value, measured in Million and volume, measured in gigawatt.
11. Are there any specific market keywords associated with the report?
Yes, the market keyword associated with the report is "North America Thermal Power Market," which aids in identifying and referencing the specific market segment covered.
12. How do I determine which pricing option suits my needs best?
The pricing options vary based on user requirements and access needs. Individual users may opt for single-user licenses, while businesses requiring broader access may choose multi-user or enterprise licenses for cost-effective access to the report.
13. Are there any additional resources or data provided in the North America Thermal Power Market report?
While the report offers comprehensive insights, it's advisable to review the specific contents or supplementary materials provided to ascertain if additional resources or data are available.
14. How can I stay updated on further developments or reports in the North America Thermal Power Market?
To stay informed about further developments, trends, and reports in the North America Thermal Power Market, consider subscribing to industry newsletters, following relevant companies and organizations, or regularly checking reputable industry news sources and publications.
Methodology
Step 1 - Identification of Relevant Samples Size from Population Database


Step 2 - Approaches for Defining Global Market Size (Value, Volume* & Price*)

Note*: In applicable scenarios
Step 3 - Data Sources
Primary Research
- Web Analytics
- Survey Reports
- Research Institute
- Latest Research Reports
- Opinion Leaders
Secondary Research
- Annual Reports
- White Paper
- Latest Press Release
- Industry Association
- Paid Database
- Investor Presentations

Step 4 - Data Triangulation
Involves using different sources of information in order to increase the validity of a study
These sources are likely to be stakeholders in a program - participants, other researchers, program staff, other community members, and so on.
Then we put all data in single framework & apply various statistical tools to find out the dynamic on the market.
During the analysis stage, feedback from the stakeholder groups would be compared to determine areas of agreement as well as areas of divergence


