
Key Insights
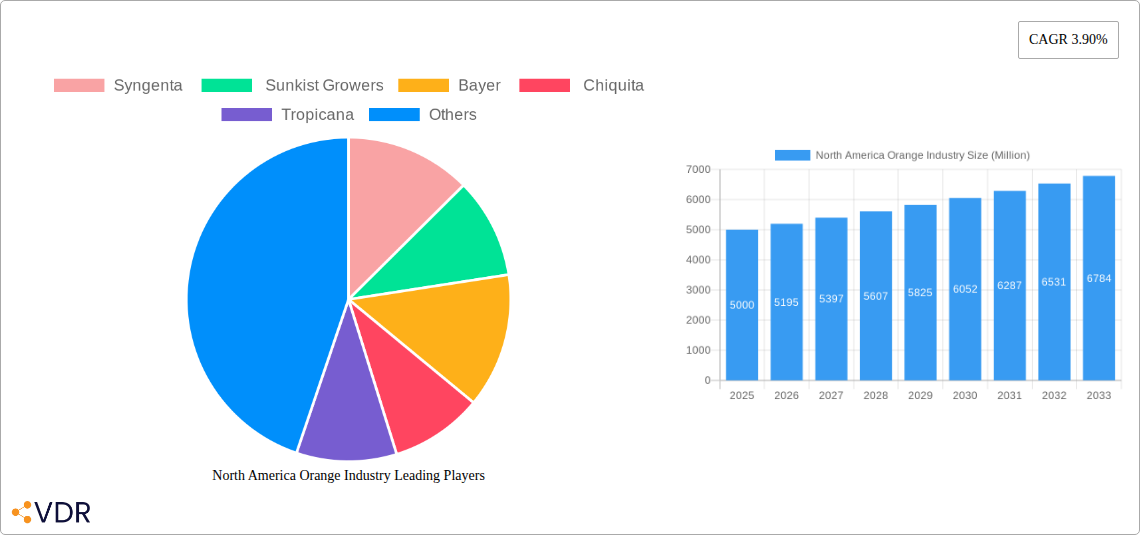
The North American orange industry, encompassing fresh and processed segments, presents a dynamic market landscape characterized by steady growth and evolving consumer preferences. The market, valued at approximately $5 billion in 2025, is projected to experience a compound annual growth rate (CAGR) of 3.90% from 2025 to 2033, driven primarily by increasing demand for convenient, healthy food and beverage options. The processed orange segment, particularly orange juice, holds significant market share, fueled by the widespread consumption of ready-to-drink beverages and the incorporation of orange juice into various food products. However, fluctuating orange yields due to climate change and pest infestations pose a significant restraint to consistent growth. The retail sector, encompassing grocery stores, supermarkets, and online grocers, remains the dominant end-user segment, reflecting the accessibility and convenience of purchasing oranges through established retail channels. Key players like Sunkist Growers, Tropicana, and other large-scale producers and distributors continue to shape market dynamics through their branding strategies and distribution networks. The premium orange segment, catering to health-conscious consumers seeking higher quality and flavor profiles, is experiencing above-average growth. The industry also sees a growing demand from the food service sector, particularly cafes and restaurants seeking fresh and flavorful ingredients for their menus.
Growth in the North American orange market will be significantly influenced by successful adaptations to climate change challenges, the implementation of sustainable farming practices, and innovative product development within the processed orange segment. The increasing demand for organic and locally sourced products presents opportunities for smaller growers and producers. Meanwhile, major players are likely to focus on expanding their distribution networks, especially through online channels, and enhancing their brand presence to maintain market leadership. The rise of functional beverages incorporating orange extracts and the exploration of new orange-based products, such as specialized orange oils, may also significantly contribute to industry expansion. This expansion is likely to be more pronounced within regions experiencing robust economic growth and higher per capita disposable incomes.
North America Orange Industry Market Report: 2019-2033
This comprehensive report provides an in-depth analysis of the North America orange industry, encompassing market dynamics, growth trends, regional performance, and key player strategies from 2019 to 2033. It's an essential resource for industry professionals, investors, and anyone seeking to understand this dynamic sector. The report leverages extensive data analysis and expert insights to offer actionable intelligence for informed decision-making.
Keywords: North America orange market, orange juice market, fresh orange market, orange industry, orange production, citrus fruit market, orange consumption, Sunkist Growers, Syngenta, Bayer, Chiquita, Tropicana, food and beverage industry, retail sector, food service industry, market analysis, market forecast, market size, CAGR, market share.
North America Orange Industry Market Dynamics & Structure
This section analyzes the competitive landscape, technological advancements, and regulatory environment shaping the North America orange industry. The market is characterized by a mix of large multinational corporations and smaller regional producers. Consolidation through mergers and acquisitions (M&A) has been a notable trend, with xx M&A deals recorded between 2019 and 2024.
- Market Concentration: The market is moderately concentrated, with the top five players holding an estimated xx% market share in 2025.
- Technological Innovation: Technological advancements in farming practices (e.g., precision agriculture, improved irrigation) and processing techniques (e.g., juice extraction, preservation) are driving efficiency and quality improvements. However, high initial investment costs pose a barrier for smaller players.
- Regulatory Framework: Government regulations related to pesticide use, food safety, and labeling significantly impact operational costs and market access.
- Competitive Substitutes: Other citrus fruits (lemons, grapefruits) and fruit juices compete for consumer spending. The rise of non-fruit juice beverages also presents a challenge.
- End-User Demographics: Growing consumer health consciousness and demand for natural and organic products influence purchasing decisions. The increasing demand for convenient packaging options is also driving market growth.
- M&A Trends: Consolidation is driven by the need for economies of scale, access to wider distribution networks, and improved brand recognition.
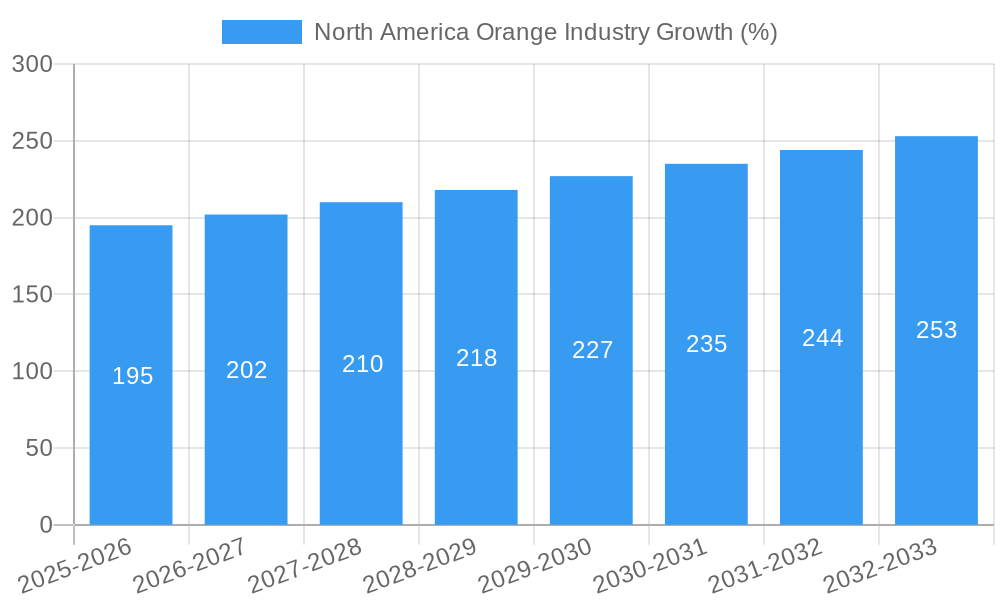
North America Orange Industry Growth Trends & Insights
The North America orange industry experienced a period of moderate growth during the historical period (2019-2024), with a Compound Annual Growth Rate (CAGR) of xx%. The market size in 2025 is estimated at xx million units, driven primarily by increasing consumption of fresh oranges and orange juice. Consumer preference shifts towards premium and organic varieties are contributing to this growth. Technological advancements in processing, packaging and distribution continue to enhance efficiency and quality of products which also aids the growth of the market. The forecast period (2025-2033) anticipates continued growth, with a projected CAGR of xx%, reaching xx million units by 2033.
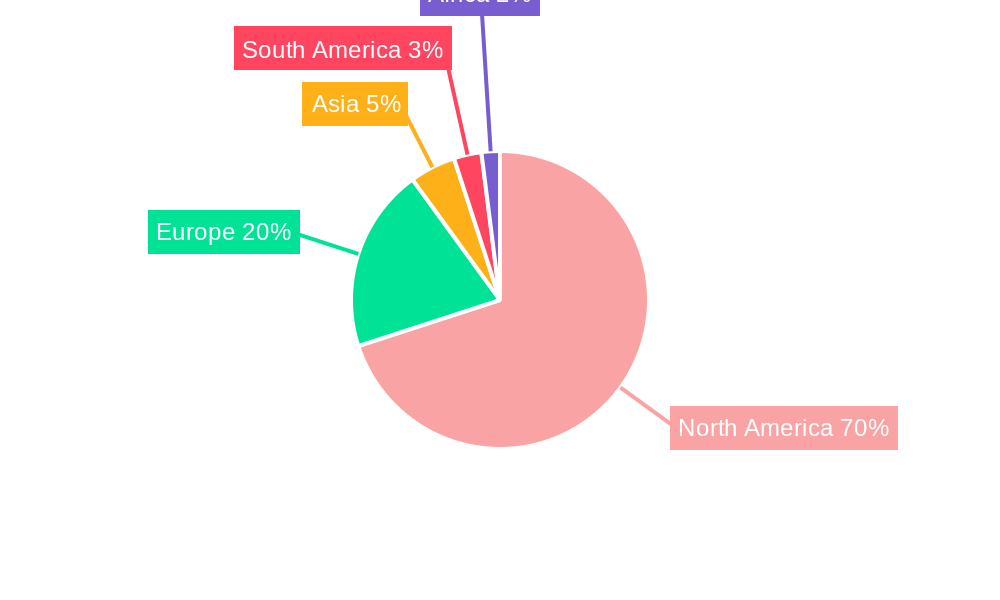
Dominant Regions, Countries, or Segments in North America Orange Industry
California remains the dominant region for orange production in North America, contributing the largest share of both fresh and processed orange output. Florida and other sunbelt states hold significant shares as well.
Product Segments:
- Fresh Oranges: The premium orange segment is experiencing faster growth than the conventional orange segment due to increased consumer willingness to pay for higher quality and differentiated taste profiles.
- Processed Oranges: Orange juice constitutes the most significant portion of the processed orange market, followed by orange pulp and orange oils.
End-User Segments:
- Food and Beverage Industry: This segment is the largest consumer of oranges, with juice manufacturers, beverage companies, and food processors accounting for a significant portion of demand.
- Retail Sector: Growth in organized retail and the rise of online grocery channels are significantly impacting distribution and accessibility.
- Food Service Industry: Restaurants, cafes, and hotels contribute to a considerable part of orange consumption, especially in the fresh orange segment.
North America Orange Industry Product Landscape
The orange industry is witnessing continuous product innovation focusing on enhancing convenience, taste, health benefits, and premiumization. New varieties of oranges with improved taste, size, and shelf life are continually developed. The sector is focused on creating product variants that are healthier, organic, or offer functional benefits. Advancements in processing technologies are leading to improved juice yields, reduced waste, and extended shelf life.
Key Drivers, Barriers & Challenges in North America Orange Industry
Key Drivers:
- Increasing consumer demand for healthy and convenient food and beverages.
- Growing popularity of premium and organic orange products.
- Technological advancements in orange farming and processing.
Key Challenges:
- Fluctuations in orange yields due to weather patterns and pests negatively impact supply and increase costs, impacting production significantly, leading to an estimated xx% reduction in supply during adverse years.
- Competition from other fruit juices and beverages and the resulting loss of market share.
- High production and processing costs impacting margins.
Emerging Opportunities in North America Orange Industry
- Expansion into new product segments, such as functional orange juices enriched with vitamins or antioxidants.
- Growth of the online grocery channel providing new opportunities for direct-to-consumer sales and expansion of the target market.
- Increasing demand for convenient packaging formats which provide further consumer appeal.
Growth Accelerators in the North America Orange Industry
Technological breakthroughs in farming techniques and processing technologies will continue to drive efficiency gains, reduce costs, and improve product quality. Strategic partnerships between growers, processors, and retailers will optimize supply chains and enhance market reach. Aggressive marketing and branding strategies will drive premiumization and solidify brand positioning to increase market share.
Key Players Shaping the North America Orange Industry Market
Notable Milestones in North America Orange Industry Sector
- 2020: Introduction of a new disease-resistant orange variety by Syngenta.
- 2021: Sunkist Growers launched a new line of organic orange juices.
- 2022: Bayer introduced a new natural pesticide for orange groves.
- 2023: Tropicana partnered with a major retailer for exclusive distribution.
In-Depth North America Orange Industry Market Outlook
The North America orange industry is poised for continued growth over the forecast period (2025-2033), driven by robust consumer demand, technological innovations, and expanding distribution channels. Opportunities exist for companies to innovate products, develop efficient supply chains, and leverage data analytics to enhance their market positioning. Focusing on sustainability and organic product development is set to increase the appeal and market penetration for the industry.
North America Orange Industry Segmentation
- 1. Production Analysis
- 2. Consumption Analysis
- 3. Import Market Analysis (Value & Volume)
- 4. Export Market Analysis (Value & Volume)
- 5. Price Trend Analysis
North America Orange Industry Segmentation By Geography
- 1. United States
- 2. Canada
- 3. Mexico
North America Orange Industry REPORT HIGHLIGHTS
| Aspects | Details |
|---|---|
| Study Period | 2019-2033 |
| Base Year | 2024 |
| Estimated Year | 2025 |
| Forecast Period | 2025-2033 |
| Historical Period | 2019-2024 |
| Growth Rate | CAGR of 3.90% from 2019-2033 |
| Segmentation |
|
Table of Contents
- 1. Introduction
- 1.1. Research Scope
- 1.2. Market Segmentation
- 1.3. Research Methodology
- 1.4. Definitions and Assumptions
- 2. Executive Summary
- 2.1. Introduction
- 3. Market Dynamics
- 3.1. Introduction
- 3.2. Market Drivers
- 3.2.1. Rising Consumption of Cashew Nuts in the Country; Favorable Government Initiatives
- 3.3. Market Restrains
- 3.3.1. Hazardous Climatic Condition Hinders Cashew Production; Stringent Regulations Related to Food Quality Standards
- 3.4. Market Trends
- 3.4.1. Continuous Increase in Production of Oranges in Mexico
- 4. Market Factor Analysis
- 4.1. Porters Five Forces
- 4.2. Supply/Value Chain
- 4.3. PESTEL analysis
- 4.4. Market Entropy
- 4.5. Patent/Trademark Analysis
- 5. North America Orange Industry Analysis, Insights and Forecast, 2019-2031
- 5.1. Market Analysis, Insights and Forecast - by Production Analysis
- 5.2. Market Analysis, Insights and Forecast - by Consumption Analysis
- 5.3. Market Analysis, Insights and Forecast - by Import Market Analysis (Value & Volume)
- 5.4. Market Analysis, Insights and Forecast - by Export Market Analysis (Value & Volume)
- 5.5. Market Analysis, Insights and Forecast - by Price Trend Analysis
- 5.6. Market Analysis, Insights and Forecast - by Region
- 5.6.1. United States
- 5.6.2. Canada
- 5.6.3. Mexico
- 5.1. Market Analysis, Insights and Forecast - by Production Analysis
- 6. United States North America Orange Industry Analysis, Insights and Forecast, 2019-2031
- 6.1. Market Analysis, Insights and Forecast - by Production Analysis
- 6.2. Market Analysis, Insights and Forecast - by Consumption Analysis
- 6.3. Market Analysis, Insights and Forecast - by Import Market Analysis (Value & Volume)
- 6.4. Market Analysis, Insights and Forecast - by Export Market Analysis (Value & Volume)
- 6.5. Market Analysis, Insights and Forecast - by Price Trend Analysis
- 6.1. Market Analysis, Insights and Forecast - by Production Analysis
- 7. Canada North America Orange Industry Analysis, Insights and Forecast, 2019-2031
- 7.1. Market Analysis, Insights and Forecast - by Production Analysis
- 7.2. Market Analysis, Insights and Forecast - by Consumption Analysis
- 7.3. Market Analysis, Insights and Forecast - by Import Market Analysis (Value & Volume)
- 7.4. Market Analysis, Insights and Forecast - by Export Market Analysis (Value & Volume)
- 7.5. Market Analysis, Insights and Forecast - by Price Trend Analysis
- 7.1. Market Analysis, Insights and Forecast - by Production Analysis
- 8. Mexico North America Orange Industry Analysis, Insights and Forecast, 2019-2031
- 8.1. Market Analysis, Insights and Forecast - by Production Analysis
- 8.2. Market Analysis, Insights and Forecast - by Consumption Analysis
- 8.3. Market Analysis, Insights and Forecast - by Import Market Analysis (Value & Volume)
- 8.4. Market Analysis, Insights and Forecast - by Export Market Analysis (Value & Volume)
- 8.5. Market Analysis, Insights and Forecast - by Price Trend Analysis
- 8.1. Market Analysis, Insights and Forecast - by Production Analysis
- 9. United States North America Orange Industry Analysis, Insights and Forecast, 2019-2031
- 10. Canada North America Orange Industry Analysis, Insights and Forecast, 2019-2031
- 11. Mexico North America Orange Industry Analysis, Insights and Forecast, 2019-2031
- 12. Rest of North America North America Orange Industry Analysis, Insights and Forecast, 2019-2031
- 13. Competitive Analysis
- 13.1. Market Share Analysis 2024
- 13.2. Company Profiles
- 13.2.1 Syngenta
- 13.2.1.1. Overview
- 13.2.1.2. Products
- 13.2.1.3. SWOT Analysis
- 13.2.1.4. Recent Developments
- 13.2.1.5. Financials (Based on Availability)
- 13.2.2 Sunkist Growers
- 13.2.2.1. Overview
- 13.2.2.2. Products
- 13.2.2.3. SWOT Analysis
- 13.2.2.4. Recent Developments
- 13.2.2.5. Financials (Based on Availability)
- 13.2.3 Bayer
- 13.2.3.1. Overview
- 13.2.3.2. Products
- 13.2.3.3. SWOT Analysis
- 13.2.3.4. Recent Developments
- 13.2.3.5. Financials (Based on Availability)
- 13.2.4 Chiquita
- 13.2.4.1. Overview
- 13.2.4.2. Products
- 13.2.4.3. SWOT Analysis
- 13.2.4.4. Recent Developments
- 13.2.4.5. Financials (Based on Availability)
- 13.2.5 Tropicana
- 13.2.5.1. Overview
- 13.2.5.2. Products
- 13.2.5.3. SWOT Analysis
- 13.2.5.4. Recent Developments
- 13.2.5.5. Financials (Based on Availability)
- 13.2.1 Syngenta
List of Figures
- Figure 1: North America Orange Industry Revenue Breakdown (Million, %) by Product 2024 & 2032
- Figure 2: North America Orange Industry Share (%) by Company 2024
List of Tables
- Table 1: North America Orange Industry Revenue Million Forecast, by Region 2019 & 2032
- Table 2: North America Orange Industry Volume Kiloton Forecast, by Region 2019 & 2032
- Table 3: North America Orange Industry Revenue Million Forecast, by Production Analysis 2019 & 2032
- Table 4: North America Orange Industry Volume Kiloton Forecast, by Production Analysis 2019 & 2032
- Table 5: North America Orange Industry Revenue Million Forecast, by Consumption Analysis 2019 & 2032
- Table 6: North America Orange Industry Volume Kiloton Forecast, by Consumption Analysis 2019 & 2032
- Table 7: North America Orange Industry Revenue Million Forecast, by Import Market Analysis (Value & Volume) 2019 & 2032
- Table 8: North America Orange Industry Volume Kiloton Forecast, by Import Market Analysis (Value & Volume) 2019 & 2032
- Table 9: North America Orange Industry Revenue Million Forecast, by Export Market Analysis (Value & Volume) 2019 & 2032
- Table 10: North America Orange Industry Volume Kiloton Forecast, by Export Market Analysis (Value & Volume) 2019 & 2032
- Table 11: North America Orange Industry Revenue Million Forecast, by Price Trend Analysis 2019 & 2032
- Table 12: North America Orange Industry Volume Kiloton Forecast, by Price Trend Analysis 2019 & 2032
- Table 13: North America Orange Industry Revenue Million Forecast, by Region 2019 & 2032
- Table 14: North America Orange Industry Volume Kiloton Forecast, by Region 2019 & 2032
- Table 15: North America Orange Industry Revenue Million Forecast, by Country 2019 & 2032
- Table 16: North America Orange Industry Volume Kiloton Forecast, by Country 2019 & 2032
- Table 17: United States North America Orange Industry Revenue (Million) Forecast, by Application 2019 & 2032
- Table 18: United States North America Orange Industry Volume (Kiloton) Forecast, by Application 2019 & 2032
- Table 19: Canada North America Orange Industry Revenue (Million) Forecast, by Application 2019 & 2032
- Table 20: Canada North America Orange Industry Volume (Kiloton) Forecast, by Application 2019 & 2032
- Table 21: Mexico North America Orange Industry Revenue (Million) Forecast, by Application 2019 & 2032
- Table 22: Mexico North America Orange Industry Volume (Kiloton) Forecast, by Application 2019 & 2032
- Table 23: Rest of North America North America Orange Industry Revenue (Million) Forecast, by Application 2019 & 2032
- Table 24: Rest of North America North America Orange Industry Volume (Kiloton) Forecast, by Application 2019 & 2032
- Table 25: North America Orange Industry Revenue Million Forecast, by Production Analysis 2019 & 2032
- Table 26: North America Orange Industry Volume Kiloton Forecast, by Production Analysis 2019 & 2032
- Table 27: North America Orange Industry Revenue Million Forecast, by Consumption Analysis 2019 & 2032
- Table 28: North America Orange Industry Volume Kiloton Forecast, by Consumption Analysis 2019 & 2032
- Table 29: North America Orange Industry Revenue Million Forecast, by Import Market Analysis (Value & Volume) 2019 & 2032
- Table 30: North America Orange Industry Volume Kiloton Forecast, by Import Market Analysis (Value & Volume) 2019 & 2032
- Table 31: North America Orange Industry Revenue Million Forecast, by Export Market Analysis (Value & Volume) 2019 & 2032
- Table 32: North America Orange Industry Volume Kiloton Forecast, by Export Market Analysis (Value & Volume) 2019 & 2032
- Table 33: North America Orange Industry Revenue Million Forecast, by Price Trend Analysis 2019 & 2032
- Table 34: North America Orange Industry Volume Kiloton Forecast, by Price Trend Analysis 2019 & 2032
- Table 35: North America Orange Industry Revenue Million Forecast, by Country 2019 & 2032
- Table 36: North America Orange Industry Volume Kiloton Forecast, by Country 2019 & 2032
- Table 37: North America Orange Industry Revenue Million Forecast, by Production Analysis 2019 & 2032
- Table 38: North America Orange Industry Volume Kiloton Forecast, by Production Analysis 2019 & 2032
- Table 39: North America Orange Industry Revenue Million Forecast, by Consumption Analysis 2019 & 2032
- Table 40: North America Orange Industry Volume Kiloton Forecast, by Consumption Analysis 2019 & 2032
- Table 41: North America Orange Industry Revenue Million Forecast, by Import Market Analysis (Value & Volume) 2019 & 2032
- Table 42: North America Orange Industry Volume Kiloton Forecast, by Import Market Analysis (Value & Volume) 2019 & 2032
- Table 43: North America Orange Industry Revenue Million Forecast, by Export Market Analysis (Value & Volume) 2019 & 2032
- Table 44: North America Orange Industry Volume Kiloton Forecast, by Export Market Analysis (Value & Volume) 2019 & 2032
- Table 45: North America Orange Industry Revenue Million Forecast, by Price Trend Analysis 2019 & 2032
- Table 46: North America Orange Industry Volume Kiloton Forecast, by Price Trend Analysis 2019 & 2032
- Table 47: North America Orange Industry Revenue Million Forecast, by Country 2019 & 2032
- Table 48: North America Orange Industry Volume Kiloton Forecast, by Country 2019 & 2032
- Table 49: North America Orange Industry Revenue Million Forecast, by Production Analysis 2019 & 2032
- Table 50: North America Orange Industry Volume Kiloton Forecast, by Production Analysis 2019 & 2032
- Table 51: North America Orange Industry Revenue Million Forecast, by Consumption Analysis 2019 & 2032
- Table 52: North America Orange Industry Volume Kiloton Forecast, by Consumption Analysis 2019 & 2032
- Table 53: North America Orange Industry Revenue Million Forecast, by Import Market Analysis (Value & Volume) 2019 & 2032
- Table 54: North America Orange Industry Volume Kiloton Forecast, by Import Market Analysis (Value & Volume) 2019 & 2032
- Table 55: North America Orange Industry Revenue Million Forecast, by Export Market Analysis (Value & Volume) 2019 & 2032
- Table 56: North America Orange Industry Volume Kiloton Forecast, by Export Market Analysis (Value & Volume) 2019 & 2032
- Table 57: North America Orange Industry Revenue Million Forecast, by Price Trend Analysis 2019 & 2032
- Table 58: North America Orange Industry Volume Kiloton Forecast, by Price Trend Analysis 2019 & 2032
- Table 59: North America Orange Industry Revenue Million Forecast, by Country 2019 & 2032
- Table 60: North America Orange Industry Volume Kiloton Forecast, by Country 2019 & 2032
Frequently Asked Questions
1. What is the projected Compound Annual Growth Rate (CAGR) of the North America Orange Industry?
The projected CAGR is approximately 3.90%.
2. Which companies are prominent players in the North America Orange Industry?
Key companies in the market include Syngenta , Sunkist Growers, Bayer , Chiquita, Tropicana.
3. What are the main segments of the North America Orange Industry?
The market segments include Production Analysis, Consumption Analysis, Import Market Analysis (Value & Volume), Export Market Analysis (Value & Volume), Price Trend Analysis.
4. Can you provide details about the market size?
The market size is estimated to be USD XXX Million as of 2022.
5. What are some drivers contributing to market growth?
Rising Consumption of Cashew Nuts in the Country; Favorable Government Initiatives.
6. What are the notable trends driving market growth?
Continuous Increase in Production of Oranges in Mexico.
7. Are there any restraints impacting market growth?
Hazardous Climatic Condition Hinders Cashew Production; Stringent Regulations Related to Food Quality Standards.
8. Can you provide examples of recent developments in the market?
N/A
9. What pricing options are available for accessing the report?
Pricing options include single-user, multi-user, and enterprise licenses priced at USD 4750, USD 5250, and USD 8750 respectively.
10. Is the market size provided in terms of value or volume?
The market size is provided in terms of value, measured in Million and volume, measured in Kiloton.
11. Are there any specific market keywords associated with the report?
Yes, the market keyword associated with the report is "North America Orange Industry," which aids in identifying and referencing the specific market segment covered.
12. How do I determine which pricing option suits my needs best?
The pricing options vary based on user requirements and access needs. Individual users may opt for single-user licenses, while businesses requiring broader access may choose multi-user or enterprise licenses for cost-effective access to the report.
13. Are there any additional resources or data provided in the North America Orange Industry report?
While the report offers comprehensive insights, it's advisable to review the specific contents or supplementary materials provided to ascertain if additional resources or data are available.
14. How can I stay updated on further developments or reports in the North America Orange Industry?
To stay informed about further developments, trends, and reports in the North America Orange Industry, consider subscribing to industry newsletters, following relevant companies and organizations, or regularly checking reputable industry news sources and publications.
Methodology
Step 1 - Identification of Relevant Samples Size from Population Database


Step 2 - Approaches for Defining Global Market Size (Value, Volume* & Price*)

Note*: In applicable scenarios
Step 3 - Data Sources
Primary Research
- Web Analytics
- Survey Reports
- Research Institute
- Latest Research Reports
- Opinion Leaders
Secondary Research
- Annual Reports
- White Paper
- Latest Press Release
- Industry Association
- Paid Database
- Investor Presentations

Step 4 - Data Triangulation
Involves using different sources of information in order to increase the validity of a study
These sources are likely to be stakeholders in a program - participants, other researchers, program staff, other community members, and so on.
Then we put all data in single framework & apply various statistical tools to find out the dynamic on the market.
During the analysis stage, feedback from the stakeholder groups would be compared to determine areas of agreement as well as areas of divergence


