

Key Insights
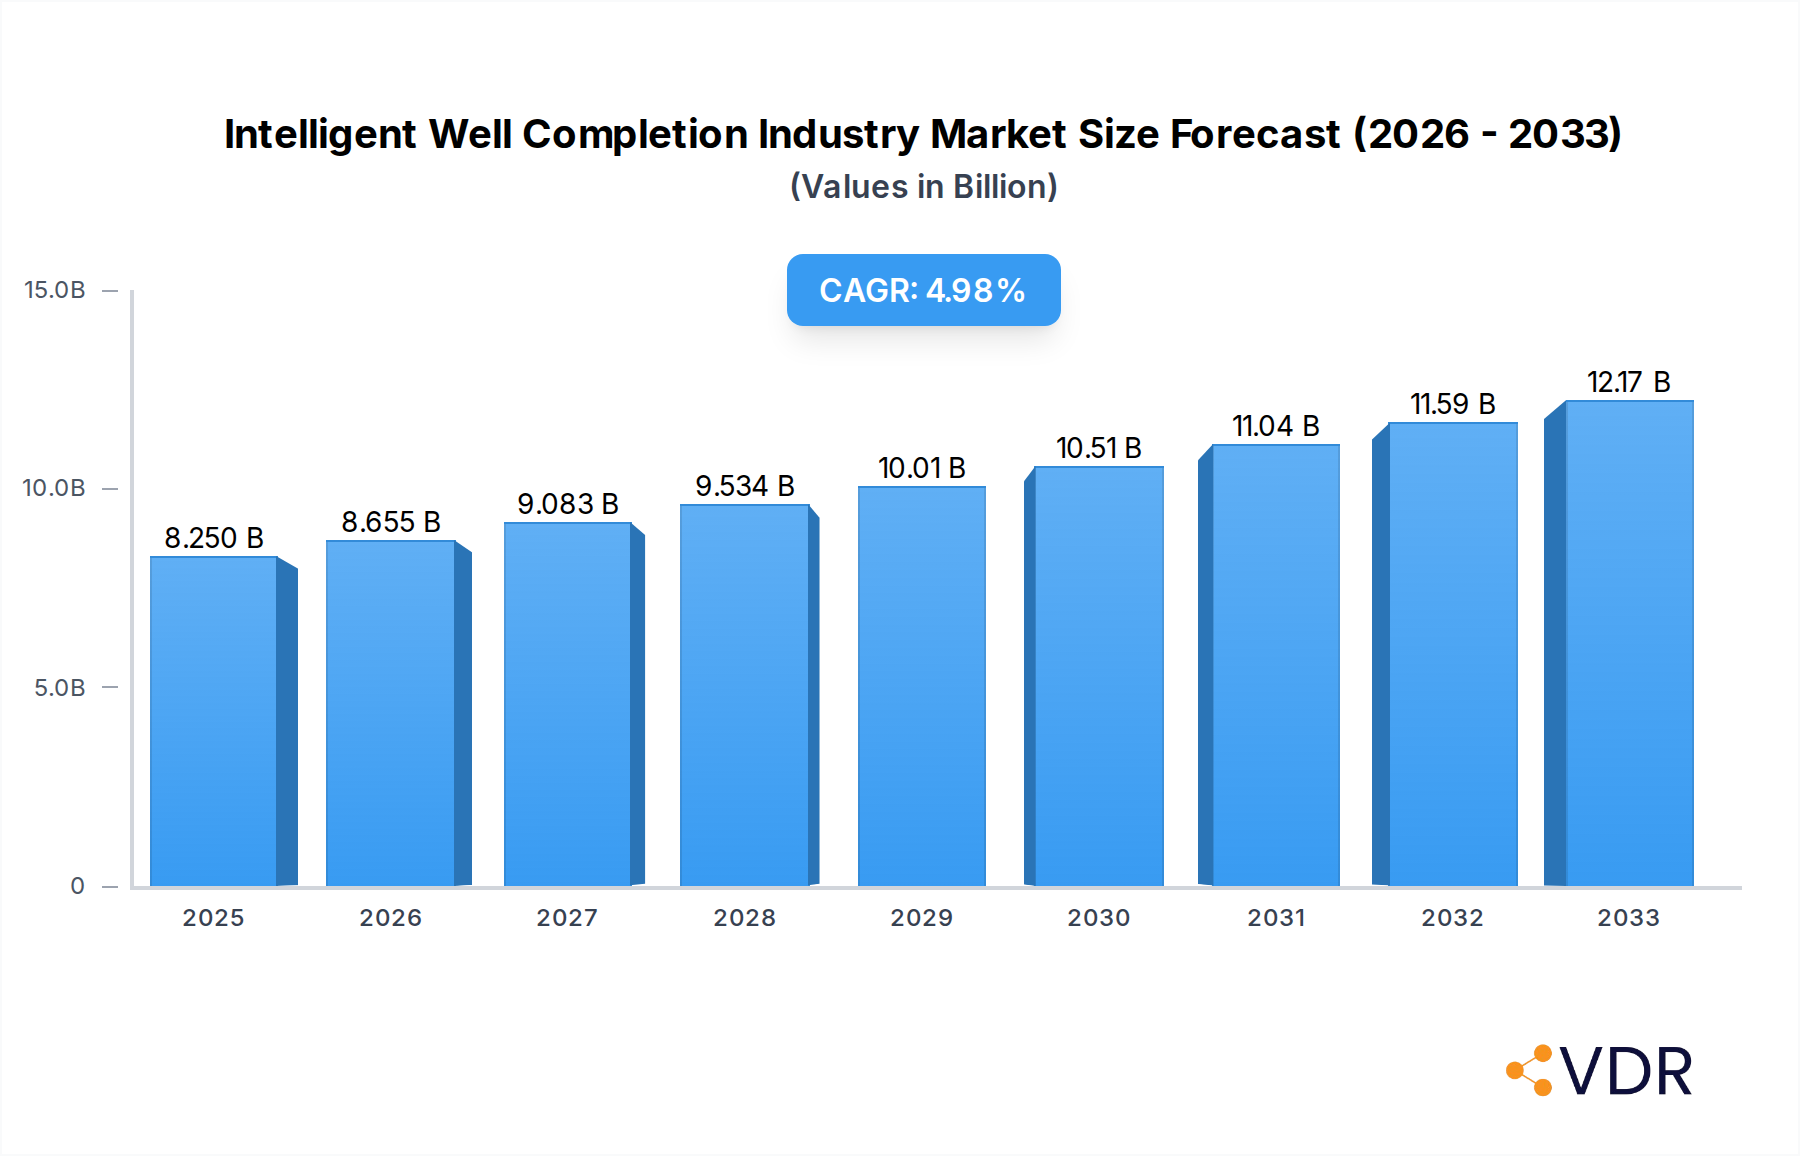
The Intelligent Well Completion market is poised for robust growth, projecting a market size of $8.25 billion in 2025 and expanding at a Compound Annual Growth Rate (CAGR) of 4.88% through 2033. This expansion is primarily fueled by the increasing demand for enhanced oil and gas recovery, driven by the need to optimize production from mature fields and the growing exploration activities in challenging offshore and unconventional reservoirs. The adoption of advanced technologies like smart completions, permanent downhole gauges, and remotely controlled valves is crucial for improving operational efficiency, reducing downtime, and minimizing environmental impact. Furthermore, the rising global energy demand necessitates more sophisticated extraction methods, making intelligent well completion systems a vital component of modern oil and gas operations. Innovations in sensor technology, data analytics, and artificial intelligence are further accelerating market penetration by enabling real-time monitoring, predictive maintenance, and optimized reservoir management.

Intelligent Well Completion Industry Market Size (In Billion)
The market dynamics are also shaped by significant trends such as the integration of Internet of Things (IoT) devices for seamless data flow and the growing emphasis on digital oilfield solutions. These advancements allow for greater control and automation in well operations, leading to significant cost savings and improved safety standards. Key drivers include the pursuit of higher production efficiency and the development of unconventional resources, where intelligent completions offer a distinct advantage in managing complex reservoir conditions. However, the market also faces restraints, including the high initial investment costs associated with sophisticated completion systems and the potential for technical complexities during installation and maintenance. Geographically, North America is expected to maintain a dominant market share due to its extensive unconventional resource base and advanced technological adoption. The Asia Pacific region is anticipated to witness the fastest growth, driven by increasing exploration and production activities and a burgeoning energy demand.
Intelligent Well Completion Industry Company Market Share
Unlock unparalleled insights into the Intelligent Well Completion Industry with this comprehensive report. Covering the period from 2019 to 2033, with a base year of 2025, this analysis delves deep into market dynamics, growth trends, regional dominance, product landscape, key players, and emerging opportunities. Gain a strategic advantage by understanding the forces shaping this rapidly evolving sector, driven by technological advancements and increasing demand for optimized oil and gas production. This report offers critical data on market size, CAGR, and future projections, making it an indispensable resource for industry professionals, investors, and stakeholders.
Intelligent Well Completion Industry Market Dynamics & Structure
The Intelligent Well Completion (IWC) industry exhibits a moderately concentrated market structure, with a few key players dominating the global landscape. Technological innovation acts as a primary driver, fueled by the continuous pursuit of enhanced oil recovery (EOR), improved operational efficiency, and reduced environmental impact. Sophisticated digital technologies, real-time data analytics, and advanced sensor integration are at the forefront of innovation. Regulatory frameworks, particularly those focused on safety, environmental protection, and data security, play a crucial role in shaping market entry and operational standards. While competitive product substitutes exist in conventional completion methods, the unique value proposition of intelligent systems—offering superior control and optimization—creates a significant barrier to widespread substitution. End-user demographics are shifting towards operators prioritizing lifecycle well management and cost-effective production, including national oil companies (NOCs) and major independent exploration and production (E&P) companies. Mergers and acquisitions (M&A) are a recurring theme, driven by the need for consolidating technological capabilities, expanding market reach, and achieving economies of scale. The market saw a predicted XX M&A deals in the historical period, signaling ongoing consolidation and strategic realignment.
- Market Concentration: Dominated by a few multinational service providers and specialized technology developers.
- Technological Innovation Drivers: Focus on AI-driven analytics, IoT integration, advanced sensor technology, and remote monitoring capabilities.
- Regulatory Frameworks: Stringent safety and environmental regulations, alongside data governance standards, influence product development and deployment.
- Competitive Product Substitutes: Conventional completion methods offer lower initial costs but lack the long-term optimization benefits of IWC.
- End-User Demographics: Increasing demand from E&P companies seeking to maximize recovery from mature fields and optimize production from new reserves.
- M&A Trends: Strategic acquisitions aimed at bolstering technological portfolios and expanding service offerings.
Intelligent Well Completion Industry Growth Trends & Insights
The Intelligent Well Completion (IWC) industry is on a robust growth trajectory, driven by the imperative to enhance hydrocarbon recovery and operational efficiency in the face of declining reservoir pressures and increasing operational complexities. The market size is projected to expand significantly, with an estimated market size of $XX billion in 2025, growing at a Compound Annual Growth Rate (CAGR) of approximately XX% from 2025 to 2033. This impressive growth is underpinned by increasing adoption rates of advanced completion technologies across mature and unconventional oil and gas fields globally. Technological disruptions, particularly in areas like digital twins, machine learning for predictive maintenance, and enhanced subsurface visualization, are revolutionizing well management and production optimization. Consumer behavior is shifting from a traditional approach to well intervention towards a more proactive, data-driven lifecycle management strategy, where intelligent completions are becoming indispensable. The ability of IWC systems to provide real-time data, enable remote control, and facilitate multi-zone management directly translates into optimized production volumes, reduced operational costs, and a lower environmental footprint, making them increasingly attractive to oil and gas operators. Furthermore, the growing emphasis on maximizing the economic value of existing reserves and the development of complex offshore and deepwater projects necessitate the deployment of sophisticated completion solutions.
- Market Size Evolution: From an estimated $XX billion in 2025 to a projected $XX billion by 2033.
- Adoption Rates: Increasing adoption in both onshore and offshore E&P activities, particularly for mature fields and complex well designs.
- Technological Disruptions: Advancements in AI, IoT, and data analytics are enhancing the capabilities and deployment of intelligent systems.
- Consumer Behavior Shifts: Operators are moving towards proactive, data-driven well management, prioritizing lifecycle value and operational efficiency.
- Market Penetration: Expected to rise significantly as the economic and operational benefits of IWC become more widely recognized and integrated into E&P strategies.
Dominant Regions, Countries, or Segments in Intelligent Well Completion Industry
North America currently stands as the dominant region in the Intelligent Well Completion (IWC) industry, driven by its substantial shale oil and gas production, advanced technological adoption, and a highly competitive E&P landscape. The United States, in particular, plays a pivotal role due to its extensive unconventional resource base and the presence of major oilfield service companies and technology innovators. The Production Analysis: in North America consistently leads, reflecting the region's high drilling activity and the widespread implementation of advanced completion techniques to optimize output from its vast reserves. Consumption Analysis: also showcases North America's leading position, as operators actively invest in intelligent systems to manage complex multi-zone wells and enhance recovery rates in challenging formations.
The Import Market Analysis (Value & Volume) for North America is significant, reflecting the global demand for specialized IWC components and technologies, although domestic manufacturing also plays a crucial role. Conversely, the Export Market Analysis (Value & Volume) highlights North America's role as a major supplier of IWC technology and services to other global energy markets. The Price Trend Analysis: in this region is influenced by supply-demand dynamics, technological innovation, and the competitive intensity among service providers. Key drivers for North America's dominance include supportive government policies for energy production, significant capital expenditure by major oil companies, and a mature ecosystem of technological expertise and infrastructure. The region's proactive approach to adopting new technologies, coupled with its vast recoverable reserves, solidifies its leadership in the IWC market. Other regions like the Middle East and Asia-Pacific are experiencing rapid growth, driven by new field developments and the increasing need for production optimization, but North America's established infrastructure and ongoing innovation continue to position it at the forefront.
- Dominant Region: North America, particularly the United States, owing to extensive shale production and technological adoption.
- Production Analysis: High output driven by advanced completion strategies in unconventional reservoirs.
- Consumption Analysis: Significant demand driven by the need for optimized production from complex wells.
- Import Market Analysis (Value & Volume): Reflects global demand for specialized IWC components and services.
- Export Market Analysis (Value & Volume): Positions North America as a key supplier of IWC technology and expertise.
- Price Trend Analysis: Influenced by market dynamics, technological advancements, and competitive pressures.
- Key Drivers: Supportive energy policies, substantial E&P investment, advanced technological ecosystem, and vast reserve base.
Intelligent Well Completion Industry Product Landscape
The Intelligent Well Completion (IWC) product landscape is characterized by a suite of sophisticated technologies designed to provide real-time data acquisition, remote control, and automated operational adjustments within the wellbore. These systems integrate advanced sensors, downhole tools, communication systems, and surface control units to enable precise management of production zones, flow rates, and pressures. Innovations focus on enhanced sensor accuracy, miniaturization of downhole components, improved data transmission reliability, and the integration of artificial intelligence for predictive analysis and autonomous decision-making. Applications range from managing multi-lateral wells and optimizing production from various intervals simultaneously to enabling rapid shut-in for safety and minimizing unnecessary interventions. The unique selling propositions lie in their ability to significantly improve hydrocarbon recovery factors, reduce operational expenditures through optimized well performance, and enhance safety and environmental compliance.
Key Drivers, Barriers & Challenges in Intelligent Well Completion Industry
The Intelligent Well Completion (IWC) industry is propelled by several key drivers, including the escalating demand for efficient hydrocarbon extraction, the imperative to maximize recovery from mature and complex reservoirs, and the continuous advancements in digital oilfield technologies. Economic factors such as fluctuating oil prices and the need for cost-effective production solutions also play a significant role. Policy-driven initiatives promoting technological adoption and environmental sustainability further bolster market growth.
However, the industry faces significant challenges and restraints. High upfront capital investment for intelligent systems remains a considerable barrier for some operators. Supply chain complexities and the availability of skilled personnel for installation, operation, and maintenance of these advanced technologies can also pose issues. Stringent regulatory environments in certain regions, while promoting safety, can add to compliance costs and deployment timelines. Furthermore, the perceived risk associated with adopting newer, more complex technologies compared to conventional methods can lead to slower adoption rates, particularly in less technologically advanced markets. Competitive pressures from established players offering integrated solutions also necessitate continuous innovation and strategic pricing.
Emerging Opportunities in Intelligent Well Completion Industry
Emerging opportunities in the Intelligent Well Completion (IWC) industry are centered around the integration of advanced analytics, AI, and machine learning to further optimize well performance and enable predictive maintenance. The increasing focus on reducing carbon emissions presents an opportunity for IWC systems to contribute to more efficient operations and reduced flaring. Untapped markets in emerging economies with developing energy sectors offer significant growth potential as these regions seek to modernize their production capabilities. Furthermore, the application of IWC technologies in enhanced oil recovery (EOR) projects and unconventional resource development, particularly those involving complex geological formations, represents a substantial and growing market segment.
Growth Accelerators in the Intelligent Well Completion Industry Industry
The long-term growth of the Intelligent Well Completion (IWC) industry is significantly accelerated by ongoing technological breakthroughs in areas such as real-time data processing, downhole sensor miniaturization, and wireless communication technologies. Strategic partnerships between oilfield service providers, technology developers, and E&P companies are crucial for co-creating innovative solutions and expanding market reach. Furthermore, the increasing adoption of digital transformation strategies across the oil and gas sector, coupled with a growing emphasis on data-driven decision-making, acts as a powerful catalyst for wider deployment of IWC systems. Market expansion into new geographies and the development of integrated service packages that offer end-to-end well management solutions are also key growth accelerators.
Key Players Shaping the Intelligent Well Completion Industry Market
- Schlumberger Ltd
- Halliburton Company
- Baker Hughes Company
- Weatherford International plc
- National-Oilwell Varco Inc
- Trican Well Service Ltd
- Weir Group PLC
- Superior Energy Services Inc
- Packers Plus Energy Services Inc
- Schoeller-Bleckmann Oilfield Equipment AG
- Welltec A/S
Notable Milestones in Intelligent Well Completion Industry Sector
- April 2022: Halliburton introduced StrataStar, a deep azimuthal resistivity service designed to enhance well contact with reservoirs and improve real-time reserve evaluation, augmenting their iStar intelligent drilling and logging platform.
- February 2023: Baker Hughes launched new software specifically designed to improve the efficiency and performance of well completions while simultaneously reducing associated emissions.
In-Depth Intelligent Well Completion Industry Market Outlook
The future outlook for the Intelligent Well Completion (IWC) industry is exceptionally bright, driven by an unrelenting pursuit of operational efficiency, enhanced hydrocarbon recovery, and sustainable energy production. Growth accelerators, including pervasive digital transformation within the E&P sector and significant investments in advanced analytics and AI, are poised to unlock new levels of well performance optimization. Strategic collaborations among industry leaders will continue to foster innovation and streamline the deployment of cutting-edge IWC solutions. The market's trajectory points towards an increased adoption of integrated, data-driven well management strategies, solidifying the indispensable role of intelligent completions in meeting global energy demands responsibly and efficiently.
Intelligent Well Completion Industry Segmentation
- 1. Production Analysis
- 2. Consumption Analysis
- 3. Import Market Analysis (Value & Volume)
- 4. Export Market Analysis (Value & Volume)
- 5. Price Trend Analysis
Intelligent Well Completion Industry Segmentation By Geography
- 1. North America
- 2. Europe
- 3. Asia Pacific
- 4. South America
- 5. Middle East and Africa
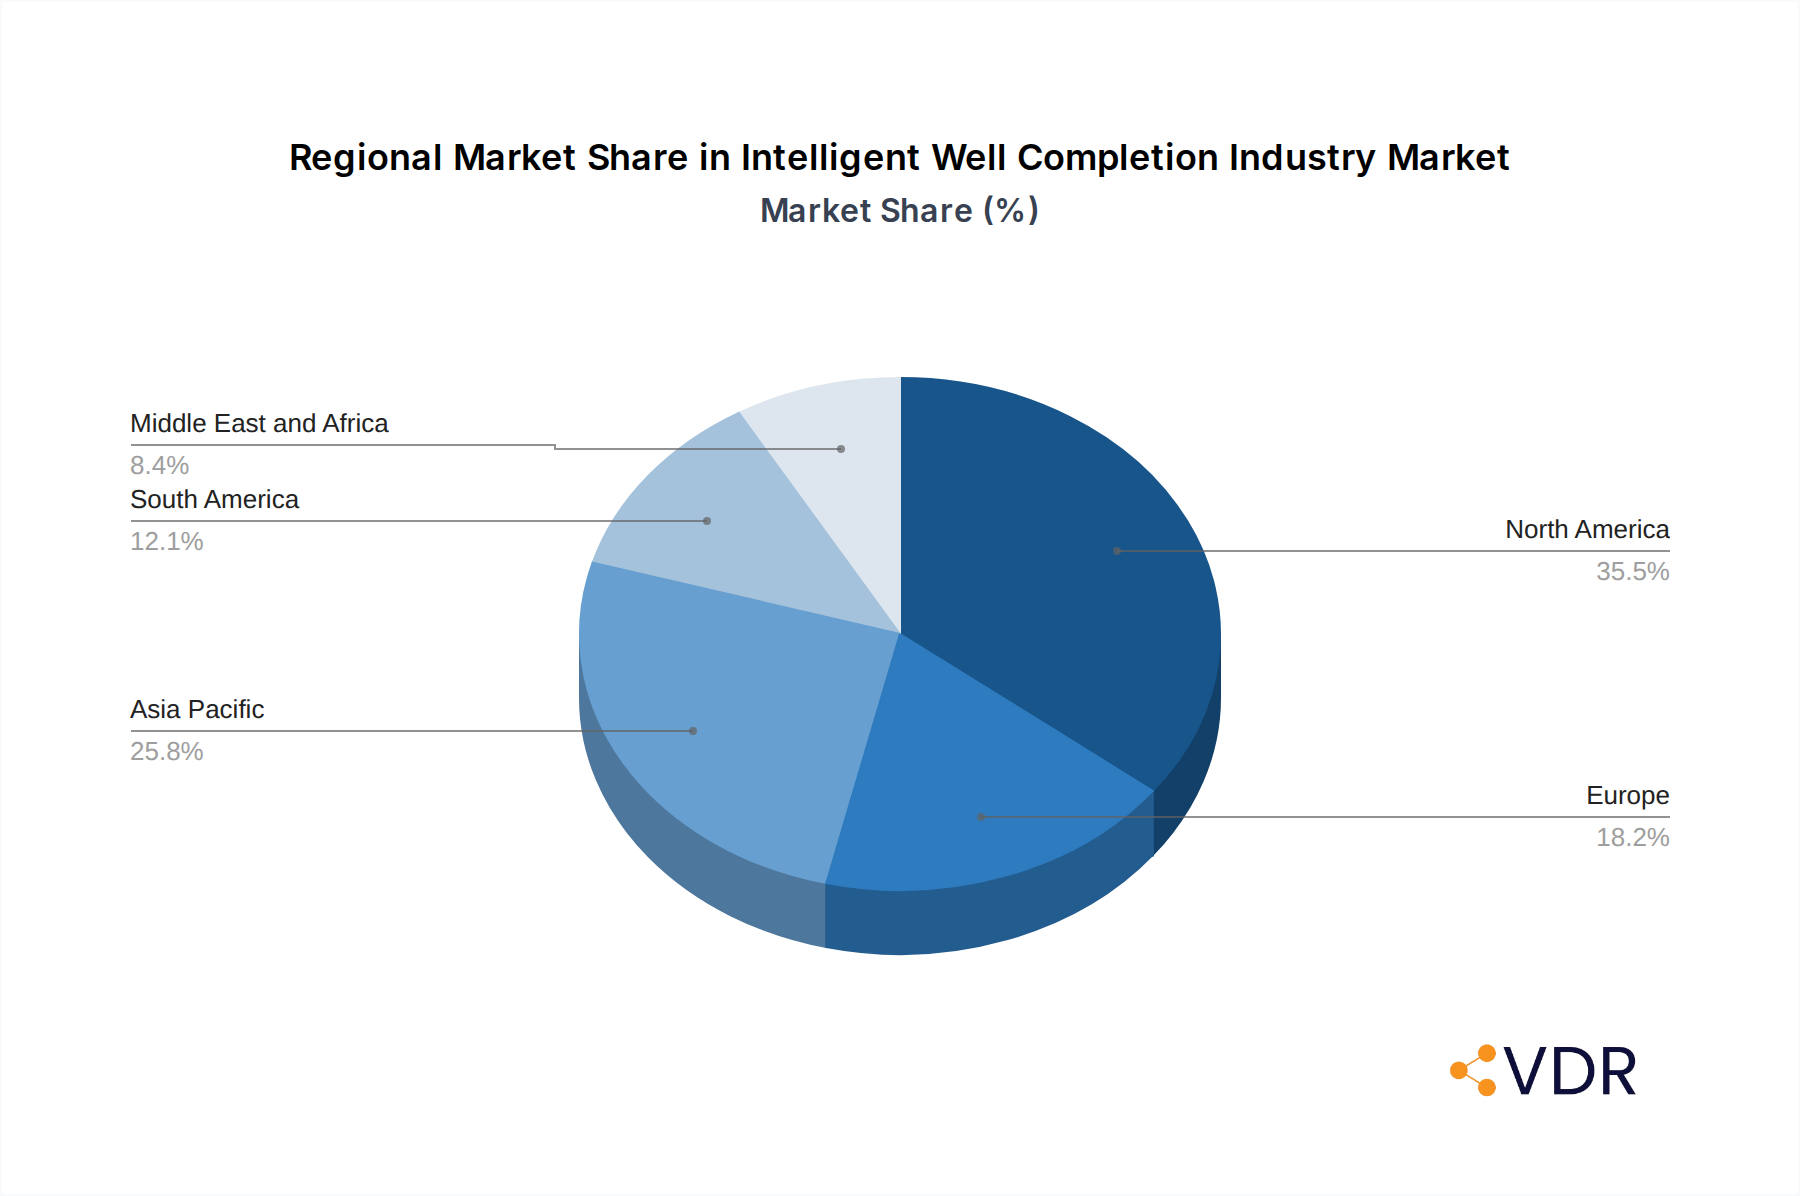
Intelligent Well Completion Industry Regional Market Share
Geographic Coverage of Intelligent Well Completion Industry
Intelligent Well Completion Industry REPORT HIGHLIGHTS
| Aspects | Details |
|---|---|
| Study Period | 2020-2034 |
| Base Year | 2025 |
| Estimated Year | 2026 |
| Forecast Period | 2026-2034 |
| Historical Period | 2020-2025 |
| Growth Rate | CAGR of 7.2% from 2020-2034 |
| Segmentation |
|
Table of Contents
- 1. Introduction
- 1.1. Research Scope
- 1.2. Market Segmentation
- 1.3. Research Objective
- 1.4. Definitions and Assumptions
- 2. Executive Summary
- 2.1. Market Snapshot
- 3. Market Dynamics
- 3.1. Market Drivers
- 3.2. Market Restrains
- 3.3. Market Trends
- 3.4. Market Opportunities
- 4. Market Factor Analysis
- 4.1. Porters Five Forces
- 4.1.1. Bargaining Power of Suppliers
- 4.1.2. Bargaining Power of Buyers
- 4.1.3. Threat of New Entrants
- 4.1.4. Threat of Substitutes
- 4.1.5. Competitive Rivalry
- 4.2. PESTEL analysis
- 4.3. BCG Analysis
- 4.3.1. Stars (High Growth, High Market Share)
- 4.3.2. Cash Cows (Low Growth, High Market Share)
- 4.3.3. Question Mark (High Growth, Low Market Share)
- 4.3.4. Dogs (Low Growth, Low Market Share)
- 4.4. Ansoff Matrix Analysis
- 4.5. Supply Chain Analysis
- 4.6. Regulatory Landscape
- 4.7. Current Market Potential and Opportunity Assessment (TAM–SAM–SOM Framework)
- 4.8. VDR Analyst Note
- 4.1. Porters Five Forces
- 5. Market Analysis, Insights and Forecast 2021-2033
- 5.1. Market Analysis, Insights and Forecast - by Production Analysis
- 5.2. Market Analysis, Insights and Forecast - by Consumption Analysis
- 5.3. Market Analysis, Insights and Forecast - by Import Market Analysis (Value & Volume)
- 5.4. Market Analysis, Insights and Forecast - by Export Market Analysis (Value & Volume)
- 5.5. Market Analysis, Insights and Forecast - by Price Trend Analysis
- 5.6. Market Analysis, Insights and Forecast - by Region
- 5.6.1. North America
- 5.6.2. Europe
- 5.6.3. Asia Pacific
- 5.6.4. South America
- 5.6.5. Middle East and Africa
- 6. Global Intelligent Well Completion Industry Analysis, Insights and Forecast, 2021-2033
- 6.1. Market Analysis, Insights and Forecast - by Production Analysis
- 6.2. Market Analysis, Insights and Forecast - by Consumption Analysis
- 6.3. Market Analysis, Insights and Forecast - by Import Market Analysis (Value & Volume)
- 6.4. Market Analysis, Insights and Forecast - by Export Market Analysis (Value & Volume)
- 6.5. Market Analysis, Insights and Forecast - by Price Trend Analysis
- 7. North America Intelligent Well Completion Industry Analysis, Insights and Forecast, 2021-2033
- 7.1. Market Analysis, Insights and Forecast - by Production Analysis
- 7.2. Market Analysis, Insights and Forecast - by Consumption Analysis
- 7.3. Market Analysis, Insights and Forecast - by Import Market Analysis (Value & Volume)
- 7.4. Market Analysis, Insights and Forecast - by Export Market Analysis (Value & Volume)
- 7.5. Market Analysis, Insights and Forecast - by Price Trend Analysis
- 8. Europe Intelligent Well Completion Industry Analysis, Insights and Forecast, 2021-2033
- 8.1. Market Analysis, Insights and Forecast - by Production Analysis
- 8.2. Market Analysis, Insights and Forecast - by Consumption Analysis
- 8.3. Market Analysis, Insights and Forecast - by Import Market Analysis (Value & Volume)
- 8.4. Market Analysis, Insights and Forecast - by Export Market Analysis (Value & Volume)
- 8.5. Market Analysis, Insights and Forecast - by Price Trend Analysis
- 9. Asia Pacific Intelligent Well Completion Industry Analysis, Insights and Forecast, 2021-2033
- 9.1. Market Analysis, Insights and Forecast - by Production Analysis
- 9.2. Market Analysis, Insights and Forecast - by Consumption Analysis
- 9.3. Market Analysis, Insights and Forecast - by Import Market Analysis (Value & Volume)
- 9.4. Market Analysis, Insights and Forecast - by Export Market Analysis (Value & Volume)
- 9.5. Market Analysis, Insights and Forecast - by Price Trend Analysis
- 10. South America Intelligent Well Completion Industry Analysis, Insights and Forecast, 2021-2033
- 10.1. Market Analysis, Insights and Forecast - by Production Analysis
- 10.2. Market Analysis, Insights and Forecast - by Consumption Analysis
- 10.3. Market Analysis, Insights and Forecast - by Import Market Analysis (Value & Volume)
- 10.4. Market Analysis, Insights and Forecast - by Export Market Analysis (Value & Volume)
- 10.5. Market Analysis, Insights and Forecast - by Price Trend Analysis
- 11. Middle East and Africa Intelligent Well Completion Industry Analysis, Insights and Forecast, 2021-2033
- 11.1. Market Analysis, Insights and Forecast - by Production Analysis
- 11.2. Market Analysis, Insights and Forecast - by Consumption Analysis
- 11.3. Market Analysis, Insights and Forecast - by Import Market Analysis (Value & Volume)
- 11.4. Market Analysis, Insights and Forecast - by Export Market Analysis (Value & Volume)
- 11.5. Market Analysis, Insights and Forecast - by Price Trend Analysis
- 12. Competitive Analysis
- 12.1. Company Profiles
- 12.1.1 Superior Energy Services Inc
- 12.1.1.1. Company Overview
- 12.1.1.2. Products
- 12.1.1.3. Company Financials
- 12.1.1.4. SWOT Analysis
- 12.1.2 Trican Well Service Ltd
- 12.1.2.1. Company Overview
- 12.1.2.2. Products
- 12.1.2.3. Company Financials
- 12.1.2.4. SWOT Analysis
- 12.1.3 Weir Group PLC
- 12.1.3.1. Company Overview
- 12.1.3.2. Products
- 12.1.3.3. Company Financials
- 12.1.3.4. SWOT Analysis
- 12.1.4 Weatherford International plc
- 12.1.4.1. Company Overview
- 12.1.4.2. Products
- 12.1.4.3. Company Financials
- 12.1.4.4. SWOT Analysis
- 12.1.5 Schlumberger Ltd
- 12.1.5.1. Company Overview
- 12.1.5.2. Products
- 12.1.5.3. Company Financials
- 12.1.5.4. SWOT Analysis
- 12.1.6 Packers Plus Energy Services Inc
- 12.1.6.1. Company Overview
- 12.1.6.2. Products
- 12.1.6.3. Company Financials
- 12.1.6.4. SWOT Analysis
- 12.1.7 Baker Hughes Company
- 12.1.7.1. Company Overview
- 12.1.7.2. Products
- 12.1.7.3. Company Financials
- 12.1.7.4. SWOT Analysis
- 12.1.8 Halliburton Company
- 12.1.8.1. Company Overview
- 12.1.8.2. Products
- 12.1.8.3. Company Financials
- 12.1.8.4. SWOT Analysis
- 12.1.9 National-Oilwell Varco Inc
- 12.1.9.1. Company Overview
- 12.1.9.2. Products
- 12.1.9.3. Company Financials
- 12.1.9.4. SWOT Analysis
- 12.1.10 Schoeller-Bleckmann Oilfield Equipment AG
- 12.1.10.1. Company Overview
- 12.1.10.2. Products
- 12.1.10.3. Company Financials
- 12.1.10.4. SWOT Analysis
- 12.1.11 Welltec A/S*List Not Exhaustive
- 12.1.11.1. Company Overview
- 12.1.11.2. Products
- 12.1.11.3. Company Financials
- 12.1.11.4. SWOT Analysis
- 12.1.1 Superior Energy Services Inc
- 12.2. Market Entropy
- 12.2.1 Company's Key Areas Served
- 12.2.2 Recent Developments
- 12.3. Company Market Share Analysis 2025
- 12.3.1 Top 5 Companies Market Share Analysis
- 12.3.2 Top 3 Companies Market Share Analysis
- 12.4. List of Potential Customers
- 13. Research Methodology
List of Figures
- Figure 1: Global Intelligent Well Completion Industry Revenue Breakdown (billion, %) by Region 2025 & 2033
- Figure 2: North America Intelligent Well Completion Industry Revenue (billion), by Production Analysis 2025 & 2033
- Figure 3: North America Intelligent Well Completion Industry Revenue Share (%), by Production Analysis 2025 & 2033
- Figure 4: North America Intelligent Well Completion Industry Revenue (billion), by Consumption Analysis 2025 & 2033
- Figure 5: North America Intelligent Well Completion Industry Revenue Share (%), by Consumption Analysis 2025 & 2033
- Figure 6: North America Intelligent Well Completion Industry Revenue (billion), by Import Market Analysis (Value & Volume) 2025 & 2033
- Figure 7: North America Intelligent Well Completion Industry Revenue Share (%), by Import Market Analysis (Value & Volume) 2025 & 2033
- Figure 8: North America Intelligent Well Completion Industry Revenue (billion), by Export Market Analysis (Value & Volume) 2025 & 2033
- Figure 9: North America Intelligent Well Completion Industry Revenue Share (%), by Export Market Analysis (Value & Volume) 2025 & 2033
- Figure 10: North America Intelligent Well Completion Industry Revenue (billion), by Price Trend Analysis 2025 & 2033
- Figure 11: North America Intelligent Well Completion Industry Revenue Share (%), by Price Trend Analysis 2025 & 2033
- Figure 12: North America Intelligent Well Completion Industry Revenue (billion), by Country 2025 & 2033
- Figure 13: North America Intelligent Well Completion Industry Revenue Share (%), by Country 2025 & 2033
- Figure 14: Europe Intelligent Well Completion Industry Revenue (billion), by Production Analysis 2025 & 2033
- Figure 15: Europe Intelligent Well Completion Industry Revenue Share (%), by Production Analysis 2025 & 2033
- Figure 16: Europe Intelligent Well Completion Industry Revenue (billion), by Consumption Analysis 2025 & 2033
- Figure 17: Europe Intelligent Well Completion Industry Revenue Share (%), by Consumption Analysis 2025 & 2033
- Figure 18: Europe Intelligent Well Completion Industry Revenue (billion), by Import Market Analysis (Value & Volume) 2025 & 2033
- Figure 19: Europe Intelligent Well Completion Industry Revenue Share (%), by Import Market Analysis (Value & Volume) 2025 & 2033
- Figure 20: Europe Intelligent Well Completion Industry Revenue (billion), by Export Market Analysis (Value & Volume) 2025 & 2033
- Figure 21: Europe Intelligent Well Completion Industry Revenue Share (%), by Export Market Analysis (Value & Volume) 2025 & 2033
- Figure 22: Europe Intelligent Well Completion Industry Revenue (billion), by Price Trend Analysis 2025 & 2033
- Figure 23: Europe Intelligent Well Completion Industry Revenue Share (%), by Price Trend Analysis 2025 & 2033
- Figure 24: Europe Intelligent Well Completion Industry Revenue (billion), by Country 2025 & 2033
- Figure 25: Europe Intelligent Well Completion Industry Revenue Share (%), by Country 2025 & 2033
- Figure 26: Asia Pacific Intelligent Well Completion Industry Revenue (billion), by Production Analysis 2025 & 2033
- Figure 27: Asia Pacific Intelligent Well Completion Industry Revenue Share (%), by Production Analysis 2025 & 2033
- Figure 28: Asia Pacific Intelligent Well Completion Industry Revenue (billion), by Consumption Analysis 2025 & 2033
- Figure 29: Asia Pacific Intelligent Well Completion Industry Revenue Share (%), by Consumption Analysis 2025 & 2033
- Figure 30: Asia Pacific Intelligent Well Completion Industry Revenue (billion), by Import Market Analysis (Value & Volume) 2025 & 2033
- Figure 31: Asia Pacific Intelligent Well Completion Industry Revenue Share (%), by Import Market Analysis (Value & Volume) 2025 & 2033
- Figure 32: Asia Pacific Intelligent Well Completion Industry Revenue (billion), by Export Market Analysis (Value & Volume) 2025 & 2033
- Figure 33: Asia Pacific Intelligent Well Completion Industry Revenue Share (%), by Export Market Analysis (Value & Volume) 2025 & 2033
- Figure 34: Asia Pacific Intelligent Well Completion Industry Revenue (billion), by Price Trend Analysis 2025 & 2033
- Figure 35: Asia Pacific Intelligent Well Completion Industry Revenue Share (%), by Price Trend Analysis 2025 & 2033
- Figure 36: Asia Pacific Intelligent Well Completion Industry Revenue (billion), by Country 2025 & 2033
- Figure 37: Asia Pacific Intelligent Well Completion Industry Revenue Share (%), by Country 2025 & 2033
- Figure 38: South America Intelligent Well Completion Industry Revenue (billion), by Production Analysis 2025 & 2033
- Figure 39: South America Intelligent Well Completion Industry Revenue Share (%), by Production Analysis 2025 & 2033
- Figure 40: South America Intelligent Well Completion Industry Revenue (billion), by Consumption Analysis 2025 & 2033
- Figure 41: South America Intelligent Well Completion Industry Revenue Share (%), by Consumption Analysis 2025 & 2033
- Figure 42: South America Intelligent Well Completion Industry Revenue (billion), by Import Market Analysis (Value & Volume) 2025 & 2033
- Figure 43: South America Intelligent Well Completion Industry Revenue Share (%), by Import Market Analysis (Value & Volume) 2025 & 2033
- Figure 44: South America Intelligent Well Completion Industry Revenue (billion), by Export Market Analysis (Value & Volume) 2025 & 2033
- Figure 45: South America Intelligent Well Completion Industry Revenue Share (%), by Export Market Analysis (Value & Volume) 2025 & 2033
- Figure 46: South America Intelligent Well Completion Industry Revenue (billion), by Price Trend Analysis 2025 & 2033
- Figure 47: South America Intelligent Well Completion Industry Revenue Share (%), by Price Trend Analysis 2025 & 2033
- Figure 48: South America Intelligent Well Completion Industry Revenue (billion), by Country 2025 & 2033
- Figure 49: South America Intelligent Well Completion Industry Revenue Share (%), by Country 2025 & 2033
- Figure 50: Middle East and Africa Intelligent Well Completion Industry Revenue (billion), by Production Analysis 2025 & 2033
- Figure 51: Middle East and Africa Intelligent Well Completion Industry Revenue Share (%), by Production Analysis 2025 & 2033
- Figure 52: Middle East and Africa Intelligent Well Completion Industry Revenue (billion), by Consumption Analysis 2025 & 2033
- Figure 53: Middle East and Africa Intelligent Well Completion Industry Revenue Share (%), by Consumption Analysis 2025 & 2033
- Figure 54: Middle East and Africa Intelligent Well Completion Industry Revenue (billion), by Import Market Analysis (Value & Volume) 2025 & 2033
- Figure 55: Middle East and Africa Intelligent Well Completion Industry Revenue Share (%), by Import Market Analysis (Value & Volume) 2025 & 2033
- Figure 56: Middle East and Africa Intelligent Well Completion Industry Revenue (billion), by Export Market Analysis (Value & Volume) 2025 & 2033
- Figure 57: Middle East and Africa Intelligent Well Completion Industry Revenue Share (%), by Export Market Analysis (Value & Volume) 2025 & 2033
- Figure 58: Middle East and Africa Intelligent Well Completion Industry Revenue (billion), by Price Trend Analysis 2025 & 2033
- Figure 59: Middle East and Africa Intelligent Well Completion Industry Revenue Share (%), by Price Trend Analysis 2025 & 2033
- Figure 60: Middle East and Africa Intelligent Well Completion Industry Revenue (billion), by Country 2025 & 2033
- Figure 61: Middle East and Africa Intelligent Well Completion Industry Revenue Share (%), by Country 2025 & 2033
List of Tables
- Table 1: Global Intelligent Well Completion Industry Revenue billion Forecast, by Production Analysis 2020 & 2033
- Table 2: Global Intelligent Well Completion Industry Revenue billion Forecast, by Consumption Analysis 2020 & 2033
- Table 3: Global Intelligent Well Completion Industry Revenue billion Forecast, by Import Market Analysis (Value & Volume) 2020 & 2033
- Table 4: Global Intelligent Well Completion Industry Revenue billion Forecast, by Export Market Analysis (Value & Volume) 2020 & 2033
- Table 5: Global Intelligent Well Completion Industry Revenue billion Forecast, by Price Trend Analysis 2020 & 2033
- Table 6: Global Intelligent Well Completion Industry Revenue billion Forecast, by Region 2020 & 2033
- Table 7: Global Intelligent Well Completion Industry Revenue billion Forecast, by Production Analysis 2020 & 2033
- Table 8: Global Intelligent Well Completion Industry Revenue billion Forecast, by Consumption Analysis 2020 & 2033
- Table 9: Global Intelligent Well Completion Industry Revenue billion Forecast, by Import Market Analysis (Value & Volume) 2020 & 2033
- Table 10: Global Intelligent Well Completion Industry Revenue billion Forecast, by Export Market Analysis (Value & Volume) 2020 & 2033
- Table 11: Global Intelligent Well Completion Industry Revenue billion Forecast, by Price Trend Analysis 2020 & 2033
- Table 12: Global Intelligent Well Completion Industry Revenue billion Forecast, by Country 2020 & 2033
- Table 13: Global Intelligent Well Completion Industry Revenue billion Forecast, by Production Analysis 2020 & 2033
- Table 14: Global Intelligent Well Completion Industry Revenue billion Forecast, by Consumption Analysis 2020 & 2033
- Table 15: Global Intelligent Well Completion Industry Revenue billion Forecast, by Import Market Analysis (Value & Volume) 2020 & 2033
- Table 16: Global Intelligent Well Completion Industry Revenue billion Forecast, by Export Market Analysis (Value & Volume) 2020 & 2033
- Table 17: Global Intelligent Well Completion Industry Revenue billion Forecast, by Price Trend Analysis 2020 & 2033
- Table 18: Global Intelligent Well Completion Industry Revenue billion Forecast, by Country 2020 & 2033
- Table 19: Global Intelligent Well Completion Industry Revenue billion Forecast, by Production Analysis 2020 & 2033
- Table 20: Global Intelligent Well Completion Industry Revenue billion Forecast, by Consumption Analysis 2020 & 2033
- Table 21: Global Intelligent Well Completion Industry Revenue billion Forecast, by Import Market Analysis (Value & Volume) 2020 & 2033
- Table 22: Global Intelligent Well Completion Industry Revenue billion Forecast, by Export Market Analysis (Value & Volume) 2020 & 2033
- Table 23: Global Intelligent Well Completion Industry Revenue billion Forecast, by Price Trend Analysis 2020 & 2033
- Table 24: Global Intelligent Well Completion Industry Revenue billion Forecast, by Country 2020 & 2033
- Table 25: Global Intelligent Well Completion Industry Revenue billion Forecast, by Production Analysis 2020 & 2033
- Table 26: Global Intelligent Well Completion Industry Revenue billion Forecast, by Consumption Analysis 2020 & 2033
- Table 27: Global Intelligent Well Completion Industry Revenue billion Forecast, by Import Market Analysis (Value & Volume) 2020 & 2033
- Table 28: Global Intelligent Well Completion Industry Revenue billion Forecast, by Export Market Analysis (Value & Volume) 2020 & 2033
- Table 29: Global Intelligent Well Completion Industry Revenue billion Forecast, by Price Trend Analysis 2020 & 2033
- Table 30: Global Intelligent Well Completion Industry Revenue billion Forecast, by Country 2020 & 2033
- Table 31: Global Intelligent Well Completion Industry Revenue billion Forecast, by Production Analysis 2020 & 2033
- Table 32: Global Intelligent Well Completion Industry Revenue billion Forecast, by Consumption Analysis 2020 & 2033
- Table 33: Global Intelligent Well Completion Industry Revenue billion Forecast, by Import Market Analysis (Value & Volume) 2020 & 2033
- Table 34: Global Intelligent Well Completion Industry Revenue billion Forecast, by Export Market Analysis (Value & Volume) 2020 & 2033
- Table 35: Global Intelligent Well Completion Industry Revenue billion Forecast, by Price Trend Analysis 2020 & 2033
- Table 36: Global Intelligent Well Completion Industry Revenue billion Forecast, by Country 2020 & 2033
Frequently Asked Questions
1. What is the projected Compound Annual Growth Rate (CAGR) of the Intelligent Well Completion Industry?
The projected CAGR is approximately 7.2%.
2. Which companies are prominent players in the Intelligent Well Completion Industry?
Key companies in the market include Superior Energy Services Inc, Trican Well Service Ltd, Weir Group PLC, Weatherford International plc, Schlumberger Ltd, Packers Plus Energy Services Inc, Baker Hughes Company, Halliburton Company, National-Oilwell Varco Inc, Schoeller-Bleckmann Oilfield Equipment AG, Welltec A/S*List Not Exhaustive.
3. What are the main segments of the Intelligent Well Completion Industry?
The market segments include Production Analysis, Consumption Analysis, Import Market Analysis (Value & Volume), Export Market Analysis (Value & Volume), Price Trend Analysis.
4. Can you provide details about the market size?
The market size is estimated to be USD 2.57 billion as of 2022.
5. What are some drivers contributing to market growth?
4.; Global Inclination toward Renewable-based Power Generation4.; Increased Power Demand in Line with the Increasing Population.
6. What are the notable trends driving market growth?
Offshore to be the Fastest Growing Segment.
7. Are there any restraints impacting market growth?
4.; High Initial Cost.
8. Can you provide examples of recent developments in the market?
April 2022: Halliburton introduced StrataSta, a deep azimuthal resistivity service that provides multilayer visualization to maximize well contact with the reservoir and improve real-time reserve evaluation. The StrataStar service is an addition to Halliburton's iStar intelligent drilling and logging platform.
9. What pricing options are available for accessing the report?
Pricing options include single-user, multi-user, and enterprise licenses priced at USD 4750, USD 5250, and USD 8750 respectively.
10. Is the market size provided in terms of value or volume?
The market size is provided in terms of value, measured in billion.
11. Are there any specific market keywords associated with the report?
Yes, the market keyword associated with the report is "Intelligent Well Completion Industry," which aids in identifying and referencing the specific market segment covered.
12. How do I determine which pricing option suits my needs best?
The pricing options vary based on user requirements and access needs. Individual users may opt for single-user licenses, while businesses requiring broader access may choose multi-user or enterprise licenses for cost-effective access to the report.
13. Are there any additional resources or data provided in the Intelligent Well Completion Industry report?
While the report offers comprehensive insights, it's advisable to review the specific contents or supplementary materials provided to ascertain if additional resources or data are available.
14. How can I stay updated on further developments or reports in the Intelligent Well Completion Industry?
To stay informed about further developments, trends, and reports in the Intelligent Well Completion Industry, consider subscribing to industry newsletters, following relevant companies and organizations, or regularly checking reputable industry news sources and publications.
Methodology
Step 1 - Identification of Relevant Samples Size from Population Database


Step 2 - Approaches for Defining Global Market Size (Value, Volume* & Price*)

Note*: In applicable scenarios
Step 3 - Data Sources
Primary Research
- Web Analytics
- Survey Reports
- Research Institute
- Latest Research Reports
- Opinion Leaders
Secondary Research
- Annual Reports
- White Paper
- Latest Press Release
- Industry Association
- Paid Database
- Investor Presentations

Step 4 - Data Triangulation
Involves using different sources of information in order to increase the validity of a study
These sources are likely to be stakeholders in a program - participants, other researchers, program staff, other community members, and so on.
Then we put all data in single framework & apply various statistical tools to find out the dynamic on the market.
During the analysis stage, feedback from the stakeholder groups would be compared to determine areas of agreement as well as areas of divergence