

Key Insights
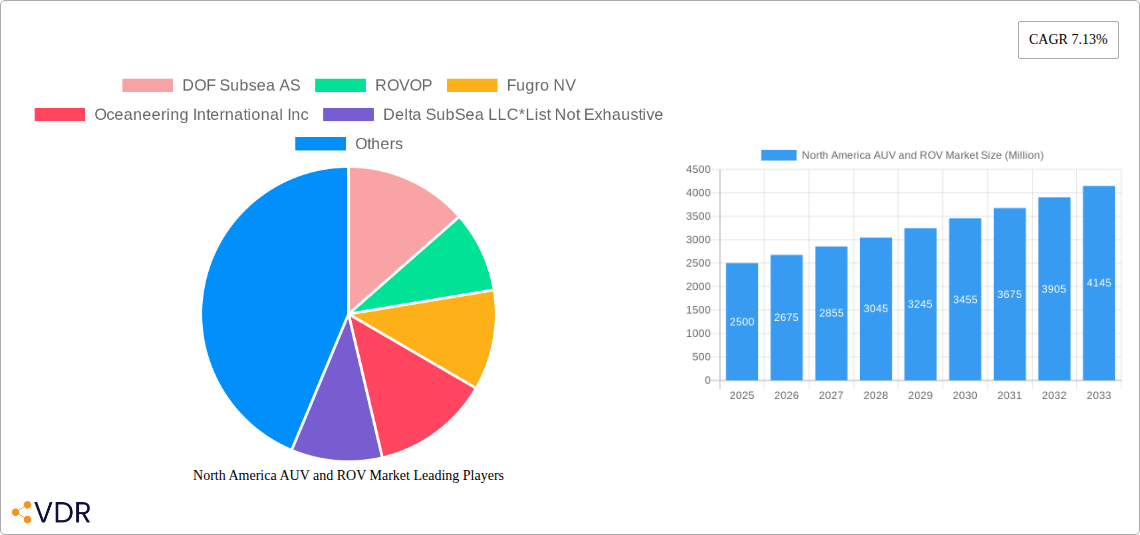
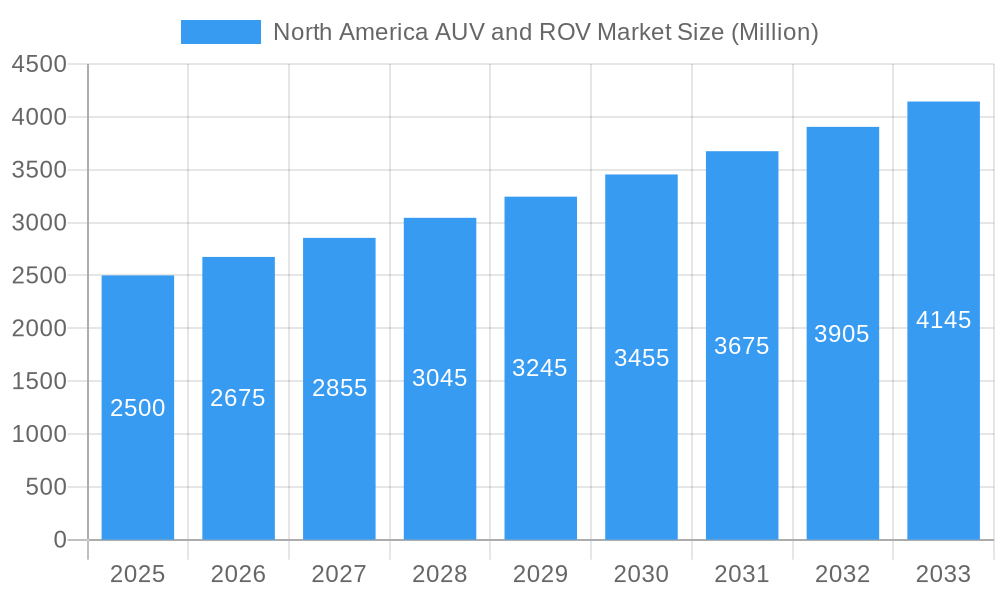
The North America AUV (Autonomous Underwater Vehicle) and ROV (Remotely Operated Vehicle) market is poised for significant expansion, projected to reach USD 2.5 billion in 2025. This robust growth is underpinned by a compelling CAGR of 7.13% during the forecast period of 2025-2033. The sector is driven by increasing demand for efficient and advanced subsea operations, particularly within the oil and gas industry, where exploration and production activities necessitate sophisticated underwater exploration and maintenance. Defense applications are also a considerable growth catalyst, with the need for advanced surveillance, mine countermeasures, and seabed mapping driving innovation and adoption of AUVs and ROVs. Furthermore, the expanding offshore renewable energy sector, particularly offshore wind farms, requires these vehicles for survey, installation, and maintenance, contributing to market momentum.
North America AUV and ROV Market Market Size (In Billion)
The market is segmented across various vehicle types, including ROVs and AUVs, with a notable emphasis on work-class and observatory-class vehicles for their versatility and capability in complex subsea environments. Key activities fueling this growth encompass drilling and development, construction, and critical inspection, repair, and maintenance (IRM) operations. The decommissioning of aging offshore infrastructure also presents a growing opportunity. Geographically, the United States, Canada, and the rest of North America are the primary markets, with ongoing investments in subsea infrastructure and resource exploration. Restraints, such as the high initial cost of advanced AUV/ROV systems and the stringent regulatory landscape for offshore operations, are being addressed through technological advancements and evolving industry practices, suggesting a dynamic and opportunity-rich market landscape.
North America AUV and ROV Market Company Market Share
This comprehensive report provides an in-depth analysis of the North America Autonomous Underwater Vehicle (AUV) and Remotely Operated Vehicle (ROV) market, a critical sector for offshore operations, defense, and scientific research. Delve into market dynamics, growth trends, and regional dominance from 2019 to 2033, with a base year of 2025. This report will equip industry professionals with the insights needed to navigate this rapidly evolving landscape and capitalize on emerging opportunities.
North America AUV and ROV Market Market Dynamics & Structure
The North American AUV and ROV market exhibits a moderate to high concentration, driven by significant technological innovation and substantial investment in offshore exploration and defense. Key drivers include advancements in artificial intelligence for enhanced autonomy, improved sensor technologies for richer data acquisition, and increasing demand for efficient subsea inspection and maintenance solutions. Regulatory frameworks, particularly concerning environmental protection and safety in offshore operations, influence deployment strategies and operational protocols. Competitive product substitutes, while limited in direct functionality, include manned submersibles and surface-based inspection methods. End-user demographics are increasingly sophisticated, demanding higher performance, reliability, and cost-effectiveness. Mergers and acquisitions (M&A) activity remains a strategic tool for market players to expand their service portfolios, geographical reach, and technological capabilities, consolidating market share and fostering competitive advantages.
- Market Concentration: Moderate to High, with key players investing heavily in R&D and strategic acquisitions.
- Technological Innovation Drivers: AI integration, advanced sonar and imaging, energy efficiency, data analytics, and miniaturization of AUV/ROV systems.
- Regulatory Frameworks: Environmental impact assessments, offshore safety regulations, and defense procurement policies.
- Competitive Product Substitutes: Manned submersibles, diver-based inspections, and advanced surface unmanned systems.
- End-User Demographics: Growing demand for autonomous capabilities, real-time data, and integrated service offerings.
- M&A Trends: Focus on acquiring niche technologies, expanding service offerings in inspection, repair, and maintenance (IRM), and strengthening presence in the defense sector.
North America AUV and ROV Market Growth Trends & Insights
The North America AUV and ROV market is projected for robust growth, driven by escalating demand across its primary applications. The oil and gas industry continues to be a dominant force, necessitating advanced subsea solutions for exploration, drilling, development, and decommissioning of offshore assets. The increasing complexity and depth of these operations, coupled with the drive for enhanced safety and reduced environmental impact, are fueling the adoption of both AUVs and ROVs. Furthermore, the defense sector is experiencing a significant surge in investment, particularly in naval applications for surveillance, mine countermeasures, and seabed warfare. This demand is amplified by geopolitical considerations and the need for persistent underwater presence. Technological advancements, including improvements in battery life, payload capacity, maneuverability, and real-time data transmission, are expanding the operational envelopes and application possibilities for these unmanned systems. Consumer behavior shifts are also noteworthy, with an increasing preference for integrated service solutions that combine hardware, software, and specialized operational expertise, leading to a greater demand for comprehensive subsea solutions providers. The market penetration of AUVs is steadily increasing as their autonomous capabilities allow for longer duration missions and wider area surveys, complementing the role of ROVs in intricate intervention tasks.
Dominant Regions, Countries, or Segments in North America AUV and ROV Market
The United States stands as the dominant region within the North America AUV and ROV market, propelled by its extensive coastline, significant offshore oil and gas activities in the Gulf of Mexico, and substantial investments in naval defense capabilities. The Oil and Gas application segment, specifically for Drilling and Development and Inspection, Repair, and Maintenance (IRM) activities, represents a core driver of this dominance. The sheer volume of offshore infrastructure requiring continuous monitoring and servicing ensures a sustained demand for both ROVs and AUVs. Within the vehicle types, ROVs, particularly Work-class Vehicles, continue to hold a significant market share due to their versatile capabilities in performing complex intervention tasks such as installation, construction, and repair. However, the adoption of AUVs is witnessing a steady rise, especially for survey and mapping operations, owing to their efficiency in covering larger areas autonomously.
The Defense application segment in the United States is another critical growth engine. The U.S. Navy's continuous modernization efforts and its global operational requirements are driving substantial procurements of AUVs and ROVs for a wide array of missions, including intelligence, surveillance, reconnaissance (ISR), mine countermeasures (MCM), and underwater security. This segment is characterized by high-value contracts and a constant push for cutting-edge technological advancements. Geographically, beyond the established offshore regions, the market is also seeing increased activity in other coastal areas for infrastructure inspection and environmental monitoring.
- Dominant Country: United States, owing to its vast offshore energy resources and robust defense sector.
- Leading Application Segment: Oil and Gas, with strong demand for Drilling and Development and Inspection, Repair, and Maintenance (IRM).
- Key Vehicle Segment: Work-class ROVs remain dominant for intervention tasks, while AUVs are increasingly vital for survey and mapping.
- Growth in Defense: Significant government investment in naval capabilities is a major growth accelerator.
- Emerging Trends: Growing interest in observatory-class vehicles for long-term scientific data collection and monitoring.
North America AUV and ROV Market Product Landscape
The North America AUV and ROV market is characterized by a dynamic product landscape driven by continuous innovation. Manufacturers are focusing on developing vehicles with enhanced payload capacities, longer endurance, improved maneuverability in complex environments, and sophisticated sensor integration. Key advancements include AI-powered navigation and obstacle avoidance systems, high-resolution imaging and sonar technologies for detailed data acquisition, and modular designs allowing for rapid customization and mission adaptability. Unique selling propositions often revolve around the robustness of the systems for harsh offshore conditions, their ease of deployment and operation, and the comprehensive data processing capabilities they offer.
Key Drivers, Barriers & Challenges in North America AUV and ROV Market
Key Drivers:
- Increasing offshore oil and gas exploration and production: The ongoing need for subsea infrastructure development and maintenance in deep and challenging environments.
- Growing defense spending: Governments are investing heavily in naval technologies, including AUVs and ROVs for surveillance, security, and operational advantage.
- Technological advancements: Continuous improvements in autonomy, sensors, battery life, and data processing are expanding capabilities and applications.
- Demand for cost-efficiency and safety: AUVs and ROVs offer a safer and often more cost-effective alternative to manned operations.
Barriers & Challenges:
- High initial investment cost: The upfront cost of advanced AUV and ROV systems can be a significant barrier for smaller companies.
- Skilled workforce shortage: A lack of trained personnel to operate and maintain these sophisticated systems.
- Harsh operating environments: Extreme weather conditions and deep-sea pressures pose operational challenges.
- Data management and security: Handling and securing the vast amounts of data generated by these vehicles.
- Supply chain disruptions: Global supply chain issues can impact the availability of components and lead to project delays.
Emerging Opportunities in North America AUV and ROV Market
Emerging opportunities in the North America AUV and ROV market are expanding beyond traditional sectors. The growing focus on offshore renewable energy, particularly wind farms, presents a substantial demand for inspection, installation, and maintenance of subsea foundations and cabling. Scientific research and oceanographic surveys are increasingly leveraging AUVs for long-term environmental monitoring, climate change studies, and marine biodiversity mapping. Furthermore, the development of "smart" subsea infrastructure, including pipelines and cables, will require advanced AUV/ROV capabilities for continuous monitoring and proactive maintenance. The increasing interest in aquaculture and underwater resource exploration (e.g., minerals) also represents nascent but promising markets.
Growth Accelerators in the North America AUV and ROV Market Industry
Key growth accelerators for the North America AUV and ROV market include sustained government investment in defense modernization, particularly the U.S. Navy's focus on unmanned systems. The accelerating transition to renewable energy sources, with significant offshore wind farm development, will drive demand for specialized subsea inspection and construction vehicles. Advancements in AI and machine learning are enabling greater autonomy, leading to more efficient and complex missions, thereby expanding the utility of these systems. Strategic partnerships between technology providers and end-users, such as service companies and operators, will foster innovation and accelerate market adoption by tailoring solutions to specific operational needs.
Key Players Shaping the North America AUV and ROV Market Market
- DOF Subsea AS
- ROVOP
- Fugro NV
- Oceaneering International Inc
- Delta SubSea LLC
- Saipem SpA
- DeepOcean AS
- Helix Energy Solutions Group
- Forum Energy Technologies Inc
- TechnipFMC PLC
Notable Milestones in North America AUV and ROV Market Sector
- August 2022: VideoRay, LLC, reported a large and diverse order for its Defender remotely operated vehicles (ROVs) by the United States Navy. The Navy is standardizing on VideoRay Defender Mission Specialist systems due to the superior capabilities, flexibility and upgradeability of many systems deployed since 2019. VideoRay's customer support of the Navy includes training facilities and staffing on the East Coast in Pottstown, Pennsylvania, and the West Coast in San Diego.
- March 2021: Oceaneering International, Inc. announces that Subsea Robotics (SSR) and Offshore Projects Group (OPG) awarded an integrated rig services contract for covering the Khaleesi/Mormont and Samurai fields in the United States Gulf of Mexico. The scope of work includes providing remotely operated vehicles (ROVs) with collocated ROV tooling and technicians, remote positioning and metrology survey resources, installation and workover control system (IWOCS) equipment, and technicians.
In-Depth North America AUV and ROV Market Market Outlook
The future of the North America AUV and ROV market is exceptionally bright, characterized by continued technological evolution and expanding application frontiers. The synergy between AUVs and ROVs, offering both wide-area survey and precise intervention capabilities, will be a key growth driver. Increased adoption of these unmanned systems in the burgeoning offshore wind sector and for critical infrastructure monitoring will diversify market revenue streams beyond traditional oil and gas. The ongoing advancements in artificial intelligence and sensor technology will unlock new possibilities for complex subsea operations, from deep-sea scientific research to novel resource extraction. Strategic collaborations and a focus on integrated service solutions will be crucial for market players to capitalize on these evolving opportunities and secure long-term growth.
North America AUV and ROV Market Segmentation
-
1. Vehicle Type
- 1.1. ROV
- 1.2. AUV
-
2. Vehicle Class
- 2.1. Work-class Vehicle
- 2.2. Observatory-class Vehicle
-
3. Application
- 3.1. Oil and Gas
- 3.2. Defense
- 3.3. Other Applications
-
4. Activity
- 4.1. Drilling and Development
- 4.2. Construction
- 4.3. Inspection, Repair, and Maintenance
- 4.4. Decommissioning
- 4.5. Other Activities
-
5. Geography
- 5.1. United States
- 5.2. Canada
- 5.3. Rest of North America
North America AUV and ROV Market Segmentation By Geography
- 1. United States
- 2. Canada
- 3. Rest of North America
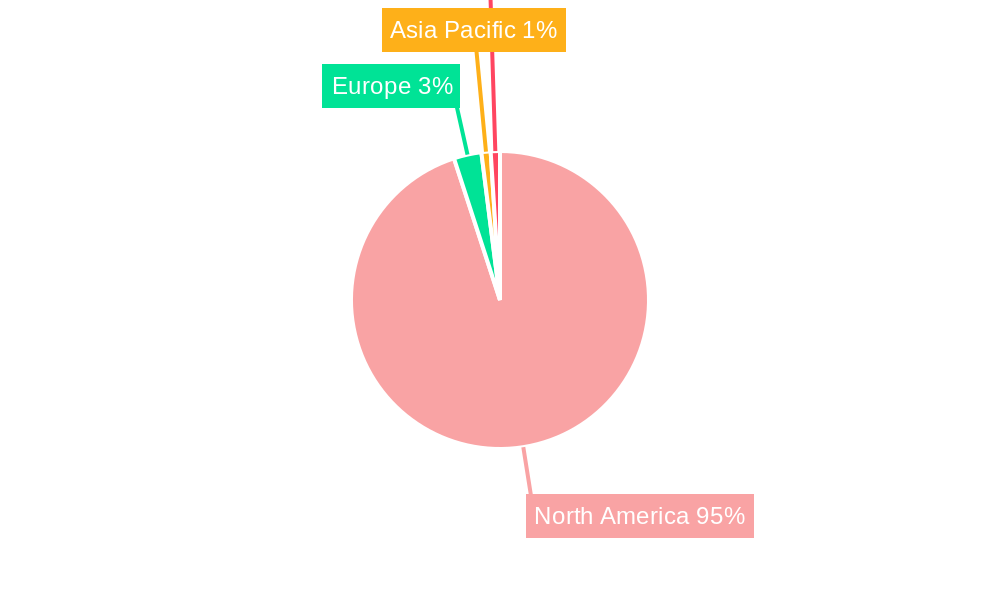
North America AUV and ROV Market Regional Market Share
Geographic Coverage of North America AUV and ROV Market
North America AUV and ROV Market REPORT HIGHLIGHTS
| Aspects | Details |
|---|---|
| Study Period | 2020-2034 |
| Base Year | 2025 |
| Estimated Year | 2026 |
| Forecast Period | 2026-2034 |
| Historical Period | 2020-2025 |
| Growth Rate | CAGR of 8.01% from 2020-2034 |
| Segmentation |
|
Table of Contents
- 1. Introduction
- 1.1. Research Scope
- 1.2. Market Segmentation
- 1.3. Research Objective
- 1.4. Definitions and Assumptions
- 2. Executive Summary
- 2.1. Market Snapshot
- 3. Market Dynamics
- 3.1. Market Drivers
- 3.2. Market Restrains
- 3.3. Market Trends
- 3.4. Market Opportunities
- 4. Market Factor Analysis
- 4.1. Porters Five Forces
- 4.1.1. Bargaining Power of Suppliers
- 4.1.2. Bargaining Power of Buyers
- 4.1.3. Threat of New Entrants
- 4.1.4. Threat of Substitutes
- 4.1.5. Competitive Rivalry
- 4.2. PESTEL analysis
- 4.3. BCG Analysis
- 4.3.1. Stars (High Growth, High Market Share)
- 4.3.2. Cash Cows (Low Growth, High Market Share)
- 4.3.3. Question Mark (High Growth, Low Market Share)
- 4.3.4. Dogs (Low Growth, Low Market Share)
- 4.4. Ansoff Matrix Analysis
- 4.5. Supply Chain Analysis
- 4.6. Regulatory Landscape
- 4.7. Current Market Potential and Opportunity Assessment (TAM–SAM–SOM Framework)
- 4.8. VDR Analyst Note
- 4.1. Porters Five Forces
- 5. Market Analysis, Insights and Forecast 2021-2033
- 5.1. Market Analysis, Insights and Forecast - by Vehicle Type
- 5.1.1. ROV
- 5.1.2. AUV
- 5.2. Market Analysis, Insights and Forecast - by Vehicle Class
- 5.2.1. Work-class Vehicle
- 5.2.2. Observatory-class Vehicle
- 5.3. Market Analysis, Insights and Forecast - by Application
- 5.3.1. Oil and Gas
- 5.3.2. Defense
- 5.3.3. Other Applications
- 5.4. Market Analysis, Insights and Forecast - by Activity
- 5.4.1. Drilling and Development
- 5.4.2. Construction
- 5.4.3. Inspection, Repair, and Maintenance
- 5.4.4. Decommissioning
- 5.4.5. Other Activities
- 5.5. Market Analysis, Insights and Forecast - by Geography
- 5.5.1. United States
- 5.5.2. Canada
- 5.5.3. Rest of North America
- 5.6. Market Analysis, Insights and Forecast - by Region
- 5.6.1. United States
- 5.6.2. Canada
- 5.6.3. Rest of North America
- 5.1. Market Analysis, Insights and Forecast - by Vehicle Type
- 6. North America AUV and ROV Market Analysis, Insights and Forecast, 2021-2033
- 6.1. Market Analysis, Insights and Forecast - by Vehicle Type
- 6.1.1. ROV
- 6.1.2. AUV
- 6.2. Market Analysis, Insights and Forecast - by Vehicle Class
- 6.2.1. Work-class Vehicle
- 6.2.2. Observatory-class Vehicle
- 6.3. Market Analysis, Insights and Forecast - by Application
- 6.3.1. Oil and Gas
- 6.3.2. Defense
- 6.3.3. Other Applications
- 6.4. Market Analysis, Insights and Forecast - by Activity
- 6.4.1. Drilling and Development
- 6.4.2. Construction
- 6.4.3. Inspection, Repair, and Maintenance
- 6.4.4. Decommissioning
- 6.4.5. Other Activities
- 6.5. Market Analysis, Insights and Forecast - by Geography
- 6.5.1. United States
- 6.5.2. Canada
- 6.5.3. Rest of North America
- 6.1. Market Analysis, Insights and Forecast - by Vehicle Type
- 7. United States North America AUV and ROV Market Analysis, Insights and Forecast, 2021-2033
- 7.1. Market Analysis, Insights and Forecast - by Vehicle Type
- 7.1.1. ROV
- 7.1.2. AUV
- 7.2. Market Analysis, Insights and Forecast - by Vehicle Class
- 7.2.1. Work-class Vehicle
- 7.2.2. Observatory-class Vehicle
- 7.3. Market Analysis, Insights and Forecast - by Application
- 7.3.1. Oil and Gas
- 7.3.2. Defense
- 7.3.3. Other Applications
- 7.4. Market Analysis, Insights and Forecast - by Activity
- 7.4.1. Drilling and Development
- 7.4.2. Construction
- 7.4.3. Inspection, Repair, and Maintenance
- 7.4.4. Decommissioning
- 7.4.5. Other Activities
- 7.5. Market Analysis, Insights and Forecast - by Geography
- 7.5.1. United States
- 7.5.2. Canada
- 7.5.3. Rest of North America
- 7.1. Market Analysis, Insights and Forecast - by Vehicle Type
- 8. Canada North America AUV and ROV Market Analysis, Insights and Forecast, 2021-2033
- 8.1. Market Analysis, Insights and Forecast - by Vehicle Type
- 8.1.1. ROV
- 8.1.2. AUV
- 8.2. Market Analysis, Insights and Forecast - by Vehicle Class
- 8.2.1. Work-class Vehicle
- 8.2.2. Observatory-class Vehicle
- 8.3. Market Analysis, Insights and Forecast - by Application
- 8.3.1. Oil and Gas
- 8.3.2. Defense
- 8.3.3. Other Applications
- 8.4. Market Analysis, Insights and Forecast - by Activity
- 8.4.1. Drilling and Development
- 8.4.2. Construction
- 8.4.3. Inspection, Repair, and Maintenance
- 8.4.4. Decommissioning
- 8.4.5. Other Activities
- 8.5. Market Analysis, Insights and Forecast - by Geography
- 8.5.1. United States
- 8.5.2. Canada
- 8.5.3. Rest of North America
- 8.1. Market Analysis, Insights and Forecast - by Vehicle Type
- 9. Rest of North America North America AUV and ROV Market Analysis, Insights and Forecast, 2021-2033
- 9.1. Market Analysis, Insights and Forecast - by Vehicle Type
- 9.1.1. ROV
- 9.1.2. AUV
- 9.2. Market Analysis, Insights and Forecast - by Vehicle Class
- 9.2.1. Work-class Vehicle
- 9.2.2. Observatory-class Vehicle
- 9.3. Market Analysis, Insights and Forecast - by Application
- 9.3.1. Oil and Gas
- 9.3.2. Defense
- 9.3.3. Other Applications
- 9.4. Market Analysis, Insights and Forecast - by Activity
- 9.4.1. Drilling and Development
- 9.4.2. Construction
- 9.4.3. Inspection, Repair, and Maintenance
- 9.4.4. Decommissioning
- 9.4.5. Other Activities
- 9.5. Market Analysis, Insights and Forecast - by Geography
- 9.5.1. United States
- 9.5.2. Canada
- 9.5.3. Rest of North America
- 9.1. Market Analysis, Insights and Forecast - by Vehicle Type
- 10. Competitive Analysis
- 10.1. Company Profiles
- 10.1.1 DOF Subsea AS
- 10.1.1.1. Company Overview
- 10.1.1.2. Products
- 10.1.1.3. Company Financials
- 10.1.1.4. SWOT Analysis
- 10.1.2 ROVOP
- 10.1.2.1. Company Overview
- 10.1.2.2. Products
- 10.1.2.3. Company Financials
- 10.1.2.4. SWOT Analysis
- 10.1.3 Fugro NV
- 10.1.3.1. Company Overview
- 10.1.3.2. Products
- 10.1.3.3. Company Financials
- 10.1.3.4. SWOT Analysis
- 10.1.4 Oceaneering International Inc
- 10.1.4.1. Company Overview
- 10.1.4.2. Products
- 10.1.4.3. Company Financials
- 10.1.4.4. SWOT Analysis
- 10.1.5 Delta SubSea LLC*List Not Exhaustive
- 10.1.5.1. Company Overview
- 10.1.5.2. Products
- 10.1.5.3. Company Financials
- 10.1.5.4. SWOT Analysis
- 10.1.6 Saipem SpA
- 10.1.6.1. Company Overview
- 10.1.6.2. Products
- 10.1.6.3. Company Financials
- 10.1.6.4. SWOT Analysis
- 10.1.7 DeepOcean AS
- 10.1.7.1. Company Overview
- 10.1.7.2. Products
- 10.1.7.3. Company Financials
- 10.1.7.4. SWOT Analysis
- 10.1.8 Helix Energy Solutions Group
- 10.1.8.1. Company Overview
- 10.1.8.2. Products
- 10.1.8.3. Company Financials
- 10.1.8.4. SWOT Analysis
- 10.1.9 Forum Energy Technologies Inc
- 10.1.9.1. Company Overview
- 10.1.9.2. Products
- 10.1.9.3. Company Financials
- 10.1.9.4. SWOT Analysis
- 10.1.10 TechnipFMC PLC
- 10.1.10.1. Company Overview
- 10.1.10.2. Products
- 10.1.10.3. Company Financials
- 10.1.10.4. SWOT Analysis
- 10.1.1 DOF Subsea AS
- 10.2. Market Entropy
- 10.2.1 Company's Key Areas Served
- 10.2.2 Recent Developments
- 10.3. Company Market Share Analysis 2025
- 10.3.1 Top 5 Companies Market Share Analysis
- 10.3.2 Top 3 Companies Market Share Analysis
- 10.4. List of Potential Customers
- 11. Research Methodology
List of Figures
- Figure 1: North America AUV and ROV Market Revenue Breakdown (billion, %) by Product 2025 & 2033
- Figure 2: North America AUV and ROV Market Share (%) by Company 2025
List of Tables
- Table 1: North America AUV and ROV Market Revenue billion Forecast, by Vehicle Type 2020 & 2033
- Table 2: North America AUV and ROV Market Volume K Unit Forecast, by Vehicle Type 2020 & 2033
- Table 3: North America AUV and ROV Market Revenue billion Forecast, by Vehicle Class 2020 & 2033
- Table 4: North America AUV and ROV Market Volume K Unit Forecast, by Vehicle Class 2020 & 2033
- Table 5: North America AUV and ROV Market Revenue billion Forecast, by Application 2020 & 2033
- Table 6: North America AUV and ROV Market Volume K Unit Forecast, by Application 2020 & 2033
- Table 7: North America AUV and ROV Market Revenue billion Forecast, by Activity 2020 & 2033
- Table 8: North America AUV and ROV Market Volume K Unit Forecast, by Activity 2020 & 2033
- Table 9: North America AUV and ROV Market Revenue billion Forecast, by Geography 2020 & 2033
- Table 10: North America AUV and ROV Market Volume K Unit Forecast, by Geography 2020 & 2033
- Table 11: North America AUV and ROV Market Revenue billion Forecast, by Region 2020 & 2033
- Table 12: North America AUV and ROV Market Volume K Unit Forecast, by Region 2020 & 2033
- Table 13: North America AUV and ROV Market Revenue billion Forecast, by Vehicle Type 2020 & 2033
- Table 14: North America AUV and ROV Market Volume K Unit Forecast, by Vehicle Type 2020 & 2033
- Table 15: North America AUV and ROV Market Revenue billion Forecast, by Vehicle Class 2020 & 2033
- Table 16: North America AUV and ROV Market Volume K Unit Forecast, by Vehicle Class 2020 & 2033
- Table 17: North America AUV and ROV Market Revenue billion Forecast, by Application 2020 & 2033
- Table 18: North America AUV and ROV Market Volume K Unit Forecast, by Application 2020 & 2033
- Table 19: North America AUV and ROV Market Revenue billion Forecast, by Activity 2020 & 2033
- Table 20: North America AUV and ROV Market Volume K Unit Forecast, by Activity 2020 & 2033
- Table 21: North America AUV and ROV Market Revenue billion Forecast, by Geography 2020 & 2033
- Table 22: North America AUV and ROV Market Volume K Unit Forecast, by Geography 2020 & 2033
- Table 23: North America AUV and ROV Market Revenue billion Forecast, by Country 2020 & 2033
- Table 24: North America AUV and ROV Market Volume K Unit Forecast, by Country 2020 & 2033
- Table 25: North America AUV and ROV Market Revenue billion Forecast, by Vehicle Type 2020 & 2033
- Table 26: North America AUV and ROV Market Volume K Unit Forecast, by Vehicle Type 2020 & 2033
- Table 27: North America AUV and ROV Market Revenue billion Forecast, by Vehicle Class 2020 & 2033
- Table 28: North America AUV and ROV Market Volume K Unit Forecast, by Vehicle Class 2020 & 2033
- Table 29: North America AUV and ROV Market Revenue billion Forecast, by Application 2020 & 2033
- Table 30: North America AUV and ROV Market Volume K Unit Forecast, by Application 2020 & 2033
- Table 31: North America AUV and ROV Market Revenue billion Forecast, by Activity 2020 & 2033
- Table 32: North America AUV and ROV Market Volume K Unit Forecast, by Activity 2020 & 2033
- Table 33: North America AUV and ROV Market Revenue billion Forecast, by Geography 2020 & 2033
- Table 34: North America AUV and ROV Market Volume K Unit Forecast, by Geography 2020 & 2033
- Table 35: North America AUV and ROV Market Revenue billion Forecast, by Country 2020 & 2033
- Table 36: North America AUV and ROV Market Volume K Unit Forecast, by Country 2020 & 2033
- Table 37: North America AUV and ROV Market Revenue billion Forecast, by Vehicle Type 2020 & 2033
- Table 38: North America AUV and ROV Market Volume K Unit Forecast, by Vehicle Type 2020 & 2033
- Table 39: North America AUV and ROV Market Revenue billion Forecast, by Vehicle Class 2020 & 2033
- Table 40: North America AUV and ROV Market Volume K Unit Forecast, by Vehicle Class 2020 & 2033
- Table 41: North America AUV and ROV Market Revenue billion Forecast, by Application 2020 & 2033
- Table 42: North America AUV and ROV Market Volume K Unit Forecast, by Application 2020 & 2033
- Table 43: North America AUV and ROV Market Revenue billion Forecast, by Activity 2020 & 2033
- Table 44: North America AUV and ROV Market Volume K Unit Forecast, by Activity 2020 & 2033
- Table 45: North America AUV and ROV Market Revenue billion Forecast, by Geography 2020 & 2033
- Table 46: North America AUV and ROV Market Volume K Unit Forecast, by Geography 2020 & 2033
- Table 47: North America AUV and ROV Market Revenue billion Forecast, by Country 2020 & 2033
- Table 48: North America AUV and ROV Market Volume K Unit Forecast, by Country 2020 & 2033
Frequently Asked Questions
1. What is the projected Compound Annual Growth Rate (CAGR) of the North America AUV and ROV Market?
The projected CAGR is approximately 8.01%.
2. Which companies are prominent players in the North America AUV and ROV Market?
Key companies in the market include DOF Subsea AS, ROVOP, Fugro NV, Oceaneering International Inc, Delta SubSea LLC*List Not Exhaustive, Saipem SpA, DeepOcean AS, Helix Energy Solutions Group, Forum Energy Technologies Inc, TechnipFMC PLC.
3. What are the main segments of the North America AUV and ROV Market?
The market segments include Vehicle Type, Vehicle Class, Application, Activity, Geography.
4. Can you provide details about the market size?
The market size is estimated to be USD 0.72 billion as of 2022.
5. What are some drivers contributing to market growth?
Increasing Offshore Oil and Gas Exploration Activities in the American. Asia-Pacific. and Middle East and African Regions4.; Growing Offshore Renewable Technologies.
6. What are the notable trends driving market growth?
Inspection. Repair. and Maintenance Activity to Witness Significant Growth.
7. Are there any restraints impacting market growth?
Ban on Offshore Exploration and Production Activities in Multiple Regions.
8. Can you provide examples of recent developments in the market?
In August 2022, VideoRay, LLC, reported a large and diverse order for its Defender remotely operated vehicles (ROVs) by the United States Navy. The Navy is standardizing on VideoRay Defender Mission Specialist systems due to the superior capabilities, flexibility and upgradeability of many systems deployed since 2019. VideoRay's customer support of the Navy includes training facilities and staffing on the East Coast in Pottstown, Pennsylvania, and the West Coast in San Diego.
9. What pricing options are available for accessing the report?
Pricing options include single-user, multi-user, and enterprise licenses priced at USD 4750, USD 5250, and USD 8750 respectively.
10. Is the market size provided in terms of value or volume?
The market size is provided in terms of value, measured in billion and volume, measured in K Unit.
11. Are there any specific market keywords associated with the report?
Yes, the market keyword associated with the report is "North America AUV and ROV Market," which aids in identifying and referencing the specific market segment covered.
12. How do I determine which pricing option suits my needs best?
The pricing options vary based on user requirements and access needs. Individual users may opt for single-user licenses, while businesses requiring broader access may choose multi-user or enterprise licenses for cost-effective access to the report.
13. Are there any additional resources or data provided in the North America AUV and ROV Market report?
While the report offers comprehensive insights, it's advisable to review the specific contents or supplementary materials provided to ascertain if additional resources or data are available.
14. How can I stay updated on further developments or reports in the North America AUV and ROV Market?
To stay informed about further developments, trends, and reports in the North America AUV and ROV Market, consider subscribing to industry newsletters, following relevant companies and organizations, or regularly checking reputable industry news sources and publications.
Methodology
Step 1 - Identification of Relevant Samples Size from Population Database


Step 2 - Approaches for Defining Global Market Size (Value, Volume* & Price*)

Note*: In applicable scenarios
Step 3 - Data Sources
Primary Research
- Web Analytics
- Survey Reports
- Research Institute
- Latest Research Reports
- Opinion Leaders
Secondary Research
- Annual Reports
- White Paper
- Latest Press Release
- Industry Association
- Paid Database
- Investor Presentations

Step 4 - Data Triangulation
Involves using different sources of information in order to increase the validity of a study
These sources are likely to be stakeholders in a program - participants, other researchers, program staff, other community members, and so on.
Then we put all data in single framework & apply various statistical tools to find out the dynamic on the market.
During the analysis stage, feedback from the stakeholder groups would be compared to determine areas of agreement as well as areas of divergence