
Key Insights
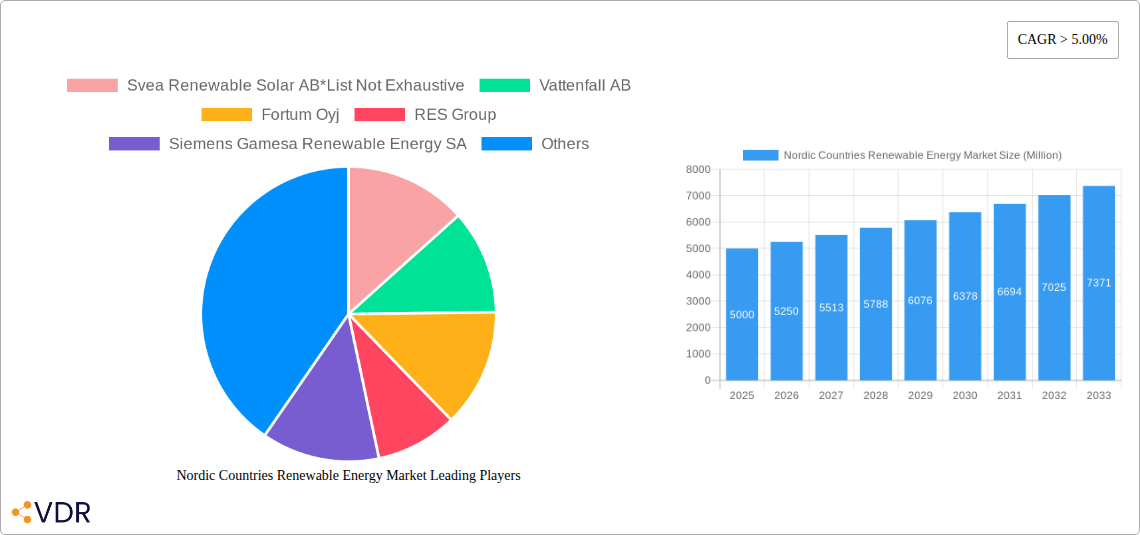
The Nordic renewable energy market, encompassing countries like Sweden, Norway, Finland, Denmark, and Iceland, exhibits robust growth potential, driven by ambitious climate targets, supportive government policies, and abundant renewable resources. The market's significant size, exceeding several billion USD in 2025, is projected to expand at a compound annual growth rate (CAGR) exceeding 5% through 2033. This growth is fueled by substantial investments in wind power, particularly offshore wind farms leveraging the region's extensive coastlines, and a continued expansion of hydropower capacity, a traditional strength for the region. Furthermore, solar power is experiencing a rapid increase in adoption, particularly in residential and commercial sectors, driven by decreasing technology costs and increasing energy independence initiatives. Bioenergy, including biomass and biogas, also plays a substantial role, particularly in heating and transportation sectors. While grid infrastructure limitations and seasonal variations in renewable energy generation pose challenges, ongoing investments in smart grids and energy storage solutions are mitigating these restraints. The market is highly segmented, with substantial contributions from various players including both international energy giants and specialized Nordic companies.
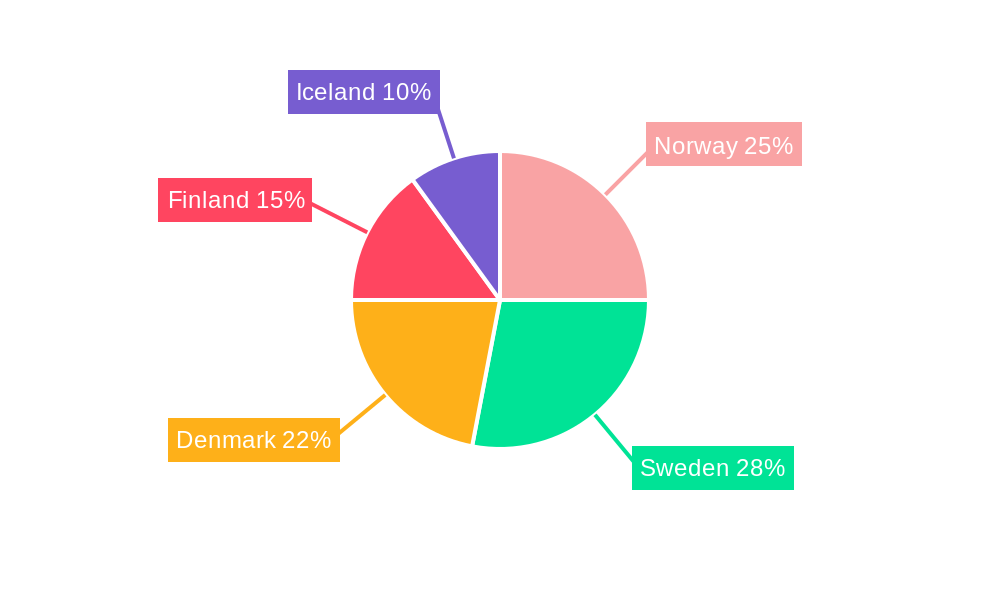
Within the Nordic region, specific national markets exhibit distinct characteristics. Norway, for example, heavily relies on its vast hydropower resources, while Denmark is a leader in offshore wind technology and integration. Sweden shows strong growth across solar, wind, and bioenergy, supported by its industrial base and advanced technological capabilities. Finland, similarly, is progressing in wind and bioenergy, while Iceland leverages its geothermal resources effectively. Competition is intense, with major players focusing on diverse renewable energy sources and applications. The market is also witnessing increased collaborations between energy providers, technology developers, and government agencies to accelerate the transition to a sustainable energy future. The forecast period suggests that this robust growth trajectory is likely to continue, particularly given strong governmental backing and a growing commitment to renewable energy targets across the Nordic nations.
Nordic Countries Renewable Energy Market: A Comprehensive Report (2019-2033)
This comprehensive report provides an in-depth analysis of the Nordic Countries renewable energy market, covering the period from 2019 to 2033. With a focus on market dynamics, growth trends, key players, and future opportunities, this report is an essential resource for industry professionals, investors, and policymakers seeking to understand and capitalize on this rapidly evolving sector. The report segments the market by type (Solar, Wind, Hydro, Bioenergy, Other) and application (Residential, Commercial, Industrial, Transportation), offering granular insights into each segment's performance and growth potential. The total market size is projected to reach xx Million by 2033.
Nordic Countries Renewable Energy Market Dynamics & Structure
This section analyzes the competitive landscape of the Nordic renewable energy market, encompassing market concentration, technological advancements, regulatory frameworks, and M&A activities. The market exhibits a moderately concentrated structure, with a few major players holding significant market share, but also with ample space for smaller, specialized firms.
Key Aspects:
- Market Concentration: The top 5 players hold approximately xx% of the market share in 2025, with a forecast to xx% by 2033.
- Technological Innovation: Significant investments are driving innovation in areas like offshore wind technology and advanced bioenergy solutions. However, challenges remain in areas such as grid integration and energy storage.
- Regulatory Framework: Supportive government policies and subsidies are key drivers, but inconsistencies across Nordic countries can create complexities for businesses.
- Competitive Substitutes: Fossil fuels remain a significant competitor, although their market share is steadily declining.
- End-User Demographics: The industrial and commercial sectors are the major consumers, followed by residential.
- M&A Trends: The period 2019-2024 witnessed xx M&A deals, primarily focused on consolidation and expansion into new technologies. This trend is predicted to continue, with xx deals forecast for 2025-2033.
Nordic Countries Renewable Energy Market Growth Trends & Insights
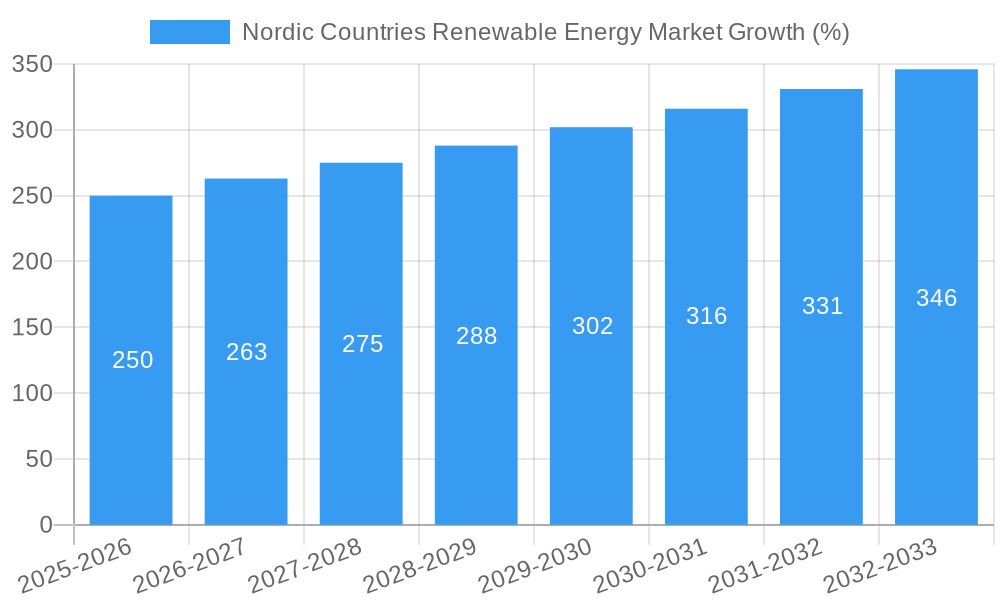
The Nordic renewable energy market is experiencing robust growth, driven by stringent environmental regulations, ambitious renewable energy targets, and decreasing costs of renewable energy technologies. The market size expanded from xx Million in 2019 to xx Million in 2024, demonstrating a strong CAGR of xx%. This upward trajectory is projected to continue, reaching xx Million by 2033, with a forecasted CAGR of xx% during the forecast period (2025-2033). Key factors influencing this growth include increasing consumer awareness of environmental issues, government incentives promoting renewable energy adoption, and the decreasing cost of renewable energy technologies. Market penetration of renewable energy sources has increased significantly, with wind and hydro dominating. Technological advancements such as floating offshore wind turbines and next-generation solar panels are expected to further accelerate market expansion.
Dominant Regions, Countries, or Segments in Nordic Countries Renewable Energy Market
Wind energy, particularly offshore wind, is the dominant segment by type, driven by the favorable geographical conditions and government support in several Nordic countries. Sweden and Norway are leading countries in terms of both installed capacity and growth potential. The Industrial sector holds the largest share in the application segment, showing strong growth potential due to increasing demand for renewable energy in manufacturing and heavy industries.
Key Drivers:
- Favorable Government Policies: Significant investments, tax incentives, and feed-in tariffs are accelerating renewable energy deployment.
- Robust Infrastructure: Existing power grids and advanced grid management systems support large-scale renewable energy integration.
- Abundant Natural Resources: Favorable wind resources and hydropower potential contribute to the market's dominance.
Dominant Segments:
- Wind Energy: Holds the largest market share (xx%) driven by substantial government investment and technological advancements in offshore wind.
- Hydropower: Contributes significantly to the energy mix, especially in Norway and Sweden, leveraging existing infrastructure.
- Industrial Sector: High energy consumption in industrial processes is driving demand for renewable energy solutions.
Nordic Countries Renewable Energy Market Product Landscape
The Nordic renewable energy market is characterized by a diverse product landscape, featuring technologically advanced wind turbines (both onshore and offshore), high-efficiency solar panels, and innovative bioenergy solutions. Continuous improvements in energy conversion efficiency, durability, and cost-effectiveness are prominent features. Key developments include the rise of floating offshore wind technology, advancements in solar PV technology (e.g., Perovskite solar cells), and increased utilization of advanced biofuels. Unique selling propositions encompass enhanced energy yield, reduced environmental impact, and improved grid integration capabilities.
Key Drivers, Barriers & Challenges in Nordic Countries Renewable Energy Market
Key Drivers:
- Stringent environmental regulations and targets: Driving the shift away from fossil fuels.
- Government incentives and subsidies: Making renewable energy financially attractive.
- Technological advancements: Reducing the cost and increasing the efficiency of renewable energy technologies.
Key Challenges:
- Intermittency of renewable energy sources: Requires significant investments in energy storage and grid management solutions.
- Transmission infrastructure limitations: Needs upgrades to efficiently integrate large-scale renewable energy projects.
- Supply chain disruptions: Impacts the availability and cost of key components for renewable energy projects, such as turbines and solar panels. This could impact market growth by xx% in 2027 if not addressed.
Emerging Opportunities in Nordic Countries Renewable Energy Market
- Offshore wind power expansion: Significant untapped potential for large-scale offshore wind farms.
- Green hydrogen production: Utilizing renewable energy for green hydrogen generation and storage.
- Integration of smart grids: Optimizing energy distribution and balancing the intermittency of renewable energy sources.
- Expansion into new technologies: Exploring opportunities in geothermal and tidal energy.
Growth Accelerators in the Nordic Countries Renewable Energy Market Industry
Long-term growth is fueled by significant government investments, increasing private sector participation, and technological breakthroughs enhancing efficiency and reducing costs. Strategic partnerships between energy companies and technology providers are driving innovation and accelerating project deployments. Furthermore, regional collaborations are enhancing grid infrastructure and facilitating cross-border energy trading, further supporting the market's expansion.
Key Players Shaping the Nordic Countries Renewable Energy Market Market
- Svea Renewable Solar AB
- Vattenfall AB
- Fortum Oyj
- RES Group
- Siemens Gamesa Renewable Energy SA
- Swedish Biofuels AB
- InnoVentum AB
- Axpo Holding AG
- General Electric Company
Notable Milestones in Nordic Countries Renewable Energy Market Sector
- December 2021: Eolus Vind AB expanded an existing wind power off-take deal to 117 MW and announced the construction of a 400-MW onshore wind farm in Norway. This significantly boosted the Norwegian onshore wind capacity and showcased investor confidence.
- June 2022: SveaSolar's subsidiary secured USD 106 Million to develop 500 MW of solar projects, signaling significant investment in utility-scale solar.
- October 2022: Enlight Renewable Energy Ltd. commenced commercial production of the 372-MW Bjornberget wind farm in Sweden, demonstrating the viability of large-scale wind projects.
In-Depth Nordic Countries Renewable Energy Market Market Outlook
The Nordic renewable energy market is poised for continued robust growth, driven by favorable government policies, technological advancements, and increasing private sector investment. The forecast period (2025-2033) will witness significant expansion across all segments, particularly offshore wind and utility-scale solar. Strategic partnerships and technological breakthroughs, such as improved energy storage solutions, will further enhance the sector’s competitiveness and sustainability. The market's future potential is substantial, with ample opportunities for innovation, investment, and job creation.
Nordic Countries Renewable Energy Market Segmentation
-
1. Type
- 1.1. Solar
- 1.2. Wind (incl. Onshore & Offshore)
- 1.3. Hydro
- 1.4. Bioenergy
- 1.5. Other Types (Geothermal, Tidal, etc.)
-
2. Geography
- 2.1. Norway
- 2.2. Sweden
- 2.3. Denmark
- 2.4. Finland
Nordic Countries Renewable Energy Market Segmentation By Geography
- 1. Norway
- 2. Sweden
- 3. Denmark
- 4. Finland
Nordic Countries Renewable Energy Market REPORT HIGHLIGHTS
| Aspects | Details |
|---|---|
| Study Period | 2019-2033 |
| Base Year | 2024 |
| Estimated Year | 2025 |
| Forecast Period | 2025-2033 |
| Historical Period | 2019-2024 |
| Growth Rate | CAGR of > 5.00% from 2019-2033 |
| Segmentation |
|
Table of Contents
- 1. Introduction
- 1.1. Research Scope
- 1.2. Market Segmentation
- 1.3. Research Methodology
- 1.4. Definitions and Assumptions
- 2. Executive Summary
- 2.1. Introduction
- 3. Market Dynamics
- 3.1. Introduction
- 3.2. Market Drivers
- 3.2.1. 4.; Growing Penetration of the Technology in Long-Duration Energy Storage Applications4.; Increasing Adoption of Renewable Energy
- 3.3. Market Restrains
- 3.3.1. 4.; Low Energy of Battery Cells
- 3.4. Market Trends
- 3.4.1. Hydro-based Electricity Generation is Expected to Dominate the Market
- 4. Market Factor Analysis
- 4.1. Porters Five Forces
- 4.2. Supply/Value Chain
- 4.3. PESTEL analysis
- 4.4. Market Entropy
- 4.5. Patent/Trademark Analysis
- 5. Nordic Countries Renewable Energy Market Analysis, Insights and Forecast, 2019-2031
- 5.1. Market Analysis, Insights and Forecast - by Type
- 5.1.1. Solar
- 5.1.2. Wind (incl. Onshore & Offshore)
- 5.1.3. Hydro
- 5.1.4. Bioenergy
- 5.1.5. Other Types (Geothermal, Tidal, etc.)
- 5.2. Market Analysis, Insights and Forecast - by Geography
- 5.2.1. Norway
- 5.2.2. Sweden
- 5.2.3. Denmark
- 5.2.4. Finland
- 5.3. Market Analysis, Insights and Forecast - by Region
- 5.3.1. Norway
- 5.3.2. Sweden
- 5.3.3. Denmark
- 5.3.4. Finland
- 5.1. Market Analysis, Insights and Forecast - by Type
- 6. Norway Nordic Countries Renewable Energy Market Analysis, Insights and Forecast, 2019-2031
- 6.1. Market Analysis, Insights and Forecast - by Type
- 6.1.1. Solar
- 6.1.2. Wind (incl. Onshore & Offshore)
- 6.1.3. Hydro
- 6.1.4. Bioenergy
- 6.1.5. Other Types (Geothermal, Tidal, etc.)
- 6.2. Market Analysis, Insights and Forecast - by Geography
- 6.2.1. Norway
- 6.2.2. Sweden
- 6.2.3. Denmark
- 6.2.4. Finland
- 6.1. Market Analysis, Insights and Forecast - by Type
- 7. Sweden Nordic Countries Renewable Energy Market Analysis, Insights and Forecast, 2019-2031
- 7.1. Market Analysis, Insights and Forecast - by Type
- 7.1.1. Solar
- 7.1.2. Wind (incl. Onshore & Offshore)
- 7.1.3. Hydro
- 7.1.4. Bioenergy
- 7.1.5. Other Types (Geothermal, Tidal, etc.)
- 7.2. Market Analysis, Insights and Forecast - by Geography
- 7.2.1. Norway
- 7.2.2. Sweden
- 7.2.3. Denmark
- 7.2.4. Finland
- 7.1. Market Analysis, Insights and Forecast - by Type
- 8. Denmark Nordic Countries Renewable Energy Market Analysis, Insights and Forecast, 2019-2031
- 8.1. Market Analysis, Insights and Forecast - by Type
- 8.1.1. Solar
- 8.1.2. Wind (incl. Onshore & Offshore)
- 8.1.3. Hydro
- 8.1.4. Bioenergy
- 8.1.5. Other Types (Geothermal, Tidal, etc.)
- 8.2. Market Analysis, Insights and Forecast - by Geography
- 8.2.1. Norway
- 8.2.2. Sweden
- 8.2.3. Denmark
- 8.2.4. Finland
- 8.1. Market Analysis, Insights and Forecast - by Type
- 9. Finland Nordic Countries Renewable Energy Market Analysis, Insights and Forecast, 2019-2031
- 9.1. Market Analysis, Insights and Forecast - by Type
- 9.1.1. Solar
- 9.1.2. Wind (incl. Onshore & Offshore)
- 9.1.3. Hydro
- 9.1.4. Bioenergy
- 9.1.5. Other Types (Geothermal, Tidal, etc.)
- 9.2. Market Analysis, Insights and Forecast - by Geography
- 9.2.1. Norway
- 9.2.2. Sweden
- 9.2.3. Denmark
- 9.2.4. Finland
- 9.1. Market Analysis, Insights and Forecast - by Type
- 10. North America Nordic Countries Renewable Energy Market Analysis, Insights and Forecast, 2019-2031
- 10.1. Market Analysis, Insights and Forecast - By Country/Sub-region
- 10.1.1 United States
- 10.1.2 Canada
- 10.1.3 Mexico
- 11. Europe Nordic Countries Renewable Energy Market Analysis, Insights and Forecast, 2019-2031
- 11.1. Market Analysis, Insights and Forecast - By Country/Sub-region
- 11.1.1 Germany
- 11.1.2 United Kingdom
- 11.1.3 France
- 11.1.4 Spain
- 11.1.5 Italy
- 11.1.6 Spain
- 11.1.7 Belgium
- 11.1.8 Netherland
- 11.1.9 Nordics
- 11.1.10 Rest of Europe
- 12. Asia Pacific Nordic Countries Renewable Energy Market Analysis, Insights and Forecast, 2019-2031
- 12.1. Market Analysis, Insights and Forecast - By Country/Sub-region
- 12.1.1 China
- 12.1.2 Japan
- 12.1.3 India
- 12.1.4 South Korea
- 12.1.5 Southeast Asia
- 12.1.6 Australia
- 12.1.7 Indonesia
- 12.1.8 Phillipes
- 12.1.9 Singapore
- 12.1.10 Thailandc
- 12.1.11 Rest of Asia Pacific
- 13. South America Nordic Countries Renewable Energy Market Analysis, Insights and Forecast, 2019-2031
- 13.1. Market Analysis, Insights and Forecast - By Country/Sub-region
- 13.1.1 Brazil
- 13.1.2 Argentina
- 13.1.3 Peru
- 13.1.4 Chile
- 13.1.5 Colombia
- 13.1.6 Ecuador
- 13.1.7 Venezuela
- 13.1.8 Rest of South America
- 14. North America Nordic Countries Renewable Energy Market Analysis, Insights and Forecast, 2019-2031
- 14.1. Market Analysis, Insights and Forecast - By Country/Sub-region
- 14.1.1 United States
- 14.1.2 Canada
- 14.1.3 Mexico
- 15. MEA Nordic Countries Renewable Energy Market Analysis, Insights and Forecast, 2019-2031
- 15.1. Market Analysis, Insights and Forecast - By Country/Sub-region
- 15.1.1 United Arab Emirates
- 15.1.2 Saudi Arabia
- 15.1.3 South Africa
- 15.1.4 Rest of Middle East and Africa
- 16. Competitive Analysis
- 16.1. Market Share Analysis 2024
- 16.2. Company Profiles
- 16.2.1 Svea Renewable Solar AB*List Not Exhaustive
- 16.2.1.1. Overview
- 16.2.1.2. Products
- 16.2.1.3. SWOT Analysis
- 16.2.1.4. Recent Developments
- 16.2.1.5. Financials (Based on Availability)
- 16.2.2 Vattenfall AB
- 16.2.2.1. Overview
- 16.2.2.2. Products
- 16.2.2.3. SWOT Analysis
- 16.2.2.4. Recent Developments
- 16.2.2.5. Financials (Based on Availability)
- 16.2.3 Fortum Oyj
- 16.2.3.1. Overview
- 16.2.3.2. Products
- 16.2.3.3. SWOT Analysis
- 16.2.3.4. Recent Developments
- 16.2.3.5. Financials (Based on Availability)
- 16.2.4 RES Group
- 16.2.4.1. Overview
- 16.2.4.2. Products
- 16.2.4.3. SWOT Analysis
- 16.2.4.4. Recent Developments
- 16.2.4.5. Financials (Based on Availability)
- 16.2.5 Siemens Gamesa Renewable Energy SA
- 16.2.5.1. Overview
- 16.2.5.2. Products
- 16.2.5.3. SWOT Analysis
- 16.2.5.4. Recent Developments
- 16.2.5.5. Financials (Based on Availability)
- 16.2.6 Swedish Biofuels AB
- 16.2.6.1. Overview
- 16.2.6.2. Products
- 16.2.6.3. SWOT Analysis
- 16.2.6.4. Recent Developments
- 16.2.6.5. Financials (Based on Availability)
- 16.2.7 InnoVentum AB
- 16.2.7.1. Overview
- 16.2.7.2. Products
- 16.2.7.3. SWOT Analysis
- 16.2.7.4. Recent Developments
- 16.2.7.5. Financials (Based on Availability)
- 16.2.8 Axpo Holding AG
- 16.2.8.1. Overview
- 16.2.8.2. Products
- 16.2.8.3. SWOT Analysis
- 16.2.8.4. Recent Developments
- 16.2.8.5. Financials (Based on Availability)
- 16.2.9 General Electric Company
- 16.2.9.1. Overview
- 16.2.9.2. Products
- 16.2.9.3. SWOT Analysis
- 16.2.9.4. Recent Developments
- 16.2.9.5. Financials (Based on Availability)
- 16.2.1 Svea Renewable Solar AB*List Not Exhaustive
List of Figures
- Figure 1: Nordic Countries Renewable Energy Market Revenue Breakdown (Million, %) by Product 2024 & 2032
- Figure 2: Nordic Countries Renewable Energy Market Share (%) by Company 2024
List of Tables
- Table 1: Nordic Countries Renewable Energy Market Revenue Million Forecast, by Region 2019 & 2032
- Table 2: Nordic Countries Renewable Energy Market Volume gigawatt Forecast, by Region 2019 & 2032
- Table 3: Nordic Countries Renewable Energy Market Revenue Million Forecast, by Type 2019 & 2032
- Table 4: Nordic Countries Renewable Energy Market Volume gigawatt Forecast, by Type 2019 & 2032
- Table 5: Nordic Countries Renewable Energy Market Revenue Million Forecast, by Geography 2019 & 2032
- Table 6: Nordic Countries Renewable Energy Market Volume gigawatt Forecast, by Geography 2019 & 2032
- Table 7: Nordic Countries Renewable Energy Market Revenue Million Forecast, by Region 2019 & 2032
- Table 8: Nordic Countries Renewable Energy Market Volume gigawatt Forecast, by Region 2019 & 2032
- Table 9: Nordic Countries Renewable Energy Market Revenue Million Forecast, by Country 2019 & 2032
- Table 10: Nordic Countries Renewable Energy Market Volume gigawatt Forecast, by Country 2019 & 2032
- Table 11: United States Nordic Countries Renewable Energy Market Revenue (Million) Forecast, by Application 2019 & 2032
- Table 12: United States Nordic Countries Renewable Energy Market Volume (gigawatt) Forecast, by Application 2019 & 2032
- Table 13: Canada Nordic Countries Renewable Energy Market Revenue (Million) Forecast, by Application 2019 & 2032
- Table 14: Canada Nordic Countries Renewable Energy Market Volume (gigawatt) Forecast, by Application 2019 & 2032
- Table 15: Mexico Nordic Countries Renewable Energy Market Revenue (Million) Forecast, by Application 2019 & 2032
- Table 16: Mexico Nordic Countries Renewable Energy Market Volume (gigawatt) Forecast, by Application 2019 & 2032
- Table 17: Nordic Countries Renewable Energy Market Revenue Million Forecast, by Country 2019 & 2032
- Table 18: Nordic Countries Renewable Energy Market Volume gigawatt Forecast, by Country 2019 & 2032
- Table 19: Germany Nordic Countries Renewable Energy Market Revenue (Million) Forecast, by Application 2019 & 2032
- Table 20: Germany Nordic Countries Renewable Energy Market Volume (gigawatt) Forecast, by Application 2019 & 2032
- Table 21: United Kingdom Nordic Countries Renewable Energy Market Revenue (Million) Forecast, by Application 2019 & 2032
- Table 22: United Kingdom Nordic Countries Renewable Energy Market Volume (gigawatt) Forecast, by Application 2019 & 2032
- Table 23: France Nordic Countries Renewable Energy Market Revenue (Million) Forecast, by Application 2019 & 2032
- Table 24: France Nordic Countries Renewable Energy Market Volume (gigawatt) Forecast, by Application 2019 & 2032
- Table 25: Spain Nordic Countries Renewable Energy Market Revenue (Million) Forecast, by Application 2019 & 2032
- Table 26: Spain Nordic Countries Renewable Energy Market Volume (gigawatt) Forecast, by Application 2019 & 2032
- Table 27: Italy Nordic Countries Renewable Energy Market Revenue (Million) Forecast, by Application 2019 & 2032
- Table 28: Italy Nordic Countries Renewable Energy Market Volume (gigawatt) Forecast, by Application 2019 & 2032
- Table 29: Spain Nordic Countries Renewable Energy Market Revenue (Million) Forecast, by Application 2019 & 2032
- Table 30: Spain Nordic Countries Renewable Energy Market Volume (gigawatt) Forecast, by Application 2019 & 2032
- Table 31: Belgium Nordic Countries Renewable Energy Market Revenue (Million) Forecast, by Application 2019 & 2032
- Table 32: Belgium Nordic Countries Renewable Energy Market Volume (gigawatt) Forecast, by Application 2019 & 2032
- Table 33: Netherland Nordic Countries Renewable Energy Market Revenue (Million) Forecast, by Application 2019 & 2032
- Table 34: Netherland Nordic Countries Renewable Energy Market Volume (gigawatt) Forecast, by Application 2019 & 2032
- Table 35: Nordics Nordic Countries Renewable Energy Market Revenue (Million) Forecast, by Application 2019 & 2032
- Table 36: Nordics Nordic Countries Renewable Energy Market Volume (gigawatt) Forecast, by Application 2019 & 2032
- Table 37: Rest of Europe Nordic Countries Renewable Energy Market Revenue (Million) Forecast, by Application 2019 & 2032
- Table 38: Rest of Europe Nordic Countries Renewable Energy Market Volume (gigawatt) Forecast, by Application 2019 & 2032
- Table 39: Nordic Countries Renewable Energy Market Revenue Million Forecast, by Country 2019 & 2032
- Table 40: Nordic Countries Renewable Energy Market Volume gigawatt Forecast, by Country 2019 & 2032
- Table 41: China Nordic Countries Renewable Energy Market Revenue (Million) Forecast, by Application 2019 & 2032
- Table 42: China Nordic Countries Renewable Energy Market Volume (gigawatt) Forecast, by Application 2019 & 2032
- Table 43: Japan Nordic Countries Renewable Energy Market Revenue (Million) Forecast, by Application 2019 & 2032
- Table 44: Japan Nordic Countries Renewable Energy Market Volume (gigawatt) Forecast, by Application 2019 & 2032
- Table 45: India Nordic Countries Renewable Energy Market Revenue (Million) Forecast, by Application 2019 & 2032
- Table 46: India Nordic Countries Renewable Energy Market Volume (gigawatt) Forecast, by Application 2019 & 2032
- Table 47: South Korea Nordic Countries Renewable Energy Market Revenue (Million) Forecast, by Application 2019 & 2032
- Table 48: South Korea Nordic Countries Renewable Energy Market Volume (gigawatt) Forecast, by Application 2019 & 2032
- Table 49: Southeast Asia Nordic Countries Renewable Energy Market Revenue (Million) Forecast, by Application 2019 & 2032
- Table 50: Southeast Asia Nordic Countries Renewable Energy Market Volume (gigawatt) Forecast, by Application 2019 & 2032
- Table 51: Australia Nordic Countries Renewable Energy Market Revenue (Million) Forecast, by Application 2019 & 2032
- Table 52: Australia Nordic Countries Renewable Energy Market Volume (gigawatt) Forecast, by Application 2019 & 2032
- Table 53: Indonesia Nordic Countries Renewable Energy Market Revenue (Million) Forecast, by Application 2019 & 2032
- Table 54: Indonesia Nordic Countries Renewable Energy Market Volume (gigawatt) Forecast, by Application 2019 & 2032
- Table 55: Phillipes Nordic Countries Renewable Energy Market Revenue (Million) Forecast, by Application 2019 & 2032
- Table 56: Phillipes Nordic Countries Renewable Energy Market Volume (gigawatt) Forecast, by Application 2019 & 2032
- Table 57: Singapore Nordic Countries Renewable Energy Market Revenue (Million) Forecast, by Application 2019 & 2032
- Table 58: Singapore Nordic Countries Renewable Energy Market Volume (gigawatt) Forecast, by Application 2019 & 2032
- Table 59: Thailandc Nordic Countries Renewable Energy Market Revenue (Million) Forecast, by Application 2019 & 2032
- Table 60: Thailandc Nordic Countries Renewable Energy Market Volume (gigawatt) Forecast, by Application 2019 & 2032
- Table 61: Rest of Asia Pacific Nordic Countries Renewable Energy Market Revenue (Million) Forecast, by Application 2019 & 2032
- Table 62: Rest of Asia Pacific Nordic Countries Renewable Energy Market Volume (gigawatt) Forecast, by Application 2019 & 2032
- Table 63: Nordic Countries Renewable Energy Market Revenue Million Forecast, by Country 2019 & 2032
- Table 64: Nordic Countries Renewable Energy Market Volume gigawatt Forecast, by Country 2019 & 2032
- Table 65: Brazil Nordic Countries Renewable Energy Market Revenue (Million) Forecast, by Application 2019 & 2032
- Table 66: Brazil Nordic Countries Renewable Energy Market Volume (gigawatt) Forecast, by Application 2019 & 2032
- Table 67: Argentina Nordic Countries Renewable Energy Market Revenue (Million) Forecast, by Application 2019 & 2032
- Table 68: Argentina Nordic Countries Renewable Energy Market Volume (gigawatt) Forecast, by Application 2019 & 2032
- Table 69: Peru Nordic Countries Renewable Energy Market Revenue (Million) Forecast, by Application 2019 & 2032
- Table 70: Peru Nordic Countries Renewable Energy Market Volume (gigawatt) Forecast, by Application 2019 & 2032
- Table 71: Chile Nordic Countries Renewable Energy Market Revenue (Million) Forecast, by Application 2019 & 2032
- Table 72: Chile Nordic Countries Renewable Energy Market Volume (gigawatt) Forecast, by Application 2019 & 2032
- Table 73: Colombia Nordic Countries Renewable Energy Market Revenue (Million) Forecast, by Application 2019 & 2032
- Table 74: Colombia Nordic Countries Renewable Energy Market Volume (gigawatt) Forecast, by Application 2019 & 2032
- Table 75: Ecuador Nordic Countries Renewable Energy Market Revenue (Million) Forecast, by Application 2019 & 2032
- Table 76: Ecuador Nordic Countries Renewable Energy Market Volume (gigawatt) Forecast, by Application 2019 & 2032
- Table 77: Venezuela Nordic Countries Renewable Energy Market Revenue (Million) Forecast, by Application 2019 & 2032
- Table 78: Venezuela Nordic Countries Renewable Energy Market Volume (gigawatt) Forecast, by Application 2019 & 2032
- Table 79: Rest of South America Nordic Countries Renewable Energy Market Revenue (Million) Forecast, by Application 2019 & 2032
- Table 80: Rest of South America Nordic Countries Renewable Energy Market Volume (gigawatt) Forecast, by Application 2019 & 2032
- Table 81: Nordic Countries Renewable Energy Market Revenue Million Forecast, by Country 2019 & 2032
- Table 82: Nordic Countries Renewable Energy Market Volume gigawatt Forecast, by Country 2019 & 2032
- Table 83: United States Nordic Countries Renewable Energy Market Revenue (Million) Forecast, by Application 2019 & 2032
- Table 84: United States Nordic Countries Renewable Energy Market Volume (gigawatt) Forecast, by Application 2019 & 2032
- Table 85: Canada Nordic Countries Renewable Energy Market Revenue (Million) Forecast, by Application 2019 & 2032
- Table 86: Canada Nordic Countries Renewable Energy Market Volume (gigawatt) Forecast, by Application 2019 & 2032
- Table 87: Mexico Nordic Countries Renewable Energy Market Revenue (Million) Forecast, by Application 2019 & 2032
- Table 88: Mexico Nordic Countries Renewable Energy Market Volume (gigawatt) Forecast, by Application 2019 & 2032
- Table 89: Nordic Countries Renewable Energy Market Revenue Million Forecast, by Country 2019 & 2032
- Table 90: Nordic Countries Renewable Energy Market Volume gigawatt Forecast, by Country 2019 & 2032
- Table 91: United Arab Emirates Nordic Countries Renewable Energy Market Revenue (Million) Forecast, by Application 2019 & 2032
- Table 92: United Arab Emirates Nordic Countries Renewable Energy Market Volume (gigawatt) Forecast, by Application 2019 & 2032
- Table 93: Saudi Arabia Nordic Countries Renewable Energy Market Revenue (Million) Forecast, by Application 2019 & 2032
- Table 94: Saudi Arabia Nordic Countries Renewable Energy Market Volume (gigawatt) Forecast, by Application 2019 & 2032
- Table 95: South Africa Nordic Countries Renewable Energy Market Revenue (Million) Forecast, by Application 2019 & 2032
- Table 96: South Africa Nordic Countries Renewable Energy Market Volume (gigawatt) Forecast, by Application 2019 & 2032
- Table 97: Rest of Middle East and Africa Nordic Countries Renewable Energy Market Revenue (Million) Forecast, by Application 2019 & 2032
- Table 98: Rest of Middle East and Africa Nordic Countries Renewable Energy Market Volume (gigawatt) Forecast, by Application 2019 & 2032
- Table 99: Nordic Countries Renewable Energy Market Revenue Million Forecast, by Type 2019 & 2032
- Table 100: Nordic Countries Renewable Energy Market Volume gigawatt Forecast, by Type 2019 & 2032
- Table 101: Nordic Countries Renewable Energy Market Revenue Million Forecast, by Geography 2019 & 2032
- Table 102: Nordic Countries Renewable Energy Market Volume gigawatt Forecast, by Geography 2019 & 2032
- Table 103: Nordic Countries Renewable Energy Market Revenue Million Forecast, by Country 2019 & 2032
- Table 104: Nordic Countries Renewable Energy Market Volume gigawatt Forecast, by Country 2019 & 2032
- Table 105: Nordic Countries Renewable Energy Market Revenue Million Forecast, by Type 2019 & 2032
- Table 106: Nordic Countries Renewable Energy Market Volume gigawatt Forecast, by Type 2019 & 2032
- Table 107: Nordic Countries Renewable Energy Market Revenue Million Forecast, by Geography 2019 & 2032
- Table 108: Nordic Countries Renewable Energy Market Volume gigawatt Forecast, by Geography 2019 & 2032
- Table 109: Nordic Countries Renewable Energy Market Revenue Million Forecast, by Country 2019 & 2032
- Table 110: Nordic Countries Renewable Energy Market Volume gigawatt Forecast, by Country 2019 & 2032
- Table 111: Nordic Countries Renewable Energy Market Revenue Million Forecast, by Type 2019 & 2032
- Table 112: Nordic Countries Renewable Energy Market Volume gigawatt Forecast, by Type 2019 & 2032
- Table 113: Nordic Countries Renewable Energy Market Revenue Million Forecast, by Geography 2019 & 2032
- Table 114: Nordic Countries Renewable Energy Market Volume gigawatt Forecast, by Geography 2019 & 2032
- Table 115: Nordic Countries Renewable Energy Market Revenue Million Forecast, by Country 2019 & 2032
- Table 116: Nordic Countries Renewable Energy Market Volume gigawatt Forecast, by Country 2019 & 2032
- Table 117: Nordic Countries Renewable Energy Market Revenue Million Forecast, by Type 2019 & 2032
- Table 118: Nordic Countries Renewable Energy Market Volume gigawatt Forecast, by Type 2019 & 2032
- Table 119: Nordic Countries Renewable Energy Market Revenue Million Forecast, by Geography 2019 & 2032
- Table 120: Nordic Countries Renewable Energy Market Volume gigawatt Forecast, by Geography 2019 & 2032
- Table 121: Nordic Countries Renewable Energy Market Revenue Million Forecast, by Country 2019 & 2032
- Table 122: Nordic Countries Renewable Energy Market Volume gigawatt Forecast, by Country 2019 & 2032
Frequently Asked Questions
1. What is the projected Compound Annual Growth Rate (CAGR) of the Nordic Countries Renewable Energy Market?
The projected CAGR is approximately > 5.00%.
2. Which companies are prominent players in the Nordic Countries Renewable Energy Market?
Key companies in the market include Svea Renewable Solar AB*List Not Exhaustive, Vattenfall AB, Fortum Oyj, RES Group, Siemens Gamesa Renewable Energy SA, Swedish Biofuels AB, InnoVentum AB, Axpo Holding AG, General Electric Company.
3. What are the main segments of the Nordic Countries Renewable Energy Market?
The market segments include Type, Geography.
4. Can you provide details about the market size?
The market size is estimated to be USD XX Million as of 2022.
5. What are some drivers contributing to market growth?
4.; Growing Penetration of the Technology in Long-Duration Energy Storage Applications4.; Increasing Adoption of Renewable Energy.
6. What are the notable trends driving market growth?
Hydro-based Electricity Generation is Expected to Dominate the Market.
7. Are there any restraints impacting market growth?
4.; Low Energy of Battery Cells.
8. Can you provide examples of recent developments in the market?
October 2022: Enlight Renewable Energy Ltd., an Israeli renewable energy developer, announced the start of commercial production on the first of 60 wind turbines that compose the 372-MW Bjornberget wind farm in Sweden. The wind farm uses Siemens Gamesa 6.2-MW turbines.
9. What pricing options are available for accessing the report?
Pricing options include single-user, multi-user, and enterprise licenses priced at USD 4750, USD 5250, and USD 8750 respectively.
10. Is the market size provided in terms of value or volume?
The market size is provided in terms of value, measured in Million and volume, measured in gigawatt.
11. Are there any specific market keywords associated with the report?
Yes, the market keyword associated with the report is "Nordic Countries Renewable Energy Market," which aids in identifying and referencing the specific market segment covered.
12. How do I determine which pricing option suits my needs best?
The pricing options vary based on user requirements and access needs. Individual users may opt for single-user licenses, while businesses requiring broader access may choose multi-user or enterprise licenses for cost-effective access to the report.
13. Are there any additional resources or data provided in the Nordic Countries Renewable Energy Market report?
While the report offers comprehensive insights, it's advisable to review the specific contents or supplementary materials provided to ascertain if additional resources or data are available.
14. How can I stay updated on further developments or reports in the Nordic Countries Renewable Energy Market?
To stay informed about further developments, trends, and reports in the Nordic Countries Renewable Energy Market, consider subscribing to industry newsletters, following relevant companies and organizations, or regularly checking reputable industry news sources and publications.
Methodology
Step 1 - Identification of Relevant Samples Size from Population Database


Step 2 - Approaches for Defining Global Market Size (Value, Volume* & Price*)

Note*: In applicable scenarios
Step 3 - Data Sources
Primary Research
- Web Analytics
- Survey Reports
- Research Institute
- Latest Research Reports
- Opinion Leaders
Secondary Research
- Annual Reports
- White Paper
- Latest Press Release
- Industry Association
- Paid Database
- Investor Presentations

Step 4 - Data Triangulation
Involves using different sources of information in order to increase the validity of a study
These sources are likely to be stakeholders in a program - participants, other researchers, program staff, other community members, and so on.
Then we put all data in single framework & apply various statistical tools to find out the dynamic on the market.
During the analysis stage, feedback from the stakeholder groups would be compared to determine areas of agreement as well as areas of divergence


