

Key Insights
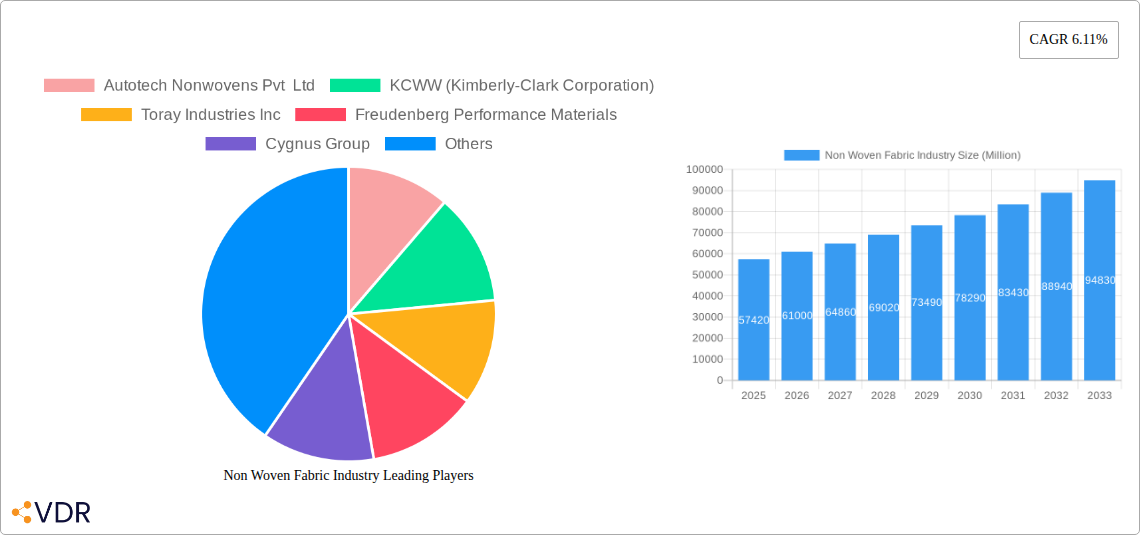
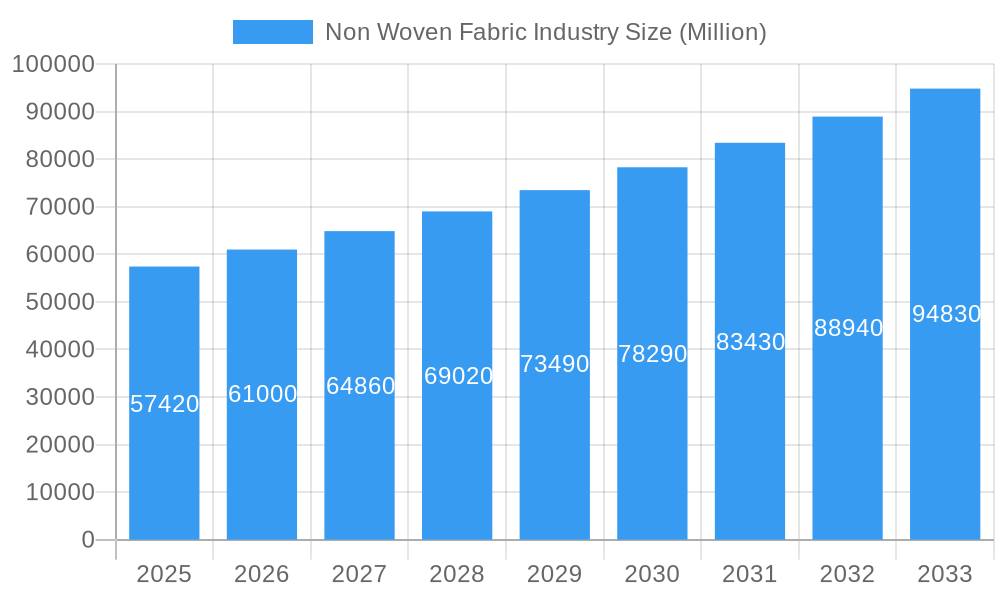
The global non-woven fabric market, valued at $57.42 billion in 2025, is projected to experience robust growth, driven by a compound annual growth rate (CAGR) of 6.11% from 2025 to 2033. This expansion is fueled by several key factors. Increasing demand across diverse end-use sectors, such as healthcare (surgical gowns, masks, and wipes), construction (geotextiles and insulation), and automotive (interior components and filtration), is a primary driver. The growing preference for lightweight, durable, and cost-effective materials in various applications further bolsters market growth. Technological advancements in spun-bond, meltblown, and wet-laid processes are continuously enhancing the properties and applications of non-woven fabrics, leading to increased adoption across industries. Furthermore, the rise in environmental consciousness is driving the development and demand for sustainable non-woven fabrics made from recycled and bio-based materials, such as polypropylene and rayon. The market is segmented by technology (spun-bond, wet-laid, dry-laid, meltblown, and others), material (polyester, polypropylene, polyethylene, rayon, and others), and end-user industry (construction, textile, healthcare, automotive, and others). This segmentation highlights the diverse applications and opportunities within the market. Competition is fierce, with key players such as Kimberly-Clark, Toray Industries, Freudenberg, and Ahlstrom-Munksjö vying for market share through innovation and expansion. Geographic expansion, particularly in rapidly developing economies of Asia-Pacific, further contributes to the market's overall growth trajectory.
Non Woven Fabric Industry Market Size (In Billion)
Regional variations in growth are anticipated, with North America and Europe maintaining significant market shares due to established industries and high consumption rates. However, the Asia-Pacific region is expected to witness the fastest growth, driven by rising disposable incomes, increasing industrialization, and burgeoning populations in countries like China and India. The market's future trajectory will depend on factors like raw material prices, technological advancements, and evolving consumer preferences toward sustainability. Addressing potential environmental concerns associated with certain non-woven production processes will be crucial for sustained, responsible growth. Overall, the non-woven fabric market presents a promising investment opportunity with substantial growth potential across various segments and geographic regions.
Non Woven Fabric Industry Company Market Share
Non Woven Fabric Industry Market Report: 2019-2033
This comprehensive report provides a detailed analysis of the Non Woven Fabric industry, encompassing market dynamics, growth trends, regional dominance, product landscape, key players, and future outlook. The study period covers 2019-2033, with 2025 as the base and estimated year. This report is invaluable for industry professionals, investors, and researchers seeking to understand and capitalize on opportunities within this rapidly evolving sector. The report forecasts a market size of xx Million units by 2033.
Non Woven Fabric Industry Market Dynamics & Structure
The nonwoven fabric market is characterized by moderate concentration, with several large players holding significant market share, alongside numerous smaller, specialized producers. The industry is driven by continuous technological innovation, particularly in spun-bond and meltblown technologies, catering to diverse end-use applications. Stringent regulatory frameworks regarding material safety and environmental impact influence manufacturing practices. Competitive substitutes, such as traditional woven fabrics, exert pressure, while the industry witnesses frequent mergers and acquisitions (M&A) activity aimed at expanding market reach and technological capabilities. The global market is expected to see a xx% increase in M&A activity by 2030, with a focus on acquiring smaller companies with niche technologies.
- Market Concentration: Moderately concentrated, with top 5 players holding approximately xx% market share in 2024.
- Technological Innovation: Significant investment in R&D for enhanced performance, sustainability, and cost-effectiveness.
- Regulatory Framework: Stringent regulations regarding material safety and environmental compliance.
- Competitive Substitutes: Traditional woven fabrics and other materials present competitive pressure.
- End-User Demographics: Growing demand across various sectors, driven by factors like increased disposable incomes and evolving consumer preferences.
- M&A Trends: Significant M&A activity focusing on expansion, technology acquisition, and diversification.
Non Woven Fabric Industry Growth Trends & Insights
The nonwoven fabric market demonstrated remarkable resilience and robust expansion during the historical period from 2019 to 2024. This surge was predominantly propelled by escalating demand from critical end-use sectors including healthcare, construction, and the automotive industry, where nonwovens offer unique performance benefits. Projections indicate that this growth trajectory is set to continue through the forecast period (2025-2033), though the pace may moderate slightly due to market maturation and evolving economic landscapes. A significant catalyst for this ongoing expansion is the rapid pace of technological innovation. The advent of advanced materials, such as biodegradable polymers and smart fibers, coupled with pioneering manufacturing processes like spunbond and meltblown technologies, are fundamentally reshaping the industry's capabilities and applications. Furthermore, a pronounced shift in consumer consciousness towards sustainable and eco-friendly products is profoundly influencing market dynamics. Manufacturers are increasingly prioritizing the development and adoption of bio-based and recyclable nonwovens, directly responding to environmental concerns and regulatory pressures. The Compound Annual Growth Rate (CAGR) for the period 2025-2033 is anticipated to be in the range of xx%, with market penetration expected to climb from approximately xx% in 2024 to a substantial xx% by 2033. Key drivers underpinning this optimistic outlook include rising disposable incomes in emerging economies, which fuels demand for consumer goods and infrastructure projects, sustained global construction activities requiring durable and versatile materials, and the continuous expansion of the healthcare industry, which relies heavily on nonwoven products for hygiene and medical applications. However, potential headwinds such as volatility in raw material prices, particularly for petrochemical-based feedstocks, and the impact of global economic downturns could introduce some degree of unpredictability to these growth rates.
Dominant Regions, Countries, or Segments in Non Woven Fabric Industry
The Asia-Pacific region dominates the nonwoven fabric market, driven by rapid industrialization, expanding construction activities, and a burgeoning healthcare sector. Within this region, China and India are key contributors to market growth. In terms of segments, spun-bond technology holds a significant share, followed by meltblown technology. Polypropylene is the dominant material due to its cost-effectiveness and versatility. The construction and healthcare end-user industries exhibit the highest growth potential, driven by large-scale infrastructure projects and increasing demand for disposable medical products.
Key Drivers:
- Asia-Pacific Region: Rapid industrialization, increasing construction activities, and strong growth in healthcare and automotive sectors.
- Spun-bond Technology: Cost-effectiveness, versatility, and wide-ranging applications.
- Polypropylene Material: Cost-effective, versatile, and widely used across various applications.
- Construction & Healthcare End-user Industries: High demand driven by infrastructure development and increasing healthcare needs.
Dominance Factors:
- Asia-Pacific: Large and growing economies, favorable government policies, and abundant raw materials.
- Spun-bond & Meltblown: Technological maturity, established manufacturing processes, and extensive applications.
- Polypropylene: Cost advantage, availability, and suitable properties for diverse applications.
- Construction & Healthcare: Significant infrastructure investments and increasing healthcare expenditure.
Non Woven Fabric Industry Product Landscape
The nonwoven fabric industry presents a rich and dynamic product landscape, encompassing a wide spectrum of materials from foundational geotextiles vital for civil engineering and erosion control, to highly specialized filtration media engineered for air and liquid purification, and advanced medical textiles designed for critical healthcare applications. Recent innovations in product development are heavily geared towards enhancing sustainability. This includes a growing incorporation of bio-based and compostable polymers, as well as recycled content, aligning with circular economy principles. Concurrently, performance is being significantly boosted through the application of cutting-edge manufacturing techniques. Technologies such as nanotechnology are being leveraged to impart novel properties, leading to nonwovens with superior breathability, exceptional tensile strength, advanced liquid repellency, enhanced flame retardancy, and improved biodegradability. These advancements are meticulously tailored to meet the increasingly sophisticated and diverse requirements of end-users across various sectors, offering tailored solutions for specific functional needs.
Key Drivers, Barriers & Challenges in Non Woven Fabric Industry
Key Drivers: A primary engine for growth is the unrelenting demand for disposable products, particularly in the burgeoning healthcare and personal hygiene sectors, driven by global health awareness and convenience. Concurrently, relentless advancements in material science are yielding nonwovens with demonstrably improved performance characteristics, opening up new application frontiers. The increasingly pervasive adoption of sustainable practices and the growing preference for eco-friendly materials by both consumers and businesses are also significant drivers. Furthermore, supportive government regulations that actively promote the use of sustainable and recyclable materials provide a crucial impetus for industry expansion.
Barriers & Challenges: The industry faces considerable challenges. Significant fluctuations in the prices of key raw materials, notably polypropylene and polyethylene, can severely impact production costs and profitability margins. Stringent and evolving environmental regulations, while necessary for sustainability, often increase compliance and production costs, presenting a hurdle for manufacturers. Intense competition from both well-established global players and agile emerging companies leads to price pressures and the constant need for differentiation. Moreover, the susceptibility of global supply chains to disruptions, as witnessed in recent years, can lead to significant production delays and inflated costs, further impacting operational efficiency and overall profitability.
Emerging Opportunities in Non Woven Fabric Industry
Emerging opportunities exist in sustainable and biodegradable nonwoven fabrics, catering to growing environmental concerns. The development of advanced materials with specialized functionalities like antimicrobial properties and improved filtration capabilities opens new avenues in healthcare and industrial applications. Expanding into untapped markets in developing economies presents significant growth potential.
Growth Accelerators in the Non Woven Fabric Industry
Technological breakthroughs in material science and manufacturing processes are major catalysts for long-term growth. Strategic partnerships between manufacturers and end-users facilitate innovation and market penetration. The expansion into new applications and geographies significantly contributes to the industry's growth trajectory.
Key Players Shaping the Non Woven Fabric Industry Market
- KCWW (Kimberly-Clark Corporation)
- Toray Industries Inc
- Freudenberg Performance Materials
- Cygnus Group
- TWE Group
- PFNonwovens Czech SRO
- Eximius Incorporation
- Glatfelter
- DuPont
- Ahlstrom-Munksj
- Fitesa
- Johns Manville
- Paramount Tech Fab Industries
- Berry Global Inc
- Autotech Nonwovens Pvt Ltd
Notable Milestones in Non Woven Fabric Industry Sector
- August 2022: Willacoochee Industrial Fabrics, Inc. (WINFAB) announces investment in a new nonwoven geotextile production line, signifying expansion in the geosynthetics market.
- June 2022: Asten Johnson creates AJ Nonwovens, indicating increased focus on production capacity and speed in the North American market.
In-Depth Non Woven Fabric Industry Market Outlook
The nonwoven fabric market is poised for a future characterized by significant opportunities and sustained growth, underpinned by several powerful trends. Continuous leaps in technological innovation, including the development of novel fiber structures, advanced functional coatings, and more efficient production methodologies, will unlock new application potential and enhance existing ones. The ongoing diversification of applications across an ever-expanding array of sectors—from advanced composites and energy storage to specialized agricultural films and smart textiles—will fuel demand. Crucially, the unwavering global emphasis on sustainability, coupled with evolving consumer and regulatory expectations, will steer market development towards eco-friendly and circular solutions. Strategic investments in research and development (R&D) will be paramount for companies seeking to stay at the forefront of innovation. Furthermore, forging strategic partnerships, pursuing mergers and acquisitions, and aggressively pursuing market expansion into high-growth regions will be critical for shaping the industry's trajectory. These concerted efforts will not only foster groundbreaking innovations but also pave the way for substantial market expansion and enhanced profitability in the coming years.
Non Woven Fabric Industry Segmentation
-
1. Technology
- 1.1. Spun-bond
- 1.2. Wet-laid
- 1.3. Dry-laid
- 1.4. Other Technologies (Meltblown, and others)
-
2. Material
- 2.1. Polyester
- 2.2. Polypropylene
- 2.3. Polyethylene
- 2.4. Rayon (Viscose)
- 2.5. Other Materials (Cotton and other bio based)
-
3. End-user Industry
- 3.1. Construction
- 3.2. Textile
- 3.3. Healthcare
- 3.4. Automotive
- 3.5. Other En
Non Woven Fabric Industry Segmentation By Geography
-
1. Asia Pacific
- 1.1. China
- 1.2. India
- 1.3. Japan
- 1.4. South Korea
- 1.5. Malaysia
- 1.6. Thailand
- 1.7. Indonesia
- 1.8. Vietnam
- 1.9. Rest of Asia Pacific
-
2. North America
- 2.1. United States
- 2.2. Canada
- 2.3. Mexico
-
3. Europe
- 3.1. Germany
- 3.2. United Kingdom
- 3.3. France
- 3.4. Italy
- 3.5. Spain
- 3.6. Turkey
- 3.7. Russia
- 3.8. NORDIC Countries
- 3.9. Rest of Europe
-
4. South America
- 4.1. Brazil
- 4.2. Argentina
- 4.3. Colombia
- 4.4. Rest of South America
-
5. Middle East and Africa
- 5.1. Saudi Arabia
- 5.2. Nigeria
- 5.3. Qatar
- 5.4. Egypt
- 5.5. United Arab Emirates
- 5.6. South Africa
- 5.7. Rest of Middle East and Africa
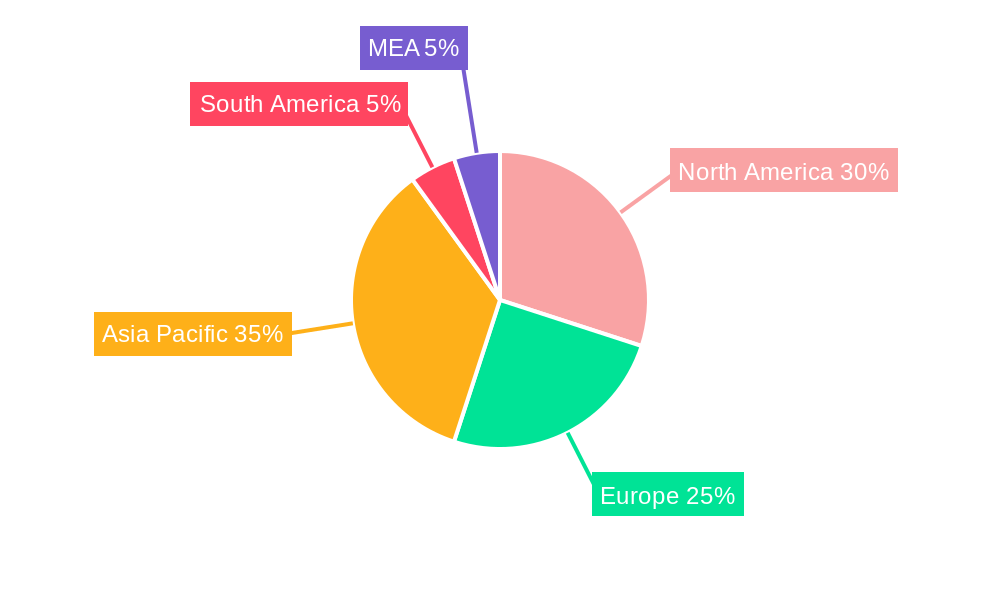
Non Woven Fabric Industry Regional Market Share
Geographic Coverage of Non Woven Fabric Industry
Non Woven Fabric Industry REPORT HIGHLIGHTS
| Aspects | Details |
|---|---|
| Study Period | 2020-2034 |
| Base Year | 2025 |
| Estimated Year | 2026 |
| Forecast Period | 2026-2034 |
| Historical Period | 2020-2025 |
| Growth Rate | CAGR of 6.11% from 2020-2034 |
| Segmentation |
|
Table of Contents
- 1. Introduction
- 1.1. Research Scope
- 1.2. Market Segmentation
- 1.3. Research Objective
- 1.4. Definitions and Assumptions
- 2. Executive Summary
- 2.1. Market Snapshot
- 3. Market Dynamics
- 3.1. Market Drivers
- 3.2. Market Restrains
- 3.3. Market Trends
- 3.4. Market Opportunities
- 4. Market Factor Analysis
- 4.1. Porters Five Forces
- 4.1.1. Bargaining Power of Suppliers
- 4.1.2. Bargaining Power of Buyers
- 4.1.3. Threat of New Entrants
- 4.1.4. Threat of Substitutes
- 4.1.5. Competitive Rivalry
- 4.2. PESTEL analysis
- 4.3. BCG Analysis
- 4.3.1. Stars (High Growth, High Market Share)
- 4.3.2. Cash Cows (Low Growth, High Market Share)
- 4.3.3. Question Mark (High Growth, Low Market Share)
- 4.3.4. Dogs (Low Growth, Low Market Share)
- 4.4. Ansoff Matrix Analysis
- 4.5. Supply Chain Analysis
- 4.6. Regulatory Landscape
- 4.7. Current Market Potential and Opportunity Assessment (TAM–SAM–SOM Framework)
- 4.8. VDR Analyst Note
- 4.1. Porters Five Forces
- 5. Market Analysis, Insights and Forecast 2021-2033
- 5.1. Market Analysis, Insights and Forecast - by Technology
- 5.1.1. Spun-bond
- 5.1.2. Wet-laid
- 5.1.3. Dry-laid
- 5.1.4. Other Technologies (Meltblown, and others)
- 5.2. Market Analysis, Insights and Forecast - by Material
- 5.2.1. Polyester
- 5.2.2. Polypropylene
- 5.2.3. Polyethylene
- 5.2.4. Rayon (Viscose)
- 5.2.5. Other Materials (Cotton and other bio based)
- 5.3. Market Analysis, Insights and Forecast - by End-user Industry
- 5.3.1. Construction
- 5.3.2. Textile
- 5.3.3. Healthcare
- 5.3.4. Automotive
- 5.3.5. Other En
- 5.4. Market Analysis, Insights and Forecast - by Region
- 5.4.1. Asia Pacific
- 5.4.2. North America
- 5.4.3. Europe
- 5.4.4. South America
- 5.4.5. Middle East and Africa
- 5.1. Market Analysis, Insights and Forecast - by Technology
- 6. Global Non Woven Fabric Industry Analysis, Insights and Forecast, 2021-2033
- 6.1. Market Analysis, Insights and Forecast - by Technology
- 6.1.1. Spun-bond
- 6.1.2. Wet-laid
- 6.1.3. Dry-laid
- 6.1.4. Other Technologies (Meltblown, and others)
- 6.2. Market Analysis, Insights and Forecast - by Material
- 6.2.1. Polyester
- 6.2.2. Polypropylene
- 6.2.3. Polyethylene
- 6.2.4. Rayon (Viscose)
- 6.2.5. Other Materials (Cotton and other bio based)
- 6.3. Market Analysis, Insights and Forecast - by End-user Industry
- 6.3.1. Construction
- 6.3.2. Textile
- 6.3.3. Healthcare
- 6.3.4. Automotive
- 6.3.5. Other En
- 6.1. Market Analysis, Insights and Forecast - by Technology
- 7. Asia Pacific Non Woven Fabric Industry Analysis, Insights and Forecast, 2021-2033
- 7.1. Market Analysis, Insights and Forecast - by Technology
- 7.1.1. Spun-bond
- 7.1.2. Wet-laid
- 7.1.3. Dry-laid
- 7.1.4. Other Technologies (Meltblown, and others)
- 7.2. Market Analysis, Insights and Forecast - by Material
- 7.2.1. Polyester
- 7.2.2. Polypropylene
- 7.2.3. Polyethylene
- 7.2.4. Rayon (Viscose)
- 7.2.5. Other Materials (Cotton and other bio based)
- 7.3. Market Analysis, Insights and Forecast - by End-user Industry
- 7.3.1. Construction
- 7.3.2. Textile
- 7.3.3. Healthcare
- 7.3.4. Automotive
- 7.3.5. Other En
- 7.1. Market Analysis, Insights and Forecast - by Technology
- 8. North America Non Woven Fabric Industry Analysis, Insights and Forecast, 2021-2033
- 8.1. Market Analysis, Insights and Forecast - by Technology
- 8.1.1. Spun-bond
- 8.1.2. Wet-laid
- 8.1.3. Dry-laid
- 8.1.4. Other Technologies (Meltblown, and others)
- 8.2. Market Analysis, Insights and Forecast - by Material
- 8.2.1. Polyester
- 8.2.2. Polypropylene
- 8.2.3. Polyethylene
- 8.2.4. Rayon (Viscose)
- 8.2.5. Other Materials (Cotton and other bio based)
- 8.3. Market Analysis, Insights and Forecast - by End-user Industry
- 8.3.1. Construction
- 8.3.2. Textile
- 8.3.3. Healthcare
- 8.3.4. Automotive
- 8.3.5. Other En
- 8.1. Market Analysis, Insights and Forecast - by Technology
- 9. Europe Non Woven Fabric Industry Analysis, Insights and Forecast, 2021-2033
- 9.1. Market Analysis, Insights and Forecast - by Technology
- 9.1.1. Spun-bond
- 9.1.2. Wet-laid
- 9.1.3. Dry-laid
- 9.1.4. Other Technologies (Meltblown, and others)
- 9.2. Market Analysis, Insights and Forecast - by Material
- 9.2.1. Polyester
- 9.2.2. Polypropylene
- 9.2.3. Polyethylene
- 9.2.4. Rayon (Viscose)
- 9.2.5. Other Materials (Cotton and other bio based)
- 9.3. Market Analysis, Insights and Forecast - by End-user Industry
- 9.3.1. Construction
- 9.3.2. Textile
- 9.3.3. Healthcare
- 9.3.4. Automotive
- 9.3.5. Other En
- 9.1. Market Analysis, Insights and Forecast - by Technology
- 10. South America Non Woven Fabric Industry Analysis, Insights and Forecast, 2021-2033
- 10.1. Market Analysis, Insights and Forecast - by Technology
- 10.1.1. Spun-bond
- 10.1.2. Wet-laid
- 10.1.3. Dry-laid
- 10.1.4. Other Technologies (Meltblown, and others)
- 10.2. Market Analysis, Insights and Forecast - by Material
- 10.2.1. Polyester
- 10.2.2. Polypropylene
- 10.2.3. Polyethylene
- 10.2.4. Rayon (Viscose)
- 10.2.5. Other Materials (Cotton and other bio based)
- 10.3. Market Analysis, Insights and Forecast - by End-user Industry
- 10.3.1. Construction
- 10.3.2. Textile
- 10.3.3. Healthcare
- 10.3.4. Automotive
- 10.3.5. Other En
- 10.1. Market Analysis, Insights and Forecast - by Technology
- 11. Middle East and Africa Non Woven Fabric Industry Analysis, Insights and Forecast, 2021-2033
- 11.1. Market Analysis, Insights and Forecast - by Technology
- 11.1.1. Spun-bond
- 11.1.2. Wet-laid
- 11.1.3. Dry-laid
- 11.1.4. Other Technologies (Meltblown, and others)
- 11.2. Market Analysis, Insights and Forecast - by Material
- 11.2.1. Polyester
- 11.2.2. Polypropylene
- 11.2.3. Polyethylene
- 11.2.4. Rayon (Viscose)
- 11.2.5. Other Materials (Cotton and other bio based)
- 11.3. Market Analysis, Insights and Forecast - by End-user Industry
- 11.3.1. Construction
- 11.3.2. Textile
- 11.3.3. Healthcare
- 11.3.4. Automotive
- 11.3.5. Other En
- 11.1. Market Analysis, Insights and Forecast - by Technology
- 12. Competitive Analysis
- 12.1. Company Profiles
- 12.1.1 Autotech Nonwovens Pvt Ltd
- 12.1.1.1. Company Overview
- 12.1.1.2. Products
- 12.1.1.3. Company Financials
- 12.1.1.4. SWOT Analysis
- 12.1.2 KCWW (Kimberly-Clark Corporation)
- 12.1.2.1. Company Overview
- 12.1.2.2. Products
- 12.1.2.3. Company Financials
- 12.1.2.4. SWOT Analysis
- 12.1.3 Toray Industries Inc
- 12.1.3.1. Company Overview
- 12.1.3.2. Products
- 12.1.3.3. Company Financials
- 12.1.3.4. SWOT Analysis
- 12.1.4 Freudenberg Performance Materials
- 12.1.4.1. Company Overview
- 12.1.4.2. Products
- 12.1.4.3. Company Financials
- 12.1.4.4. SWOT Analysis
- 12.1.5 Cygnus Group
- 12.1.5.1. Company Overview
- 12.1.5.2. Products
- 12.1.5.3. Company Financials
- 12.1.5.4. SWOT Analysis
- 12.1.6 TWE Group*List Not Exhaustive
- 12.1.6.1. Company Overview
- 12.1.6.2. Products
- 12.1.6.3. Company Financials
- 12.1.6.4. SWOT Analysis
- 12.1.7 PFNonwovens Czech SRO
- 12.1.7.1. Company Overview
- 12.1.7.2. Products
- 12.1.7.3. Company Financials
- 12.1.7.4. SWOT Analysis
- 12.1.8 Eximius Incorporation
- 12.1.8.1. Company Overview
- 12.1.8.2. Products
- 12.1.8.3. Company Financials
- 12.1.8.4. SWOT Analysis
- 12.1.9 Glatfelter
- 12.1.9.1. Company Overview
- 12.1.9.2. Products
- 12.1.9.3. Company Financials
- 12.1.9.4. SWOT Analysis
- 12.1.10 DuPont
- 12.1.10.1. Company Overview
- 12.1.10.2. Products
- 12.1.10.3. Company Financials
- 12.1.10.4. SWOT Analysis
- 12.1.11 Ahlstrom-Munksj
- 12.1.11.1. Company Overview
- 12.1.11.2. Products
- 12.1.11.3. Company Financials
- 12.1.11.4. SWOT Analysis
- 12.1.12 Fitesa
- 12.1.12.1. Company Overview
- 12.1.12.2. Products
- 12.1.12.3. Company Financials
- 12.1.12.4. SWOT Analysis
- 12.1.13 Johns Manville
- 12.1.13.1. Company Overview
- 12.1.13.2. Products
- 12.1.13.3. Company Financials
- 12.1.13.4. SWOT Analysis
- 12.1.14 Paramount Tech Fab Industries
- 12.1.14.1. Company Overview
- 12.1.14.2. Products
- 12.1.14.3. Company Financials
- 12.1.14.4. SWOT Analysis
- 12.1.15 Berry Global Inc
- 12.1.15.1. Company Overview
- 12.1.15.2. Products
- 12.1.15.3. Company Financials
- 12.1.15.4. SWOT Analysis
- 12.1.1 Autotech Nonwovens Pvt Ltd
- 12.2. Market Entropy
- 12.2.1 Company's Key Areas Served
- 12.2.2 Recent Developments
- 12.3. Company Market Share Analysis 2025
- 12.3.1 Top 5 Companies Market Share Analysis
- 12.3.2 Top 3 Companies Market Share Analysis
- 12.4. List of Potential Customers
- 13. Research Methodology
List of Figures
- Figure 1: Global Non Woven Fabric Industry Revenue Breakdown (Million, %) by Region 2025 & 2033
- Figure 2: Global Non Woven Fabric Industry Volume Breakdown (K Tons, %) by Region 2025 & 2033
- Figure 3: Asia Pacific Non Woven Fabric Industry Revenue (Million), by Technology 2025 & 2033
- Figure 4: Asia Pacific Non Woven Fabric Industry Volume (K Tons), by Technology 2025 & 2033
- Figure 5: Asia Pacific Non Woven Fabric Industry Revenue Share (%), by Technology 2025 & 2033
- Figure 6: Asia Pacific Non Woven Fabric Industry Volume Share (%), by Technology 2025 & 2033
- Figure 7: Asia Pacific Non Woven Fabric Industry Revenue (Million), by Material 2025 & 2033
- Figure 8: Asia Pacific Non Woven Fabric Industry Volume (K Tons), by Material 2025 & 2033
- Figure 9: Asia Pacific Non Woven Fabric Industry Revenue Share (%), by Material 2025 & 2033
- Figure 10: Asia Pacific Non Woven Fabric Industry Volume Share (%), by Material 2025 & 2033
- Figure 11: Asia Pacific Non Woven Fabric Industry Revenue (Million), by End-user Industry 2025 & 2033
- Figure 12: Asia Pacific Non Woven Fabric Industry Volume (K Tons), by End-user Industry 2025 & 2033
- Figure 13: Asia Pacific Non Woven Fabric Industry Revenue Share (%), by End-user Industry 2025 & 2033
- Figure 14: Asia Pacific Non Woven Fabric Industry Volume Share (%), by End-user Industry 2025 & 2033
- Figure 15: Asia Pacific Non Woven Fabric Industry Revenue (Million), by Country 2025 & 2033
- Figure 16: Asia Pacific Non Woven Fabric Industry Volume (K Tons), by Country 2025 & 2033
- Figure 17: Asia Pacific Non Woven Fabric Industry Revenue Share (%), by Country 2025 & 2033
- Figure 18: Asia Pacific Non Woven Fabric Industry Volume Share (%), by Country 2025 & 2033
- Figure 19: North America Non Woven Fabric Industry Revenue (Million), by Technology 2025 & 2033
- Figure 20: North America Non Woven Fabric Industry Volume (K Tons), by Technology 2025 & 2033
- Figure 21: North America Non Woven Fabric Industry Revenue Share (%), by Technology 2025 & 2033
- Figure 22: North America Non Woven Fabric Industry Volume Share (%), by Technology 2025 & 2033
- Figure 23: North America Non Woven Fabric Industry Revenue (Million), by Material 2025 & 2033
- Figure 24: North America Non Woven Fabric Industry Volume (K Tons), by Material 2025 & 2033
- Figure 25: North America Non Woven Fabric Industry Revenue Share (%), by Material 2025 & 2033
- Figure 26: North America Non Woven Fabric Industry Volume Share (%), by Material 2025 & 2033
- Figure 27: North America Non Woven Fabric Industry Revenue (Million), by End-user Industry 2025 & 2033
- Figure 28: North America Non Woven Fabric Industry Volume (K Tons), by End-user Industry 2025 & 2033
- Figure 29: North America Non Woven Fabric Industry Revenue Share (%), by End-user Industry 2025 & 2033
- Figure 30: North America Non Woven Fabric Industry Volume Share (%), by End-user Industry 2025 & 2033
- Figure 31: North America Non Woven Fabric Industry Revenue (Million), by Country 2025 & 2033
- Figure 32: North America Non Woven Fabric Industry Volume (K Tons), by Country 2025 & 2033
- Figure 33: North America Non Woven Fabric Industry Revenue Share (%), by Country 2025 & 2033
- Figure 34: North America Non Woven Fabric Industry Volume Share (%), by Country 2025 & 2033
- Figure 35: Europe Non Woven Fabric Industry Revenue (Million), by Technology 2025 & 2033
- Figure 36: Europe Non Woven Fabric Industry Volume (K Tons), by Technology 2025 & 2033
- Figure 37: Europe Non Woven Fabric Industry Revenue Share (%), by Technology 2025 & 2033
- Figure 38: Europe Non Woven Fabric Industry Volume Share (%), by Technology 2025 & 2033
- Figure 39: Europe Non Woven Fabric Industry Revenue (Million), by Material 2025 & 2033
- Figure 40: Europe Non Woven Fabric Industry Volume (K Tons), by Material 2025 & 2033
- Figure 41: Europe Non Woven Fabric Industry Revenue Share (%), by Material 2025 & 2033
- Figure 42: Europe Non Woven Fabric Industry Volume Share (%), by Material 2025 & 2033
- Figure 43: Europe Non Woven Fabric Industry Revenue (Million), by End-user Industry 2025 & 2033
- Figure 44: Europe Non Woven Fabric Industry Volume (K Tons), by End-user Industry 2025 & 2033
- Figure 45: Europe Non Woven Fabric Industry Revenue Share (%), by End-user Industry 2025 & 2033
- Figure 46: Europe Non Woven Fabric Industry Volume Share (%), by End-user Industry 2025 & 2033
- Figure 47: Europe Non Woven Fabric Industry Revenue (Million), by Country 2025 & 2033
- Figure 48: Europe Non Woven Fabric Industry Volume (K Tons), by Country 2025 & 2033
- Figure 49: Europe Non Woven Fabric Industry Revenue Share (%), by Country 2025 & 2033
- Figure 50: Europe Non Woven Fabric Industry Volume Share (%), by Country 2025 & 2033
- Figure 51: South America Non Woven Fabric Industry Revenue (Million), by Technology 2025 & 2033
- Figure 52: South America Non Woven Fabric Industry Volume (K Tons), by Technology 2025 & 2033
- Figure 53: South America Non Woven Fabric Industry Revenue Share (%), by Technology 2025 & 2033
- Figure 54: South America Non Woven Fabric Industry Volume Share (%), by Technology 2025 & 2033
- Figure 55: South America Non Woven Fabric Industry Revenue (Million), by Material 2025 & 2033
- Figure 56: South America Non Woven Fabric Industry Volume (K Tons), by Material 2025 & 2033
- Figure 57: South America Non Woven Fabric Industry Revenue Share (%), by Material 2025 & 2033
- Figure 58: South America Non Woven Fabric Industry Volume Share (%), by Material 2025 & 2033
- Figure 59: South America Non Woven Fabric Industry Revenue (Million), by End-user Industry 2025 & 2033
- Figure 60: South America Non Woven Fabric Industry Volume (K Tons), by End-user Industry 2025 & 2033
- Figure 61: South America Non Woven Fabric Industry Revenue Share (%), by End-user Industry 2025 & 2033
- Figure 62: South America Non Woven Fabric Industry Volume Share (%), by End-user Industry 2025 & 2033
- Figure 63: South America Non Woven Fabric Industry Revenue (Million), by Country 2025 & 2033
- Figure 64: South America Non Woven Fabric Industry Volume (K Tons), by Country 2025 & 2033
- Figure 65: South America Non Woven Fabric Industry Revenue Share (%), by Country 2025 & 2033
- Figure 66: South America Non Woven Fabric Industry Volume Share (%), by Country 2025 & 2033
- Figure 67: Middle East and Africa Non Woven Fabric Industry Revenue (Million), by Technology 2025 & 2033
- Figure 68: Middle East and Africa Non Woven Fabric Industry Volume (K Tons), by Technology 2025 & 2033
- Figure 69: Middle East and Africa Non Woven Fabric Industry Revenue Share (%), by Technology 2025 & 2033
- Figure 70: Middle East and Africa Non Woven Fabric Industry Volume Share (%), by Technology 2025 & 2033
- Figure 71: Middle East and Africa Non Woven Fabric Industry Revenue (Million), by Material 2025 & 2033
- Figure 72: Middle East and Africa Non Woven Fabric Industry Volume (K Tons), by Material 2025 & 2033
- Figure 73: Middle East and Africa Non Woven Fabric Industry Revenue Share (%), by Material 2025 & 2033
- Figure 74: Middle East and Africa Non Woven Fabric Industry Volume Share (%), by Material 2025 & 2033
- Figure 75: Middle East and Africa Non Woven Fabric Industry Revenue (Million), by End-user Industry 2025 & 2033
- Figure 76: Middle East and Africa Non Woven Fabric Industry Volume (K Tons), by End-user Industry 2025 & 2033
- Figure 77: Middle East and Africa Non Woven Fabric Industry Revenue Share (%), by End-user Industry 2025 & 2033
- Figure 78: Middle East and Africa Non Woven Fabric Industry Volume Share (%), by End-user Industry 2025 & 2033
- Figure 79: Middle East and Africa Non Woven Fabric Industry Revenue (Million), by Country 2025 & 2033
- Figure 80: Middle East and Africa Non Woven Fabric Industry Volume (K Tons), by Country 2025 & 2033
- Figure 81: Middle East and Africa Non Woven Fabric Industry Revenue Share (%), by Country 2025 & 2033
- Figure 82: Middle East and Africa Non Woven Fabric Industry Volume Share (%), by Country 2025 & 2033
List of Tables
- Table 1: Global Non Woven Fabric Industry Revenue Million Forecast, by Technology 2020 & 2033
- Table 2: Global Non Woven Fabric Industry Volume K Tons Forecast, by Technology 2020 & 2033
- Table 3: Global Non Woven Fabric Industry Revenue Million Forecast, by Material 2020 & 2033
- Table 4: Global Non Woven Fabric Industry Volume K Tons Forecast, by Material 2020 & 2033
- Table 5: Global Non Woven Fabric Industry Revenue Million Forecast, by End-user Industry 2020 & 2033
- Table 6: Global Non Woven Fabric Industry Volume K Tons Forecast, by End-user Industry 2020 & 2033
- Table 7: Global Non Woven Fabric Industry Revenue Million Forecast, by Region 2020 & 2033
- Table 8: Global Non Woven Fabric Industry Volume K Tons Forecast, by Region 2020 & 2033
- Table 9: Global Non Woven Fabric Industry Revenue Million Forecast, by Technology 2020 & 2033
- Table 10: Global Non Woven Fabric Industry Volume K Tons Forecast, by Technology 2020 & 2033
- Table 11: Global Non Woven Fabric Industry Revenue Million Forecast, by Material 2020 & 2033
- Table 12: Global Non Woven Fabric Industry Volume K Tons Forecast, by Material 2020 & 2033
- Table 13: Global Non Woven Fabric Industry Revenue Million Forecast, by End-user Industry 2020 & 2033
- Table 14: Global Non Woven Fabric Industry Volume K Tons Forecast, by End-user Industry 2020 & 2033
- Table 15: Global Non Woven Fabric Industry Revenue Million Forecast, by Country 2020 & 2033
- Table 16: Global Non Woven Fabric Industry Volume K Tons Forecast, by Country 2020 & 2033
- Table 17: China Non Woven Fabric Industry Revenue (Million) Forecast, by Application 2020 & 2033
- Table 18: China Non Woven Fabric Industry Volume (K Tons) Forecast, by Application 2020 & 2033
- Table 19: India Non Woven Fabric Industry Revenue (Million) Forecast, by Application 2020 & 2033
- Table 20: India Non Woven Fabric Industry Volume (K Tons) Forecast, by Application 2020 & 2033
- Table 21: Japan Non Woven Fabric Industry Revenue (Million) Forecast, by Application 2020 & 2033
- Table 22: Japan Non Woven Fabric Industry Volume (K Tons) Forecast, by Application 2020 & 2033
- Table 23: South Korea Non Woven Fabric Industry Revenue (Million) Forecast, by Application 2020 & 2033
- Table 24: South Korea Non Woven Fabric Industry Volume (K Tons) Forecast, by Application 2020 & 2033
- Table 25: Malaysia Non Woven Fabric Industry Revenue (Million) Forecast, by Application 2020 & 2033
- Table 26: Malaysia Non Woven Fabric Industry Volume (K Tons) Forecast, by Application 2020 & 2033
- Table 27: Thailand Non Woven Fabric Industry Revenue (Million) Forecast, by Application 2020 & 2033
- Table 28: Thailand Non Woven Fabric Industry Volume (K Tons) Forecast, by Application 2020 & 2033
- Table 29: Indonesia Non Woven Fabric Industry Revenue (Million) Forecast, by Application 2020 & 2033
- Table 30: Indonesia Non Woven Fabric Industry Volume (K Tons) Forecast, by Application 2020 & 2033
- Table 31: Vietnam Non Woven Fabric Industry Revenue (Million) Forecast, by Application 2020 & 2033
- Table 32: Vietnam Non Woven Fabric Industry Volume (K Tons) Forecast, by Application 2020 & 2033
- Table 33: Rest of Asia Pacific Non Woven Fabric Industry Revenue (Million) Forecast, by Application 2020 & 2033
- Table 34: Rest of Asia Pacific Non Woven Fabric Industry Volume (K Tons) Forecast, by Application 2020 & 2033
- Table 35: Global Non Woven Fabric Industry Revenue Million Forecast, by Technology 2020 & 2033
- Table 36: Global Non Woven Fabric Industry Volume K Tons Forecast, by Technology 2020 & 2033
- Table 37: Global Non Woven Fabric Industry Revenue Million Forecast, by Material 2020 & 2033
- Table 38: Global Non Woven Fabric Industry Volume K Tons Forecast, by Material 2020 & 2033
- Table 39: Global Non Woven Fabric Industry Revenue Million Forecast, by End-user Industry 2020 & 2033
- Table 40: Global Non Woven Fabric Industry Volume K Tons Forecast, by End-user Industry 2020 & 2033
- Table 41: Global Non Woven Fabric Industry Revenue Million Forecast, by Country 2020 & 2033
- Table 42: Global Non Woven Fabric Industry Volume K Tons Forecast, by Country 2020 & 2033
- Table 43: United States Non Woven Fabric Industry Revenue (Million) Forecast, by Application 2020 & 2033
- Table 44: United States Non Woven Fabric Industry Volume (K Tons) Forecast, by Application 2020 & 2033
- Table 45: Canada Non Woven Fabric Industry Revenue (Million) Forecast, by Application 2020 & 2033
- Table 46: Canada Non Woven Fabric Industry Volume (K Tons) Forecast, by Application 2020 & 2033
- Table 47: Mexico Non Woven Fabric Industry Revenue (Million) Forecast, by Application 2020 & 2033
- Table 48: Mexico Non Woven Fabric Industry Volume (K Tons) Forecast, by Application 2020 & 2033
- Table 49: Global Non Woven Fabric Industry Revenue Million Forecast, by Technology 2020 & 2033
- Table 50: Global Non Woven Fabric Industry Volume K Tons Forecast, by Technology 2020 & 2033
- Table 51: Global Non Woven Fabric Industry Revenue Million Forecast, by Material 2020 & 2033
- Table 52: Global Non Woven Fabric Industry Volume K Tons Forecast, by Material 2020 & 2033
- Table 53: Global Non Woven Fabric Industry Revenue Million Forecast, by End-user Industry 2020 & 2033
- Table 54: Global Non Woven Fabric Industry Volume K Tons Forecast, by End-user Industry 2020 & 2033
- Table 55: Global Non Woven Fabric Industry Revenue Million Forecast, by Country 2020 & 2033
- Table 56: Global Non Woven Fabric Industry Volume K Tons Forecast, by Country 2020 & 2033
- Table 57: Germany Non Woven Fabric Industry Revenue (Million) Forecast, by Application 2020 & 2033
- Table 58: Germany Non Woven Fabric Industry Volume (K Tons) Forecast, by Application 2020 & 2033
- Table 59: United Kingdom Non Woven Fabric Industry Revenue (Million) Forecast, by Application 2020 & 2033
- Table 60: United Kingdom Non Woven Fabric Industry Volume (K Tons) Forecast, by Application 2020 & 2033
- Table 61: France Non Woven Fabric Industry Revenue (Million) Forecast, by Application 2020 & 2033
- Table 62: France Non Woven Fabric Industry Volume (K Tons) Forecast, by Application 2020 & 2033
- Table 63: Italy Non Woven Fabric Industry Revenue (Million) Forecast, by Application 2020 & 2033
- Table 64: Italy Non Woven Fabric Industry Volume (K Tons) Forecast, by Application 2020 & 2033
- Table 65: Spain Non Woven Fabric Industry Revenue (Million) Forecast, by Application 2020 & 2033
- Table 66: Spain Non Woven Fabric Industry Volume (K Tons) Forecast, by Application 2020 & 2033
- Table 67: Turkey Non Woven Fabric Industry Revenue (Million) Forecast, by Application 2020 & 2033
- Table 68: Turkey Non Woven Fabric Industry Volume (K Tons) Forecast, by Application 2020 & 2033
- Table 69: Russia Non Woven Fabric Industry Revenue (Million) Forecast, by Application 2020 & 2033
- Table 70: Russia Non Woven Fabric Industry Volume (K Tons) Forecast, by Application 2020 & 2033
- Table 71: NORDIC Countries Non Woven Fabric Industry Revenue (Million) Forecast, by Application 2020 & 2033
- Table 72: NORDIC Countries Non Woven Fabric Industry Volume (K Tons) Forecast, by Application 2020 & 2033
- Table 73: Rest of Europe Non Woven Fabric Industry Revenue (Million) Forecast, by Application 2020 & 2033
- Table 74: Rest of Europe Non Woven Fabric Industry Volume (K Tons) Forecast, by Application 2020 & 2033
- Table 75: Global Non Woven Fabric Industry Revenue Million Forecast, by Technology 2020 & 2033
- Table 76: Global Non Woven Fabric Industry Volume K Tons Forecast, by Technology 2020 & 2033
- Table 77: Global Non Woven Fabric Industry Revenue Million Forecast, by Material 2020 & 2033
- Table 78: Global Non Woven Fabric Industry Volume K Tons Forecast, by Material 2020 & 2033
- Table 79: Global Non Woven Fabric Industry Revenue Million Forecast, by End-user Industry 2020 & 2033
- Table 80: Global Non Woven Fabric Industry Volume K Tons Forecast, by End-user Industry 2020 & 2033
- Table 81: Global Non Woven Fabric Industry Revenue Million Forecast, by Country 2020 & 2033
- Table 82: Global Non Woven Fabric Industry Volume K Tons Forecast, by Country 2020 & 2033
- Table 83: Brazil Non Woven Fabric Industry Revenue (Million) Forecast, by Application 2020 & 2033
- Table 84: Brazil Non Woven Fabric Industry Volume (K Tons) Forecast, by Application 2020 & 2033
- Table 85: Argentina Non Woven Fabric Industry Revenue (Million) Forecast, by Application 2020 & 2033
- Table 86: Argentina Non Woven Fabric Industry Volume (K Tons) Forecast, by Application 2020 & 2033
- Table 87: Colombia Non Woven Fabric Industry Revenue (Million) Forecast, by Application 2020 & 2033
- Table 88: Colombia Non Woven Fabric Industry Volume (K Tons) Forecast, by Application 2020 & 2033
- Table 89: Rest of South America Non Woven Fabric Industry Revenue (Million) Forecast, by Application 2020 & 2033
- Table 90: Rest of South America Non Woven Fabric Industry Volume (K Tons) Forecast, by Application 2020 & 2033
- Table 91: Global Non Woven Fabric Industry Revenue Million Forecast, by Technology 2020 & 2033
- Table 92: Global Non Woven Fabric Industry Volume K Tons Forecast, by Technology 2020 & 2033
- Table 93: Global Non Woven Fabric Industry Revenue Million Forecast, by Material 2020 & 2033
- Table 94: Global Non Woven Fabric Industry Volume K Tons Forecast, by Material 2020 & 2033
- Table 95: Global Non Woven Fabric Industry Revenue Million Forecast, by End-user Industry 2020 & 2033
- Table 96: Global Non Woven Fabric Industry Volume K Tons Forecast, by End-user Industry 2020 & 2033
- Table 97: Global Non Woven Fabric Industry Revenue Million Forecast, by Country 2020 & 2033
- Table 98: Global Non Woven Fabric Industry Volume K Tons Forecast, by Country 2020 & 2033
- Table 99: Saudi Arabia Non Woven Fabric Industry Revenue (Million) Forecast, by Application 2020 & 2033
- Table 100: Saudi Arabia Non Woven Fabric Industry Volume (K Tons) Forecast, by Application 2020 & 2033
- Table 101: Nigeria Non Woven Fabric Industry Revenue (Million) Forecast, by Application 2020 & 2033
- Table 102: Nigeria Non Woven Fabric Industry Volume (K Tons) Forecast, by Application 2020 & 2033
- Table 103: Qatar Non Woven Fabric Industry Revenue (Million) Forecast, by Application 2020 & 2033
- Table 104: Qatar Non Woven Fabric Industry Volume (K Tons) Forecast, by Application 2020 & 2033
- Table 105: Egypt Non Woven Fabric Industry Revenue (Million) Forecast, by Application 2020 & 2033
- Table 106: Egypt Non Woven Fabric Industry Volume (K Tons) Forecast, by Application 2020 & 2033
- Table 107: United Arab Emirates Non Woven Fabric Industry Revenue (Million) Forecast, by Application 2020 & 2033
- Table 108: United Arab Emirates Non Woven Fabric Industry Volume (K Tons) Forecast, by Application 2020 & 2033
- Table 109: South Africa Non Woven Fabric Industry Revenue (Million) Forecast, by Application 2020 & 2033
- Table 110: South Africa Non Woven Fabric Industry Volume (K Tons) Forecast, by Application 2020 & 2033
- Table 111: Rest of Middle East and Africa Non Woven Fabric Industry Revenue (Million) Forecast, by Application 2020 & 2033
- Table 112: Rest of Middle East and Africa Non Woven Fabric Industry Volume (K Tons) Forecast, by Application 2020 & 2033
Frequently Asked Questions
1. What is the projected Compound Annual Growth Rate (CAGR) of the Non Woven Fabric Industry?
The projected CAGR is approximately 6.11%.
2. Which companies are prominent players in the Non Woven Fabric Industry?
Key companies in the market include Autotech Nonwovens Pvt Ltd, KCWW (Kimberly-Clark Corporation), Toray Industries Inc, Freudenberg Performance Materials, Cygnus Group, TWE Group*List Not Exhaustive, PFNonwovens Czech SRO, Eximius Incorporation, Glatfelter, DuPont, Ahlstrom-Munksj, Fitesa, Johns Manville, Paramount Tech Fab Industries, Berry Global Inc.
3. What are the main segments of the Non Woven Fabric Industry?
The market segments include Technology, Material, End-user Industry.
4. Can you provide details about the market size?
The market size is estimated to be USD 57.42 Million as of 2022.
5. What are some drivers contributing to market growth?
Increasing Application in the Healthcare Industry; Growing Demand for Electric Vehicles; Other Drivers.
6. What are the notable trends driving market growth?
Increasing Demand from the Healthcare Industry.
7. Are there any restraints impacting market growth?
Low Durability and Strength of Fabric; Other Restraints.
8. Can you provide examples of recent developments in the market?
August 2022: Willacoochee Industrial Fabrics, Inc. (WINFAB), one of the leading manufacturers of geosynthetic and erosion control products in the United States, announced its investment into a new state-of-the-art nonwoven geotextile manufacturing production line in Nashville, GA. The production line was anticipated to begin operation by the second quarter of 2023.
9. What pricing options are available for accessing the report?
Pricing options include single-user, multi-user, and enterprise licenses priced at USD 4750, USD 5250, and USD 8750 respectively.
10. Is the market size provided in terms of value or volume?
The market size is provided in terms of value, measured in Million and volume, measured in K Tons.
11. Are there any specific market keywords associated with the report?
Yes, the market keyword associated with the report is "Non Woven Fabric Industry," which aids in identifying and referencing the specific market segment covered.
12. How do I determine which pricing option suits my needs best?
The pricing options vary based on user requirements and access needs. Individual users may opt for single-user licenses, while businesses requiring broader access may choose multi-user or enterprise licenses for cost-effective access to the report.
13. Are there any additional resources or data provided in the Non Woven Fabric Industry report?
While the report offers comprehensive insights, it's advisable to review the specific contents or supplementary materials provided to ascertain if additional resources or data are available.
14. How can I stay updated on further developments or reports in the Non Woven Fabric Industry?
To stay informed about further developments, trends, and reports in the Non Woven Fabric Industry, consider subscribing to industry newsletters, following relevant companies and organizations, or regularly checking reputable industry news sources and publications.
Methodology
Step 1 - Identification of Relevant Samples Size from Population Database


Step 2 - Approaches for Defining Global Market Size (Value, Volume* & Price*)

Note*: In applicable scenarios
Step 3 - Data Sources
Primary Research
- Web Analytics
- Survey Reports
- Research Institute
- Latest Research Reports
- Opinion Leaders
Secondary Research
- Annual Reports
- White Paper
- Latest Press Release
- Industry Association
- Paid Database
- Investor Presentations

Step 4 - Data Triangulation
Involves using different sources of information in order to increase the validity of a study
These sources are likely to be stakeholders in a program - participants, other researchers, program staff, other community members, and so on.
Then we put all data in single framework & apply various statistical tools to find out the dynamic on the market.
During the analysis stage, feedback from the stakeholder groups would be compared to determine areas of agreement as well as areas of divergence