

Key Insights
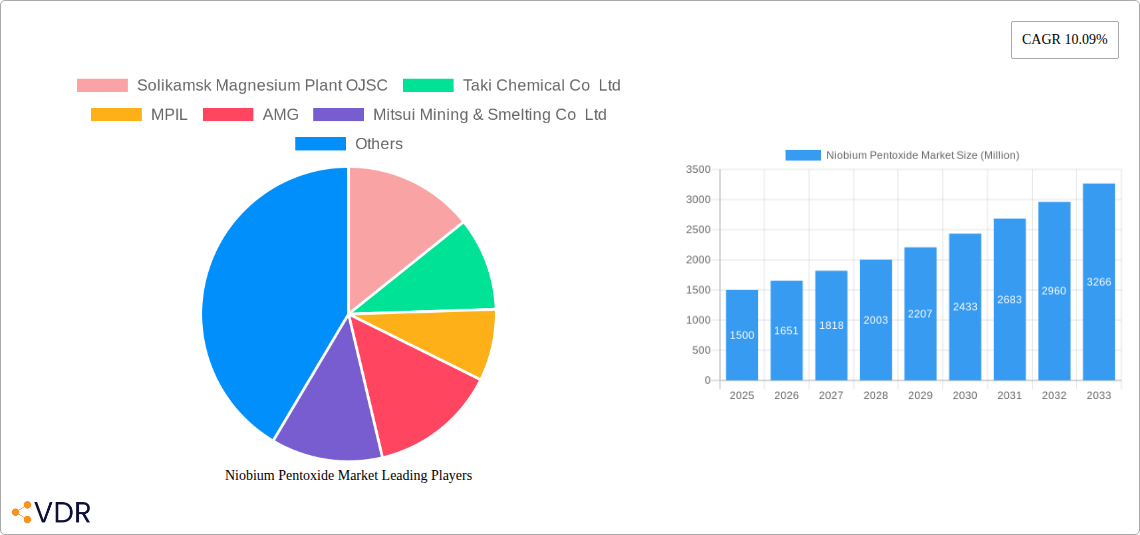
The Niobium Pentoxide market, valued at approximately $XX million in 2025, is projected to experience robust growth, exhibiting a compound annual growth rate (CAGR) of 10.09% from 2025 to 2033. This expansion is driven primarily by the increasing demand for niobium pentoxide in high-performance applications such as superalloys used in aerospace and energy sectors, and the burgeoning supercapacitor market seeking high energy density storage solutions. Furthermore, the growing adoption of niobium pentoxide in optical glass manufacturing for advanced optical systems fuels market growth. Technological advancements leading to improved purity levels (3N, 4N, and higher) are also contributing factors. While the market faces constraints from price volatility associated with niobium raw material and potential supply chain disruptions, the overall positive outlook stems from the strategic importance of niobium pentoxide in diverse, high-growth industries. Regional analysis reveals strong growth in the Asia-Pacific region, particularly in China and India, driven by their expanding manufacturing sectors and government initiatives promoting technological advancement. North America and Europe also contribute significantly, with a steady demand from established industries.
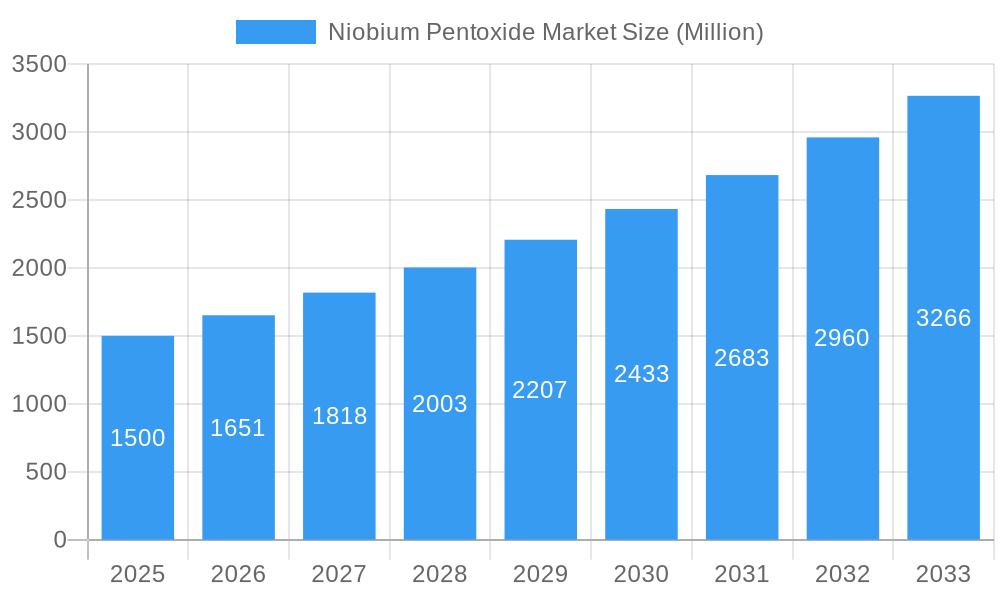
Niobium Pentoxide Market Market Size (In Billion)
The segmentation of the Niobium Pentoxide market by grade (industrial grade encompassing 3N, 4N, and higher purity levels) and application (Niobium metal, optical glass, supercapacitors, superalloys, ceramics, and other applications) provides valuable insights into market dynamics. The industrial grade segment is anticipated to dominate due to its widespread applicability across various sectors. Within applications, superalloys and supercapacitors are predicted to witness the highest growth rates due to their crucial role in advanced technologies. Key players like Solikamsk Magnesium Plant OJSC, Taki Chemical Co Ltd, MPIL, AMG, Mitsui Mining & Smelting Co Ltd, JX Nippon Mining & Metals Corporation, F&X Electro-Materials Limited, King-Tan Tantalum Industry Ltd, XIMEI Resources Holding Limited, and CBMM are actively shaping market competition through strategic partnerships, technological innovations, and capacity expansion initiatives. The competitive landscape is characterized by both established players and emerging companies vying for market share, stimulating innovation and ensuring a healthy market dynamic.
Niobium Pentoxide Market Company Market Share
Niobium Pentoxide Market: A Comprehensive Report (2019-2033)
This in-depth report provides a comprehensive analysis of the Niobium Pentoxide market, encompassing market dynamics, growth trends, regional segmentation, product landscape, key players, and future outlook. The report covers the historical period (2019-2024), base year (2025), and forecast period (2025-2033), offering invaluable insights for industry professionals, investors, and strategic decision-makers. The parent market is the specialty chemicals market and the child market is the advanced materials market. Market values are presented in million units.
Niobium Pentoxide Market Dynamics & Structure
The Niobium Pentoxide market is characterized by moderate concentration, with key players like CBMM holding significant market share (xx%). Technological innovation, particularly in applications like supercapacitors and superalloys, is a major growth driver. Stringent regulatory frameworks regarding environmental impact and material purity influence production processes. Competitive substitutes, such as tantalum pentoxide, exist, but niobium pentoxide's unique properties often provide a competitive advantage. End-user demographics are expanding, driven by the growing demand for electronics, renewable energy technologies, and advanced materials in various industries. M&A activity remains moderate; however, strategic partnerships are becoming increasingly common to expand production capacity and market reach.
- Market Concentration: Moderately concentrated, with CBMM holding a significant share (xx%).
- Technological Innovation: Focus on enhancing purity levels (3N, 4N) and exploring new applications in energy storage and high-performance materials.
- Regulatory Framework: Stringent environmental regulations and safety standards impact production and disposal.
- Competitive Substitutes: Tantalum pentoxide and other high-performance materials pose competition.
- End-User Demographics: Growth driven by increasing demand in electronics, energy, and aerospace sectors.
- M&A Trends: Moderate M&A activity; strategic partnerships are more prevalent.
Niobium Pentoxide Market Growth Trends & Insights
The Niobium Pentoxide market exhibits a steady growth trajectory, driven by increasing demand across diverse applications. The market size is projected to reach xx million units by 2033, exhibiting a CAGR of xx% during the forecast period. Technological advancements, such as the development of high-purity niobium pentoxide, are fueling adoption rates in high-tech industries. Consumer behavior shifts towards sustainable and high-performance products further boost market growth. The market penetration rate in key applications like supercapacitors is expected to increase significantly, reaching xx% by 2033. The rising adoption of electric vehicles and renewable energy technologies creates substantial growth opportunities. This growth is further amplified by government initiatives promoting clean energy technologies and advanced materials.
Dominant Regions, Countries, or Segments in Niobium Pentoxide Market
The region currently dominates the Niobium Pentoxide market, owing to its well-established industrial base and high demand from key sectors like aerospace and electronics. Within this region, [Specific country] holds the largest market share due to its abundant resources and strong manufacturing capabilities. The industrial-grade segment (particularly 4N purity) holds a larger market share compared to other grades, primarily driven by its widespread use in various applications. The superalloys application segment is projected to demonstrate the highest growth rate due to its increasing importance in aerospace and energy sectors.
- Key Drivers: Strong industrial base, abundant resources, favorable government policies, growing demand from key sectors.
- Dominance Factors: Established manufacturing infrastructure, significant production capacity, and proactive government support.
- Growth Potential: Significant opportunities exist in emerging economies and developing markets, particularly in Asia and South America.
Niobium Pentoxide Market Product Landscape
Niobium pentoxide products are categorized by purity levels (industrial grade, 3N, 4N), each tailored to specific applications. Innovations focus on enhancing purity and particle size control for improved performance in high-tech applications. Unique selling propositions include superior dielectric properties, high refractive index, and excellent thermal stability. Ongoing research and development efforts aim to create specialized niobium pentoxide formulations for niche applications.
Key Drivers, Barriers & Challenges in Niobium Pentoxide Market
Key Drivers:
- Growing demand from electronics and energy sectors.
- Technological advancements leading to enhanced material properties.
- Government initiatives promoting clean energy technologies.
Challenges & Restraints:
- Price volatility of raw materials.
- Supply chain disruptions impacting production.
- Competition from substitute materials (e.g., tantalum pentoxide).
Emerging Opportunities in Niobium Pentoxide Market
- Untapped markets in emerging economies, particularly in Asia and Africa.
- Expanding applications in renewable energy technologies (e.g., solar cells, fuel cells).
- Growing demand for high-purity niobium pentoxide in advanced electronic components.
Growth Accelerators in the Niobium Pentoxide Market Industry
Technological breakthroughs in material synthesis and processing are accelerating market growth. Strategic partnerships between raw material suppliers and technology companies are enhancing product development and market reach. Expansion into new applications, particularly in the energy storage and aerospace sectors, is driving demand and fueling market expansion.
Key Players Shaping the Niobium Pentoxide Market Market
- Solikamsk Magnesium Plant OJSC
- Taki Chemical Co Ltd
- MPIL
- AMG
- Mitsui Mining & Smelting Co Ltd
- JX Nippon Mining & Metals Corporation
- F&X Electro-Materials Limited
- King-Tan Tantalum Industry Ltd
- XIMEI Resources Holding Limited
- CBMM
Notable Milestones in Niobium Pentoxide Market Sector
- December 2022: CBMM announced an USD 80 million investment to expand niobium oxide capacity to 3,000 tons by 2024, aiming for 40,000 tons by 2030.
- March 2022: CBMM partnered with Horwin Brasil, investing ~USD 13.8 million to utilize niobium in electric motorcycle batteries.
In-Depth Niobium Pentoxide Market Market Outlook
The Niobium Pentoxide market is poised for robust growth in the coming years, driven by technological advancements and expanding applications in high-growth sectors. Strategic investments in capacity expansion and R&D will further enhance market potential. The focus on sustainable and high-performance materials creates significant opportunities for market players to capitalize on emerging trends and capture market share.
Niobium Pentoxide Market Segmentation
-
1. Grade
- 1.1. Industrial Grade (purity: 99.0% to 99.8%)
- 1.2. 3N
- 1.3. 4N
-
2. Application
- 2.1. Niobium Metal
- 2.2. Optical Glass
- 2.3. Supercapacitors
- 2.4. Superalloys
- 2.5. Ceramics
- 2.6. Other Applications
Niobium Pentoxide Market Segmentation By Geography
-
1. Asia Pacific
- 1.1. China
- 1.2. India
- 1.3. Japan
- 1.4. South Korea
- 1.5. Rest of Asia Pacific
-
2. North America
- 2.1. United States
- 2.2. Canada
- 2.3. Mexico
-
3. Europe
- 3.1. Germany
- 3.2. United Kingdom
- 3.3. France
- 3.4. Italy
- 3.5. Rest of Europe
-
4. South America
- 4.1. Brazil
- 4.2. Argentina
- 4.3. Rest of South America
-
5. Middle East and Africa
- 5.1. Saudi Arabia
- 5.2. South Africa
- 5.3. Rest of Middle East and Africa
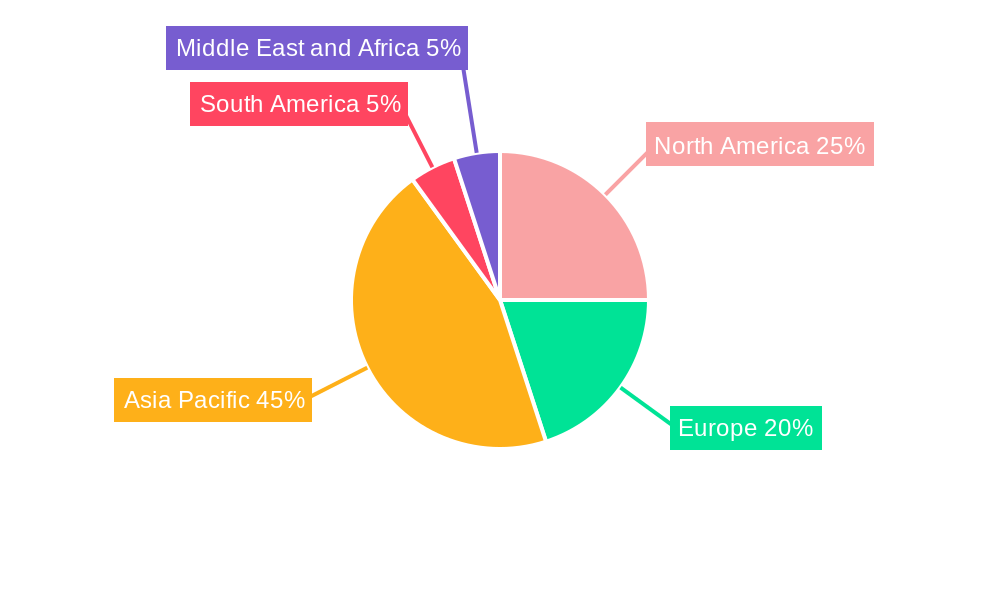
Niobium Pentoxide Market Regional Market Share
Geographic Coverage of Niobium Pentoxide Market
Niobium Pentoxide Market REPORT HIGHLIGHTS
| Aspects | Details |
|---|---|
| Study Period | 2020-2034 |
| Base Year | 2025 |
| Estimated Year | 2026 |
| Forecast Period | 2026-2034 |
| Historical Period | 2020-2025 |
| Growth Rate | CAGR of 5.6% from 2020-2034 |
| Segmentation |
|
Table of Contents
- 1. Introduction
- 1.1. Research Scope
- 1.2. Market Segmentation
- 1.3. Research Objective
- 1.4. Definitions and Assumptions
- 2. Executive Summary
- 2.1. Market Snapshot
- 3. Market Dynamics
- 3.1. Market Drivers
- 3.2. Market Restrains
- 3.3. Market Trends
- 3.4. Market Opportunities
- 4. Market Factor Analysis
- 4.1. Porters Five Forces
- 4.1.1. Bargaining Power of Suppliers
- 4.1.2. Bargaining Power of Buyers
- 4.1.3. Threat of New Entrants
- 4.1.4. Threat of Substitutes
- 4.1.5. Competitive Rivalry
- 4.2. PESTEL analysis
- 4.3. BCG Analysis
- 4.3.1. Stars (High Growth, High Market Share)
- 4.3.2. Cash Cows (Low Growth, High Market Share)
- 4.3.3. Question Mark (High Growth, Low Market Share)
- 4.3.4. Dogs (Low Growth, Low Market Share)
- 4.4. Ansoff Matrix Analysis
- 4.5. Supply Chain Analysis
- 4.6. Regulatory Landscape
- 4.7. Current Market Potential and Opportunity Assessment (TAM–SAM–SOM Framework)
- 4.8. VDR Analyst Note
- 4.1. Porters Five Forces
- 5. Market Analysis, Insights and Forecast 2021-2033
- 5.1. Market Analysis, Insights and Forecast - by Grade
- 5.1.1. Industrial Grade (purity: 99.0% to 99.8%)
- 5.1.2. 3N
- 5.1.3. 4N
- 5.2. Market Analysis, Insights and Forecast - by Application
- 5.2.1. Niobium Metal
- 5.2.2. Optical Glass
- 5.2.3. Supercapacitors
- 5.2.4. Superalloys
- 5.2.5. Ceramics
- 5.2.6. Other Applications
- 5.3. Market Analysis, Insights and Forecast - by Region
- 5.3.1. Asia Pacific
- 5.3.2. North America
- 5.3.3. Europe
- 5.3.4. South America
- 5.3.5. Middle East and Africa
- 5.1. Market Analysis, Insights and Forecast - by Grade
- 6. Global Niobium Pentoxide Market Analysis, Insights and Forecast, 2021-2033
- 6.1. Market Analysis, Insights and Forecast - by Grade
- 6.1.1. Industrial Grade (purity: 99.0% to 99.8%)
- 6.1.2. 3N
- 6.1.3. 4N
- 6.2. Market Analysis, Insights and Forecast - by Application
- 6.2.1. Niobium Metal
- 6.2.2. Optical Glass
- 6.2.3. Supercapacitors
- 6.2.4. Superalloys
- 6.2.5. Ceramics
- 6.2.6. Other Applications
- 6.1. Market Analysis, Insights and Forecast - by Grade
- 7. Asia Pacific Niobium Pentoxide Market Analysis, Insights and Forecast, 2021-2033
- 7.1. Market Analysis, Insights and Forecast - by Grade
- 7.1.1. Industrial Grade (purity: 99.0% to 99.8%)
- 7.1.2. 3N
- 7.1.3. 4N
- 7.2. Market Analysis, Insights and Forecast - by Application
- 7.2.1. Niobium Metal
- 7.2.2. Optical Glass
- 7.2.3. Supercapacitors
- 7.2.4. Superalloys
- 7.2.5. Ceramics
- 7.2.6. Other Applications
- 7.1. Market Analysis, Insights and Forecast - by Grade
- 8. North America Niobium Pentoxide Market Analysis, Insights and Forecast, 2021-2033
- 8.1. Market Analysis, Insights and Forecast - by Grade
- 8.1.1. Industrial Grade (purity: 99.0% to 99.8%)
- 8.1.2. 3N
- 8.1.3. 4N
- 8.2. Market Analysis, Insights and Forecast - by Application
- 8.2.1. Niobium Metal
- 8.2.2. Optical Glass
- 8.2.3. Supercapacitors
- 8.2.4. Superalloys
- 8.2.5. Ceramics
- 8.2.6. Other Applications
- 8.1. Market Analysis, Insights and Forecast - by Grade
- 9. Europe Niobium Pentoxide Market Analysis, Insights and Forecast, 2021-2033
- 9.1. Market Analysis, Insights and Forecast - by Grade
- 9.1.1. Industrial Grade (purity: 99.0% to 99.8%)
- 9.1.2. 3N
- 9.1.3. 4N
- 9.2. Market Analysis, Insights and Forecast - by Application
- 9.2.1. Niobium Metal
- 9.2.2. Optical Glass
- 9.2.3. Supercapacitors
- 9.2.4. Superalloys
- 9.2.5. Ceramics
- 9.2.6. Other Applications
- 9.1. Market Analysis, Insights and Forecast - by Grade
- 10. South America Niobium Pentoxide Market Analysis, Insights and Forecast, 2021-2033
- 10.1. Market Analysis, Insights and Forecast - by Grade
- 10.1.1. Industrial Grade (purity: 99.0% to 99.8%)
- 10.1.2. 3N
- 10.1.3. 4N
- 10.2. Market Analysis, Insights and Forecast - by Application
- 10.2.1. Niobium Metal
- 10.2.2. Optical Glass
- 10.2.3. Supercapacitors
- 10.2.4. Superalloys
- 10.2.5. Ceramics
- 10.2.6. Other Applications
- 10.1. Market Analysis, Insights and Forecast - by Grade
- 11. Middle East and Africa Niobium Pentoxide Market Analysis, Insights and Forecast, 2021-2033
- 11.1. Market Analysis, Insights and Forecast - by Grade
- 11.1.1. Industrial Grade (purity: 99.0% to 99.8%)
- 11.1.2. 3N
- 11.1.3. 4N
- 11.2. Market Analysis, Insights and Forecast - by Application
- 11.2.1. Niobium Metal
- 11.2.2. Optical Glass
- 11.2.3. Supercapacitors
- 11.2.4. Superalloys
- 11.2.5. Ceramics
- 11.2.6. Other Applications
- 11.1. Market Analysis, Insights and Forecast - by Grade
- 12. Competitive Analysis
- 12.1. Company Profiles
- 12.1.1 Solikamsk Magnesium Plant OJSC
- 12.1.1.1. Company Overview
- 12.1.1.2. Products
- 12.1.1.3. Company Financials
- 12.1.1.4. SWOT Analysis
- 12.1.2 Taki Chemical Co Ltd
- 12.1.2.1. Company Overview
- 12.1.2.2. Products
- 12.1.2.3. Company Financials
- 12.1.2.4. SWOT Analysis
- 12.1.3 MPIL
- 12.1.3.1. Company Overview
- 12.1.3.2. Products
- 12.1.3.3. Company Financials
- 12.1.3.4. SWOT Analysis
- 12.1.4 AMG
- 12.1.4.1. Company Overview
- 12.1.4.2. Products
- 12.1.4.3. Company Financials
- 12.1.4.4. SWOT Analysis
- 12.1.5 Mitsui Mining & Smelting Co Ltd
- 12.1.5.1. Company Overview
- 12.1.5.2. Products
- 12.1.5.3. Company Financials
- 12.1.5.4. SWOT Analysis
- 12.1.6 JX Nippon Mining & Metals Corporation
- 12.1.6.1. Company Overview
- 12.1.6.2. Products
- 12.1.6.3. Company Financials
- 12.1.6.4. SWOT Analysis
- 12.1.7 F&X Electro-Materials Limited
- 12.1.7.1. Company Overview
- 12.1.7.2. Products
- 12.1.7.3. Company Financials
- 12.1.7.4. SWOT Analysis
- 12.1.8 King-Tan Tantalum Industry Ltd
- 12.1.8.1. Company Overview
- 12.1.8.2. Products
- 12.1.8.3. Company Financials
- 12.1.8.4. SWOT Analysis
- 12.1.9 XIMEI Resources Holding Limited*List Not Exhaustive
- 12.1.9.1. Company Overview
- 12.1.9.2. Products
- 12.1.9.3. Company Financials
- 12.1.9.4. SWOT Analysis
- 12.1.10 CBMM
- 12.1.10.1. Company Overview
- 12.1.10.2. Products
- 12.1.10.3. Company Financials
- 12.1.10.4. SWOT Analysis
- 12.1.1 Solikamsk Magnesium Plant OJSC
- 12.2. Market Entropy
- 12.2.1 Company's Key Areas Served
- 12.2.2 Recent Developments
- 12.3. Company Market Share Analysis 2025
- 12.3.1 Top 5 Companies Market Share Analysis
- 12.3.2 Top 3 Companies Market Share Analysis
- 12.4. List of Potential Customers
- 13. Research Methodology
List of Figures
- Figure 1: Global Niobium Pentoxide Market Revenue Breakdown (million, %) by Region 2025 & 2033
- Figure 2: Asia Pacific Niobium Pentoxide Market Revenue (million), by Grade 2025 & 2033
- Figure 3: Asia Pacific Niobium Pentoxide Market Revenue Share (%), by Grade 2025 & 2033
- Figure 4: Asia Pacific Niobium Pentoxide Market Revenue (million), by Application 2025 & 2033
- Figure 5: Asia Pacific Niobium Pentoxide Market Revenue Share (%), by Application 2025 & 2033
- Figure 6: Asia Pacific Niobium Pentoxide Market Revenue (million), by Country 2025 & 2033
- Figure 7: Asia Pacific Niobium Pentoxide Market Revenue Share (%), by Country 2025 & 2033
- Figure 8: North America Niobium Pentoxide Market Revenue (million), by Grade 2025 & 2033
- Figure 9: North America Niobium Pentoxide Market Revenue Share (%), by Grade 2025 & 2033
- Figure 10: North America Niobium Pentoxide Market Revenue (million), by Application 2025 & 2033
- Figure 11: North America Niobium Pentoxide Market Revenue Share (%), by Application 2025 & 2033
- Figure 12: North America Niobium Pentoxide Market Revenue (million), by Country 2025 & 2033
- Figure 13: North America Niobium Pentoxide Market Revenue Share (%), by Country 2025 & 2033
- Figure 14: Europe Niobium Pentoxide Market Revenue (million), by Grade 2025 & 2033
- Figure 15: Europe Niobium Pentoxide Market Revenue Share (%), by Grade 2025 & 2033
- Figure 16: Europe Niobium Pentoxide Market Revenue (million), by Application 2025 & 2033
- Figure 17: Europe Niobium Pentoxide Market Revenue Share (%), by Application 2025 & 2033
- Figure 18: Europe Niobium Pentoxide Market Revenue (million), by Country 2025 & 2033
- Figure 19: Europe Niobium Pentoxide Market Revenue Share (%), by Country 2025 & 2033
- Figure 20: South America Niobium Pentoxide Market Revenue (million), by Grade 2025 & 2033
- Figure 21: South America Niobium Pentoxide Market Revenue Share (%), by Grade 2025 & 2033
- Figure 22: South America Niobium Pentoxide Market Revenue (million), by Application 2025 & 2033
- Figure 23: South America Niobium Pentoxide Market Revenue Share (%), by Application 2025 & 2033
- Figure 24: South America Niobium Pentoxide Market Revenue (million), by Country 2025 & 2033
- Figure 25: South America Niobium Pentoxide Market Revenue Share (%), by Country 2025 & 2033
- Figure 26: Middle East and Africa Niobium Pentoxide Market Revenue (million), by Grade 2025 & 2033
- Figure 27: Middle East and Africa Niobium Pentoxide Market Revenue Share (%), by Grade 2025 & 2033
- Figure 28: Middle East and Africa Niobium Pentoxide Market Revenue (million), by Application 2025 & 2033
- Figure 29: Middle East and Africa Niobium Pentoxide Market Revenue Share (%), by Application 2025 & 2033
- Figure 30: Middle East and Africa Niobium Pentoxide Market Revenue (million), by Country 2025 & 2033
- Figure 31: Middle East and Africa Niobium Pentoxide Market Revenue Share (%), by Country 2025 & 2033
List of Tables
- Table 1: Global Niobium Pentoxide Market Revenue million Forecast, by Grade 2020 & 2033
- Table 2: Global Niobium Pentoxide Market Revenue million Forecast, by Application 2020 & 2033
- Table 3: Global Niobium Pentoxide Market Revenue million Forecast, by Region 2020 & 2033
- Table 4: Global Niobium Pentoxide Market Revenue million Forecast, by Grade 2020 & 2033
- Table 5: Global Niobium Pentoxide Market Revenue million Forecast, by Application 2020 & 2033
- Table 6: Global Niobium Pentoxide Market Revenue million Forecast, by Country 2020 & 2033
- Table 7: China Niobium Pentoxide Market Revenue (million) Forecast, by Application 2020 & 2033
- Table 8: India Niobium Pentoxide Market Revenue (million) Forecast, by Application 2020 & 2033
- Table 9: Japan Niobium Pentoxide Market Revenue (million) Forecast, by Application 2020 & 2033
- Table 10: South Korea Niobium Pentoxide Market Revenue (million) Forecast, by Application 2020 & 2033
- Table 11: Rest of Asia Pacific Niobium Pentoxide Market Revenue (million) Forecast, by Application 2020 & 2033
- Table 12: Global Niobium Pentoxide Market Revenue million Forecast, by Grade 2020 & 2033
- Table 13: Global Niobium Pentoxide Market Revenue million Forecast, by Application 2020 & 2033
- Table 14: Global Niobium Pentoxide Market Revenue million Forecast, by Country 2020 & 2033
- Table 15: United States Niobium Pentoxide Market Revenue (million) Forecast, by Application 2020 & 2033
- Table 16: Canada Niobium Pentoxide Market Revenue (million) Forecast, by Application 2020 & 2033
- Table 17: Mexico Niobium Pentoxide Market Revenue (million) Forecast, by Application 2020 & 2033
- Table 18: Global Niobium Pentoxide Market Revenue million Forecast, by Grade 2020 & 2033
- Table 19: Global Niobium Pentoxide Market Revenue million Forecast, by Application 2020 & 2033
- Table 20: Global Niobium Pentoxide Market Revenue million Forecast, by Country 2020 & 2033
- Table 21: Germany Niobium Pentoxide Market Revenue (million) Forecast, by Application 2020 & 2033
- Table 22: United Kingdom Niobium Pentoxide Market Revenue (million) Forecast, by Application 2020 & 2033
- Table 23: France Niobium Pentoxide Market Revenue (million) Forecast, by Application 2020 & 2033
- Table 24: Italy Niobium Pentoxide Market Revenue (million) Forecast, by Application 2020 & 2033
- Table 25: Rest of Europe Niobium Pentoxide Market Revenue (million) Forecast, by Application 2020 & 2033
- Table 26: Global Niobium Pentoxide Market Revenue million Forecast, by Grade 2020 & 2033
- Table 27: Global Niobium Pentoxide Market Revenue million Forecast, by Application 2020 & 2033
- Table 28: Global Niobium Pentoxide Market Revenue million Forecast, by Country 2020 & 2033
- Table 29: Brazil Niobium Pentoxide Market Revenue (million) Forecast, by Application 2020 & 2033
- Table 30: Argentina Niobium Pentoxide Market Revenue (million) Forecast, by Application 2020 & 2033
- Table 31: Rest of South America Niobium Pentoxide Market Revenue (million) Forecast, by Application 2020 & 2033
- Table 32: Global Niobium Pentoxide Market Revenue million Forecast, by Grade 2020 & 2033
- Table 33: Global Niobium Pentoxide Market Revenue million Forecast, by Application 2020 & 2033
- Table 34: Global Niobium Pentoxide Market Revenue million Forecast, by Country 2020 & 2033
- Table 35: Saudi Arabia Niobium Pentoxide Market Revenue (million) Forecast, by Application 2020 & 2033
- Table 36: South Africa Niobium Pentoxide Market Revenue (million) Forecast, by Application 2020 & 2033
- Table 37: Rest of Middle East and Africa Niobium Pentoxide Market Revenue (million) Forecast, by Application 2020 & 2033
Frequently Asked Questions
1. What is the projected Compound Annual Growth Rate (CAGR) of the Niobium Pentoxide Market?
The projected CAGR is approximately 5.6%.
2. Which companies are prominent players in the Niobium Pentoxide Market?
Key companies in the market include Solikamsk Magnesium Plant OJSC, Taki Chemical Co Ltd, MPIL, AMG, Mitsui Mining & Smelting Co Ltd, JX Nippon Mining & Metals Corporation, F&X Electro-Materials Limited, King-Tan Tantalum Industry Ltd, XIMEI Resources Holding Limited*List Not Exhaustive, CBMM.
3. What are the main segments of the Niobium Pentoxide Market?
The market segments include Grade, Application.
4. Can you provide details about the market size?
The market size is estimated to be USD 270.2 million as of 2022.
5. What are some drivers contributing to market growth?
Growing Demand from the Electric Vehicles Segment; Growing Demand for High-Quality Steel from the Manufacturing Sector.
6. What are the notable trends driving market growth?
Increasing Usage in the Production of Niobium Metal.
7. Are there any restraints impacting market growth?
Concerns About Health Issues on Acute Exposure.
8. Can you provide examples of recent developments in the market?
December 2022: CBMM announced a USD 80 million investment to expand niobium oxide capacity from 500 tons to 3,000 tons by 2024. Through a collaboration with Echion Technologies, CBMM plans to establish a niobium oxide facility at its Araxá plant in Minas Gerais, Brazil, aligning with its goal of achieving a niobium oxide capacity of 40,000 t by 2030.
9. What pricing options are available for accessing the report?
Pricing options include single-user, multi-user, and enterprise licenses priced at USD 4750, USD 5250, and USD 8750 respectively.
10. Is the market size provided in terms of value or volume?
The market size is provided in terms of value, measured in million.
11. Are there any specific market keywords associated with the report?
Yes, the market keyword associated with the report is "Niobium Pentoxide Market," which aids in identifying and referencing the specific market segment covered.
12. How do I determine which pricing option suits my needs best?
The pricing options vary based on user requirements and access needs. Individual users may opt for single-user licenses, while businesses requiring broader access may choose multi-user or enterprise licenses for cost-effective access to the report.
13. Are there any additional resources or data provided in the Niobium Pentoxide Market report?
While the report offers comprehensive insights, it's advisable to review the specific contents or supplementary materials provided to ascertain if additional resources or data are available.
14. How can I stay updated on further developments or reports in the Niobium Pentoxide Market?
To stay informed about further developments, trends, and reports in the Niobium Pentoxide Market, consider subscribing to industry newsletters, following relevant companies and organizations, or regularly checking reputable industry news sources and publications.
Methodology
Step 1 - Identification of Relevant Samples Size from Population Database


Step 2 - Approaches for Defining Global Market Size (Value, Volume* & Price*)

Note*: In applicable scenarios
Step 3 - Data Sources
Primary Research
- Web Analytics
- Survey Reports
- Research Institute
- Latest Research Reports
- Opinion Leaders
Secondary Research
- Annual Reports
- White Paper
- Latest Press Release
- Industry Association
- Paid Database
- Investor Presentations

Step 4 - Data Triangulation
Involves using different sources of information in order to increase the validity of a study
These sources are likely to be stakeholders in a program - participants, other researchers, program staff, other community members, and so on.
Then we put all data in single framework & apply various statistical tools to find out the dynamic on the market.
During the analysis stage, feedback from the stakeholder groups would be compared to determine areas of agreement as well as areas of divergence