
Key Insights
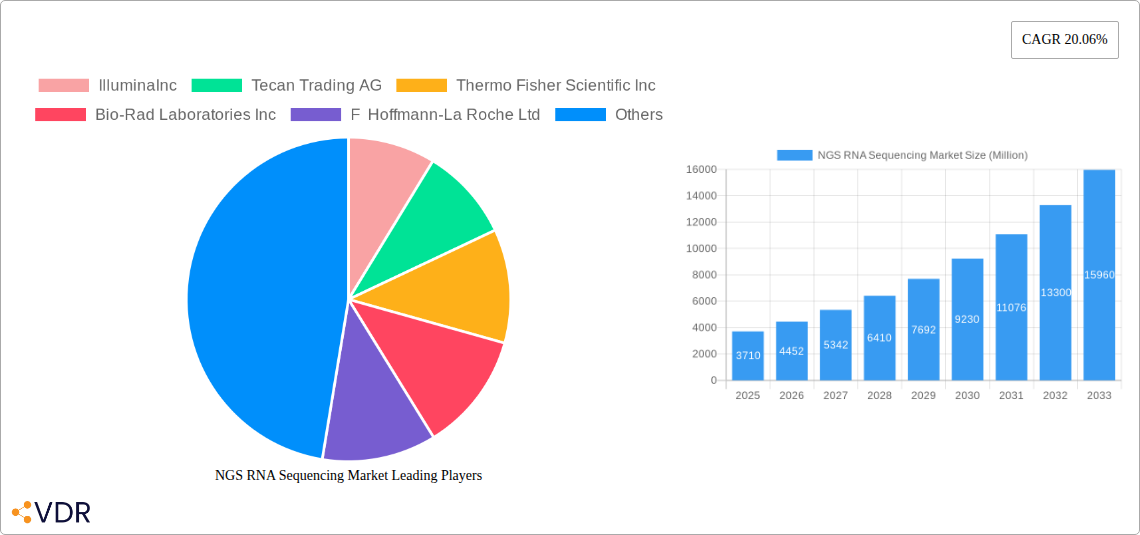
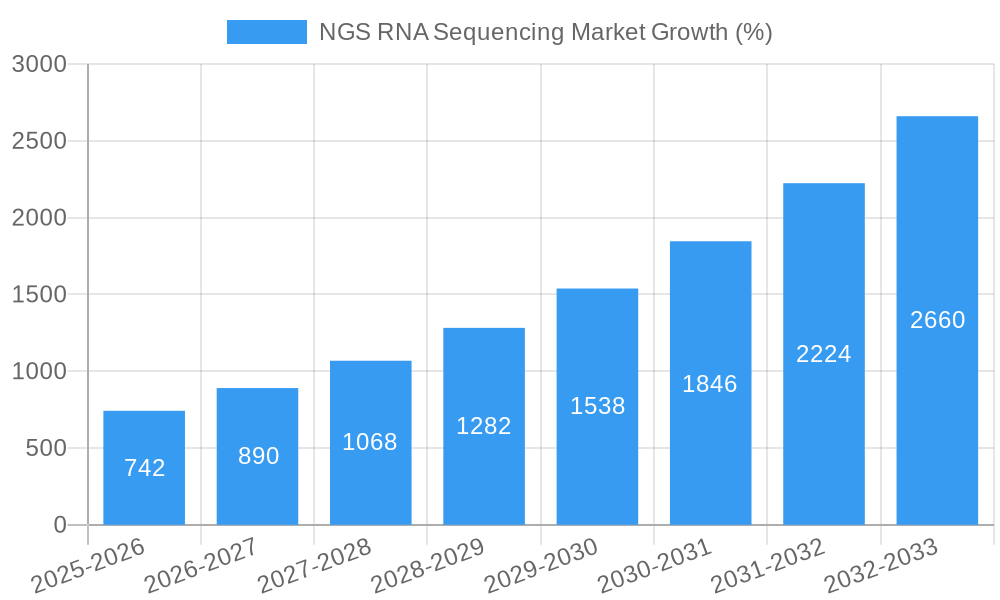
The Next-Generation Sequencing (NGS) RNA sequencing market is experiencing robust growth, driven by the increasing adoption of RNA sequencing in various applications, particularly in drug discovery, diagnostics, and precision medicine. The market, valued at $3.71 billion in 2025, is projected to witness a Compound Annual Growth Rate (CAGR) of 20.06% from 2025 to 2033. This significant growth is fueled by several key factors. Advancements in NGS technologies, such as nanopore sequencing and single-molecule real-time sequencing, are enabling faster, more accurate, and cost-effective RNA sequencing, thereby expanding the accessibility and applications of this technology. The rising prevalence of chronic diseases, the growing demand for personalized medicine, and increased investments in research and development are further bolstering market expansion. Major players like Illumina, Thermo Fisher Scientific, and Oxford Nanopore Technologies are actively contributing to this growth through continuous innovation and strategic partnerships. The segmentation reveals a significant contribution from sequencing platforms and consumables, while the drug discovery and diagnostics application segments are major revenue drivers. Geographic analysis indicates strong market presence in North America and Europe, driven by well-established healthcare infrastructure and research activities. However, rapidly growing economies in Asia Pacific are expected to contribute significantly to future market growth.
The strong growth trajectory of the NGS RNA sequencing market is expected to continue throughout the forecast period. Technological advancements, particularly in data analysis and bioinformatics, will be crucial in unlocking the full potential of RNA sequencing. The increasing integration of RNA sequencing into clinical workflows will further enhance market penetration. While challenges remain, such as high initial investment costs for some platforms and the need for specialized expertise in data interpretation, the overall market outlook remains highly positive. The market is poised for expansion, with considerable opportunities for market entrants and established players alike. Competitive landscape analysis suggests a focus on strategic acquisitions, partnerships, and technological innovation to maintain a leading position within this rapidly evolving field. The ongoing development of more user-friendly platforms and streamlined data analysis pipelines will further accelerate market adoption, ensuring that NGS RNA sequencing remains a critical tool in biomedical research and clinical practice.
Next-Generation Sequencing (NGS) RNA Sequencing Market Report: 2019-2033
This comprehensive report provides an in-depth analysis of the NGS RNA Sequencing market, encompassing market dynamics, growth trends, regional dominance, product landscape, key players, and future outlook. The study period spans from 2019 to 2033, with 2025 serving as the base and estimated year. The report covers the historical period (2019-2024) and forecasts the market from 2025 to 2033. The market is segmented by Product & Services (Sequencing Platform & Consumables, Sequencing Services), Technology (Nanopore Sequencing, Sequencing by Synthesis, Ion Semiconductor Sequencing, Single Molecule Real Time Sequencing), Application (Drug Discovery, Diagnostics, Precision Medicine, Other Applications), and End-User (Biotechnology and Pharmaceutical Companies, Hospitals and Clinics, Other End-Users). The estimated market size in 2025 is XX Million.
NGS RNA Sequencing Market Market Dynamics & Structure
The NGS RNA Sequencing market is characterized by moderate concentration, with key players holding significant market share. Illumina, Thermo Fisher Scientific, and Roche dominate the market, collectively accounting for an estimated 60% market share in 2025. Technological innovation, particularly in long-read sequencing and single-cell RNA sequencing, is a key driver. Regulatory frameworks, such as those governing diagnostic applications, significantly influence market growth. The market faces competition from traditional RNA sequencing methods, but NGS offers superior throughput and sensitivity, fueling its adoption. M&A activity remains moderate, with a predicted xx deals in the forecast period (2025-2033), primarily focused on expanding technological capabilities and market reach.
- Market Concentration: Highly concentrated, with top 3 players holding ~60% market share in 2025.
- Technological Innovation: Continuous advancements in sequencing technologies drive market growth.
- Regulatory Landscape: Stringent regulations in diagnostic applications impact market penetration.
- Competitive Substitutes: Traditional RNA sequencing methods pose a competitive threat.
- End-User Demographics: Dominated by biotech and pharmaceutical companies, with increasing adoption by hospitals.
- M&A Activity: Moderate M&A activity, focusing on technology acquisition and market expansion.
NGS RNA Sequencing Market Growth Trends & Insights
The NGS RNA Sequencing market exhibits a robust Compound Annual Growth Rate (CAGR) of xx% during the forecast period (2025-2033), driven by increasing demand for personalized medicine, rising prevalence of chronic diseases, and growing investments in research and development. Market penetration is highest in North America and Europe, with developing economies showing significant growth potential. Technological disruptions, including the emergence of long-read sequencing, are revolutionizing transcriptomic analysis and expanding the applications of NGS RNA sequencing. Consumer behavior shifts towards faster, more accurate, and cost-effective solutions further fuel market growth.
Dominant Regions, Countries, or Segments in NGS RNA Sequencing Market
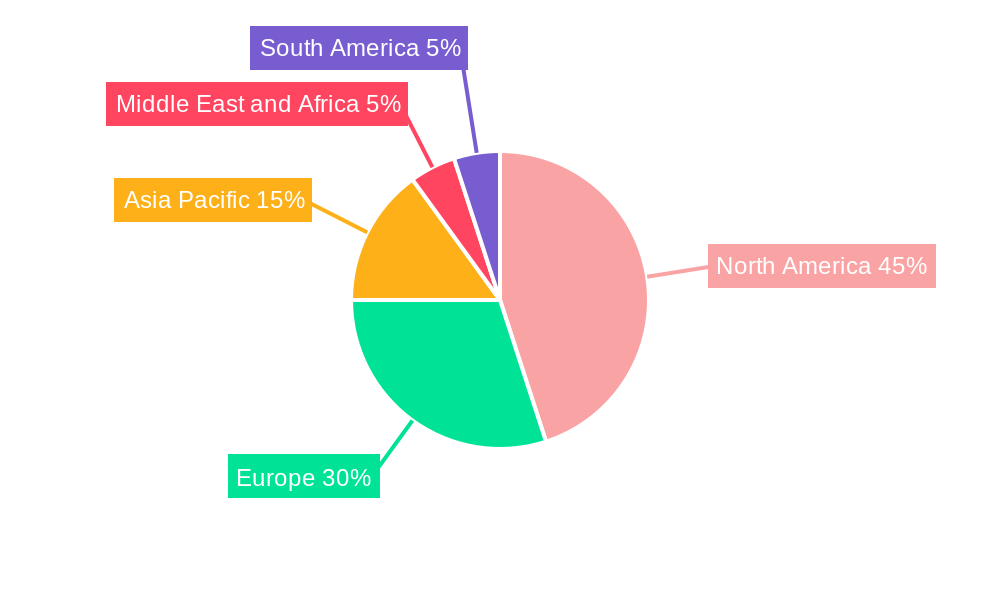
North America currently holds the largest market share, driven by robust funding for biomedical research, early adoption of new technologies, and the presence of major market players. Europe follows closely, exhibiting steady growth fuelled by increasing government initiatives and growing healthcare expenditure. Within the segments, Sequencing by Synthesis remains dominant due to its established technology and wide application. The Drug Discovery and Diagnostics applications represent the largest revenue segments, due to the substantial investment in research and development within the pharmaceutical industry and the growing need for accurate and rapid diagnostic testing.
- North America: Highest market share due to research funding and presence of key players.
- Europe: Strong growth fueled by governmental support and healthcare spending.
- Asia-Pacific: Emerging market with significant growth potential due to rising healthcare investment.
- Sequencing by Synthesis: Dominant technology due to maturity and widespread application.
- Drug Discovery & Diagnostics: Largest application segments due to substantial R&D investments.
NGS RNA Sequencing Market Product Landscape
The NGS RNA sequencing market features a diverse range of products, including sequencing platforms, consumables, and sequencing services. Key advancements involve improved throughput, reduced sequencing costs, and enhanced data analysis capabilities. Companies are focusing on developing user-friendly platforms, integrated workflows, and tailored solutions to cater to the diverse needs of researchers and clinicians. The market witnesses continuous innovation in library preparation kits and data analysis software, aiming for higher accuracy and reduced turnaround time.
Key Drivers, Barriers & Challenges in NGS RNA Sequencing Market
Key Drivers:
- Increasing demand for personalized medicine.
- Growing prevalence of chronic diseases.
- Rising investments in R&D within the pharmaceutical and biotech sectors.
- Technological advancements leading to faster, cheaper, and more accurate sequencing.
Challenges & Barriers:
- High initial investment costs for sequencing platforms and consumables.
- Complex data analysis requirements demanding specialized expertise.
- Stringent regulatory approvals for diagnostic applications.
- Intense competition among established and emerging players.
Emerging Opportunities in NGS RNA Sequencing Market
- Liquid Biopsies: NGS RNA sequencing is expanding its applications in liquid biopsy analysis for early cancer detection and monitoring.
- Single-Cell RNA Sequencing: This technology is unlocking deeper insights into cellular heterogeneity and disease mechanisms.
- Microbiome Research: NGS RNA sequencing is gaining importance in understanding the role of the microbiome in health and disease.
- Expansion into developing markets: Significant growth opportunities exist in underserved regions.
Growth Accelerators in the NGS RNA Sequencing Market Industry
Strategic partnerships and collaborations between technology providers, research institutions, and pharmaceutical companies are accelerating market growth. Technological breakthroughs in areas such as long-read sequencing, single-cell analysis, and improved data analysis software are enabling new applications and improving the accuracy and efficiency of RNA sequencing. Market expansion into emerging economies and the growing application of RNA sequencing in personalized medicine are further driving market growth.
Key Players Shaping the NGS RNA Sequencing Market Market
- Illumina Inc
- Tecan Trading AG
- Thermo Fisher Scientific Inc
- Bio-Rad Laboratories Inc
- F Hoffmann-La Roche Ltd
- Takara Bio Inc
- Agilent Technologies Inc
- Hamilton Company
- PerkinElmer Inc
- Oxford Nanopore Technologies
Notable Milestones in NGS RNA Sequencing Market Sector
- October 2022: PacBio launched a multiplexed array sequencing (MAS-Seq) kit, enabling long-read single-cell RNA sequencing for improved detection of novel isoforms, mutations, and fusion genes.
- March 2022: Quantbio launched the sparQ RNA-Seq HMR kit, an ultra-fast library preparation tool for high-quality transcriptome libraries from challenging samples.
In-Depth NGS RNA Sequencing Market Market Outlook
The NGS RNA Sequencing market is poised for sustained growth, driven by continued technological innovation, expanding applications in personalized medicine and diagnostics, and increasing investment in research and development. Strategic partnerships and collaborations are expected to further accelerate market expansion. The integration of artificial intelligence and machine learning for data analysis will create new opportunities. The market presents significant potential for players who can offer innovative solutions, robust data analysis capabilities, and cost-effective services.
NGS RNA Sequencing Market Segmentation
-
1. Product and Services
- 1.1. Sequencing Platform and Consumables
- 1.2. Sequencing Services
-
2. Technology
- 2.1. Nanopore Sequencing
- 2.2. Sequencing by Synthesis
- 2.3. Ion Semiconductor Sequencing
- 2.4. Single Molecule Real Time Sequencing
-
3. Application
- 3.1. Drug Discovery
- 3.2. Diagnostics
- 3.3. Precision Medicine
- 3.4. Other Applications
-
4. End-User
- 4.1. Biotechnology and Pharmaceutical Companies
- 4.2. Hospitals and Clinics
- 4.3. Other End-Users
NGS RNA Sequencing Market Segmentation By Geography
-
1. North America
- 1.1. United States
- 1.2. Canada
- 1.3. Mexico
-
2. Europe
- 2.1. Germany
- 2.2. United Kingdom
- 2.3. France
- 2.4. Italy
- 2.5. Spain
- 2.6. Rest of Europe
-
3. Asia Pacific
- 3.1. China
- 3.2. Japan
- 3.3. India
- 3.4. Australia
- 3.5. South Korea
- 3.6. Rest of Asia Pacific
-
4. Middle East and Africa
- 4.1. GCC
- 4.2. South Africa
- 4.3. Rest of Middle East and Africa
-
5. South America
- 5.1. Brazil
- 5.2. Argentina
- 5.3. Rest of South America
NGS RNA Sequencing Market REPORT HIGHLIGHTS
| Aspects | Details |
|---|---|
| Study Period | 2019-2033 |
| Base Year | 2024 |
| Estimated Year | 2025 |
| Forecast Period | 2025-2033 |
| Historical Period | 2019-2024 |
| Growth Rate | CAGR of 20.06% from 2019-2033 |
| Segmentation |
|
Table of Contents
- 1. Introduction
- 1.1. Research Scope
- 1.2. Market Segmentation
- 1.3. Research Methodology
- 1.4. Definitions and Assumptions
- 2. Executive Summary
- 2.1. Introduction
- 3. Market Dynamics
- 3.1. Introduction
- 3.2. Market Drivers
- 3.2.1. Surge in Products Approvals for RNA-sequencing Platforms and Consumables; Advancements in Precision Medicine; Advantages of NGS-based RNA-sequencing
- 3.3. Market Restrains
- 3.3.1. Lack of Standardization; Interpretation Of Complex Data And Lack Of Skilled Professionals
- 3.4. Market Trends
- 3.4.1. Sequencing Platform and Consumables Segment is Expected to Hold the Significant Market Share in the NGS-Based RNA-Sequencing Market Over the Forecast Period
- 4. Market Factor Analysis
- 4.1. Porters Five Forces
- 4.2. Supply/Value Chain
- 4.3. PESTEL analysis
- 4.4. Market Entropy
- 4.5. Patent/Trademark Analysis
- 5. Global NGS RNA Sequencing Market Analysis, Insights and Forecast, 2019-2031
- 5.1. Market Analysis, Insights and Forecast - by Product and Services
- 5.1.1. Sequencing Platform and Consumables
- 5.1.2. Sequencing Services
- 5.2. Market Analysis, Insights and Forecast - by Technology
- 5.2.1. Nanopore Sequencing
- 5.2.2. Sequencing by Synthesis
- 5.2.3. Ion Semiconductor Sequencing
- 5.2.4. Single Molecule Real Time Sequencing
- 5.3. Market Analysis, Insights and Forecast - by Application
- 5.3.1. Drug Discovery
- 5.3.2. Diagnostics
- 5.3.3. Precision Medicine
- 5.3.4. Other Applications
- 5.4. Market Analysis, Insights and Forecast - by End-User
- 5.4.1. Biotechnology and Pharmaceutical Companies
- 5.4.2. Hospitals and Clinics
- 5.4.3. Other End-Users
- 5.5. Market Analysis, Insights and Forecast - by Region
- 5.5.1. North America
- 5.5.2. Europe
- 5.5.3. Asia Pacific
- 5.5.4. Middle East and Africa
- 5.5.5. South America
- 5.1. Market Analysis, Insights and Forecast - by Product and Services
- 6. North America NGS RNA Sequencing Market Analysis, Insights and Forecast, 2019-2031
- 6.1. Market Analysis, Insights and Forecast - by Product and Services
- 6.1.1. Sequencing Platform and Consumables
- 6.1.2. Sequencing Services
- 6.2. Market Analysis, Insights and Forecast - by Technology
- 6.2.1. Nanopore Sequencing
- 6.2.2. Sequencing by Synthesis
- 6.2.3. Ion Semiconductor Sequencing
- 6.2.4. Single Molecule Real Time Sequencing
- 6.3. Market Analysis, Insights and Forecast - by Application
- 6.3.1. Drug Discovery
- 6.3.2. Diagnostics
- 6.3.3. Precision Medicine
- 6.3.4. Other Applications
- 6.4. Market Analysis, Insights and Forecast - by End-User
- 6.4.1. Biotechnology and Pharmaceutical Companies
- 6.4.2. Hospitals and Clinics
- 6.4.3. Other End-Users
- 6.1. Market Analysis, Insights and Forecast - by Product and Services
- 7. Europe NGS RNA Sequencing Market Analysis, Insights and Forecast, 2019-2031
- 7.1. Market Analysis, Insights and Forecast - by Product and Services
- 7.1.1. Sequencing Platform and Consumables
- 7.1.2. Sequencing Services
- 7.2. Market Analysis, Insights and Forecast - by Technology
- 7.2.1. Nanopore Sequencing
- 7.2.2. Sequencing by Synthesis
- 7.2.3. Ion Semiconductor Sequencing
- 7.2.4. Single Molecule Real Time Sequencing
- 7.3. Market Analysis, Insights and Forecast - by Application
- 7.3.1. Drug Discovery
- 7.3.2. Diagnostics
- 7.3.3. Precision Medicine
- 7.3.4. Other Applications
- 7.4. Market Analysis, Insights and Forecast - by End-User
- 7.4.1. Biotechnology and Pharmaceutical Companies
- 7.4.2. Hospitals and Clinics
- 7.4.3. Other End-Users
- 7.1. Market Analysis, Insights and Forecast - by Product and Services
- 8. Asia Pacific NGS RNA Sequencing Market Analysis, Insights and Forecast, 2019-2031
- 8.1. Market Analysis, Insights and Forecast - by Product and Services
- 8.1.1. Sequencing Platform and Consumables
- 8.1.2. Sequencing Services
- 8.2. Market Analysis, Insights and Forecast - by Technology
- 8.2.1. Nanopore Sequencing
- 8.2.2. Sequencing by Synthesis
- 8.2.3. Ion Semiconductor Sequencing
- 8.2.4. Single Molecule Real Time Sequencing
- 8.3. Market Analysis, Insights and Forecast - by Application
- 8.3.1. Drug Discovery
- 8.3.2. Diagnostics
- 8.3.3. Precision Medicine
- 8.3.4. Other Applications
- 8.4. Market Analysis, Insights and Forecast - by End-User
- 8.4.1. Biotechnology and Pharmaceutical Companies
- 8.4.2. Hospitals and Clinics
- 8.4.3. Other End-Users
- 8.1. Market Analysis, Insights and Forecast - by Product and Services
- 9. Middle East and Africa NGS RNA Sequencing Market Analysis, Insights and Forecast, 2019-2031
- 9.1. Market Analysis, Insights and Forecast - by Product and Services
- 9.1.1. Sequencing Platform and Consumables
- 9.1.2. Sequencing Services
- 9.2. Market Analysis, Insights and Forecast - by Technology
- 9.2.1. Nanopore Sequencing
- 9.2.2. Sequencing by Synthesis
- 9.2.3. Ion Semiconductor Sequencing
- 9.2.4. Single Molecule Real Time Sequencing
- 9.3. Market Analysis, Insights and Forecast - by Application
- 9.3.1. Drug Discovery
- 9.3.2. Diagnostics
- 9.3.3. Precision Medicine
- 9.3.4. Other Applications
- 9.4. Market Analysis, Insights and Forecast - by End-User
- 9.4.1. Biotechnology and Pharmaceutical Companies
- 9.4.2. Hospitals and Clinics
- 9.4.3. Other End-Users
- 9.1. Market Analysis, Insights and Forecast - by Product and Services
- 10. South America NGS RNA Sequencing Market Analysis, Insights and Forecast, 2019-2031
- 10.1. Market Analysis, Insights and Forecast - by Product and Services
- 10.1.1. Sequencing Platform and Consumables
- 10.1.2. Sequencing Services
- 10.2. Market Analysis, Insights and Forecast - by Technology
- 10.2.1. Nanopore Sequencing
- 10.2.2. Sequencing by Synthesis
- 10.2.3. Ion Semiconductor Sequencing
- 10.2.4. Single Molecule Real Time Sequencing
- 10.3. Market Analysis, Insights and Forecast - by Application
- 10.3.1. Drug Discovery
- 10.3.2. Diagnostics
- 10.3.3. Precision Medicine
- 10.3.4. Other Applications
- 10.4. Market Analysis, Insights and Forecast - by End-User
- 10.4.1. Biotechnology and Pharmaceutical Companies
- 10.4.2. Hospitals and Clinics
- 10.4.3. Other End-Users
- 10.1. Market Analysis, Insights and Forecast - by Product and Services
- 11. North America NGS RNA Sequencing Market Analysis, Insights and Forecast, 2019-2031
- 11.1. Market Analysis, Insights and Forecast - By Country/Sub-region
- 11.1.1 United States
- 11.1.2 Canada
- 11.1.3 Mexico
- 12. Europe NGS RNA Sequencing Market Analysis, Insights and Forecast, 2019-2031
- 12.1. Market Analysis, Insights and Forecast - By Country/Sub-region
- 12.1.1 Germany
- 12.1.2 United Kingdom
- 12.1.3 France
- 12.1.4 Italy
- 12.1.5 Spain
- 12.1.6 Rest of Europe
- 13. Asia Pacific NGS RNA Sequencing Market Analysis, Insights and Forecast, 2019-2031
- 13.1. Market Analysis, Insights and Forecast - By Country/Sub-region
- 13.1.1 China
- 13.1.2 Japan
- 13.1.3 India
- 13.1.4 Australia
- 13.1.5 South Korea
- 13.1.6 Rest of Asia Pacific
- 14. Middle East and Africa NGS RNA Sequencing Market Analysis, Insights and Forecast, 2019-2031
- 14.1. Market Analysis, Insights and Forecast - By Country/Sub-region
- 14.1.1 GCC
- 14.1.2 South Africa
- 14.1.3 Rest of Middle East and Africa
- 15. South America NGS RNA Sequencing Market Analysis, Insights and Forecast, 2019-2031
- 15.1. Market Analysis, Insights and Forecast - By Country/Sub-region
- 15.1.1 Brazil
- 15.1.2 Argentina
- 15.1.3 Rest of South America
- 16. Competitive Analysis
- 16.1. Global Market Share Analysis 2024
- 16.2. Company Profiles
- 16.2.1 IlluminaInc
- 16.2.1.1. Overview
- 16.2.1.2. Products
- 16.2.1.3. SWOT Analysis
- 16.2.1.4. Recent Developments
- 16.2.1.5. Financials (Based on Availability)
- 16.2.2 Tecan Trading AG
- 16.2.2.1. Overview
- 16.2.2.2. Products
- 16.2.2.3. SWOT Analysis
- 16.2.2.4. Recent Developments
- 16.2.2.5. Financials (Based on Availability)
- 16.2.3 Thermo Fisher Scientific Inc
- 16.2.3.1. Overview
- 16.2.3.2. Products
- 16.2.3.3. SWOT Analysis
- 16.2.3.4. Recent Developments
- 16.2.3.5. Financials (Based on Availability)
- 16.2.4 Bio-Rad Laboratories Inc
- 16.2.4.1. Overview
- 16.2.4.2. Products
- 16.2.4.3. SWOT Analysis
- 16.2.4.4. Recent Developments
- 16.2.4.5. Financials (Based on Availability)
- 16.2.5 F Hoffmann-La Roche Ltd
- 16.2.5.1. Overview
- 16.2.5.2. Products
- 16.2.5.3. SWOT Analysis
- 16.2.5.4. Recent Developments
- 16.2.5.5. Financials (Based on Availability)
- 16.2.6 Takara Bio Inc
- 16.2.6.1. Overview
- 16.2.6.2. Products
- 16.2.6.3. SWOT Analysis
- 16.2.6.4. Recent Developments
- 16.2.6.5. Financials (Based on Availability)
- 16.2.7 Agilent Technologies Inc
- 16.2.7.1. Overview
- 16.2.7.2. Products
- 16.2.7.3. SWOT Analysis
- 16.2.7.4. Recent Developments
- 16.2.7.5. Financials (Based on Availability)
- 16.2.8 Hamilton Company
- 16.2.8.1. Overview
- 16.2.8.2. Products
- 16.2.8.3. SWOT Analysis
- 16.2.8.4. Recent Developments
- 16.2.8.5. Financials (Based on Availability)
- 16.2.9 PerkinElmer Inc
- 16.2.9.1. Overview
- 16.2.9.2. Products
- 16.2.9.3. SWOT Analysis
- 16.2.9.4. Recent Developments
- 16.2.9.5. Financials (Based on Availability)
- 16.2.10 Oxford Nanopore Technologies
- 16.2.10.1. Overview
- 16.2.10.2. Products
- 16.2.10.3. SWOT Analysis
- 16.2.10.4. Recent Developments
- 16.2.10.5. Financials (Based on Availability)
- 16.2.1 IlluminaInc
List of Figures
- Figure 1: Global NGS RNA Sequencing Market Revenue Breakdown (Million, %) by Region 2024 & 2032
- Figure 2: Global NGS RNA Sequencing Market Volume Breakdown (K Unit, %) by Region 2024 & 2032
- Figure 3: North America NGS RNA Sequencing Market Revenue (Million), by Country 2024 & 2032
- Figure 4: North America NGS RNA Sequencing Market Volume (K Unit), by Country 2024 & 2032
- Figure 5: North America NGS RNA Sequencing Market Revenue Share (%), by Country 2024 & 2032
- Figure 6: North America NGS RNA Sequencing Market Volume Share (%), by Country 2024 & 2032
- Figure 7: Europe NGS RNA Sequencing Market Revenue (Million), by Country 2024 & 2032
- Figure 8: Europe NGS RNA Sequencing Market Volume (K Unit), by Country 2024 & 2032
- Figure 9: Europe NGS RNA Sequencing Market Revenue Share (%), by Country 2024 & 2032
- Figure 10: Europe NGS RNA Sequencing Market Volume Share (%), by Country 2024 & 2032
- Figure 11: Asia Pacific NGS RNA Sequencing Market Revenue (Million), by Country 2024 & 2032
- Figure 12: Asia Pacific NGS RNA Sequencing Market Volume (K Unit), by Country 2024 & 2032
- Figure 13: Asia Pacific NGS RNA Sequencing Market Revenue Share (%), by Country 2024 & 2032
- Figure 14: Asia Pacific NGS RNA Sequencing Market Volume Share (%), by Country 2024 & 2032
- Figure 15: Middle East and Africa NGS RNA Sequencing Market Revenue (Million), by Country 2024 & 2032
- Figure 16: Middle East and Africa NGS RNA Sequencing Market Volume (K Unit), by Country 2024 & 2032
- Figure 17: Middle East and Africa NGS RNA Sequencing Market Revenue Share (%), by Country 2024 & 2032
- Figure 18: Middle East and Africa NGS RNA Sequencing Market Volume Share (%), by Country 2024 & 2032
- Figure 19: South America NGS RNA Sequencing Market Revenue (Million), by Country 2024 & 2032
- Figure 20: South America NGS RNA Sequencing Market Volume (K Unit), by Country 2024 & 2032
- Figure 21: South America NGS RNA Sequencing Market Revenue Share (%), by Country 2024 & 2032
- Figure 22: South America NGS RNA Sequencing Market Volume Share (%), by Country 2024 & 2032
- Figure 23: North America NGS RNA Sequencing Market Revenue (Million), by Product and Services 2024 & 2032
- Figure 24: North America NGS RNA Sequencing Market Volume (K Unit), by Product and Services 2024 & 2032
- Figure 25: North America NGS RNA Sequencing Market Revenue Share (%), by Product and Services 2024 & 2032
- Figure 26: North America NGS RNA Sequencing Market Volume Share (%), by Product and Services 2024 & 2032
- Figure 27: North America NGS RNA Sequencing Market Revenue (Million), by Technology 2024 & 2032
- Figure 28: North America NGS RNA Sequencing Market Volume (K Unit), by Technology 2024 & 2032
- Figure 29: North America NGS RNA Sequencing Market Revenue Share (%), by Technology 2024 & 2032
- Figure 30: North America NGS RNA Sequencing Market Volume Share (%), by Technology 2024 & 2032
- Figure 31: North America NGS RNA Sequencing Market Revenue (Million), by Application 2024 & 2032
- Figure 32: North America NGS RNA Sequencing Market Volume (K Unit), by Application 2024 & 2032
- Figure 33: North America NGS RNA Sequencing Market Revenue Share (%), by Application 2024 & 2032
- Figure 34: North America NGS RNA Sequencing Market Volume Share (%), by Application 2024 & 2032
- Figure 35: North America NGS RNA Sequencing Market Revenue (Million), by End-User 2024 & 2032
- Figure 36: North America NGS RNA Sequencing Market Volume (K Unit), by End-User 2024 & 2032
- Figure 37: North America NGS RNA Sequencing Market Revenue Share (%), by End-User 2024 & 2032
- Figure 38: North America NGS RNA Sequencing Market Volume Share (%), by End-User 2024 & 2032
- Figure 39: North America NGS RNA Sequencing Market Revenue (Million), by Country 2024 & 2032
- Figure 40: North America NGS RNA Sequencing Market Volume (K Unit), by Country 2024 & 2032
- Figure 41: North America NGS RNA Sequencing Market Revenue Share (%), by Country 2024 & 2032
- Figure 42: North America NGS RNA Sequencing Market Volume Share (%), by Country 2024 & 2032
- Figure 43: Europe NGS RNA Sequencing Market Revenue (Million), by Product and Services 2024 & 2032
- Figure 44: Europe NGS RNA Sequencing Market Volume (K Unit), by Product and Services 2024 & 2032
- Figure 45: Europe NGS RNA Sequencing Market Revenue Share (%), by Product and Services 2024 & 2032
- Figure 46: Europe NGS RNA Sequencing Market Volume Share (%), by Product and Services 2024 & 2032
- Figure 47: Europe NGS RNA Sequencing Market Revenue (Million), by Technology 2024 & 2032
- Figure 48: Europe NGS RNA Sequencing Market Volume (K Unit), by Technology 2024 & 2032
- Figure 49: Europe NGS RNA Sequencing Market Revenue Share (%), by Technology 2024 & 2032
- Figure 50: Europe NGS RNA Sequencing Market Volume Share (%), by Technology 2024 & 2032
- Figure 51: Europe NGS RNA Sequencing Market Revenue (Million), by Application 2024 & 2032
- Figure 52: Europe NGS RNA Sequencing Market Volume (K Unit), by Application 2024 & 2032
- Figure 53: Europe NGS RNA Sequencing Market Revenue Share (%), by Application 2024 & 2032
- Figure 54: Europe NGS RNA Sequencing Market Volume Share (%), by Application 2024 & 2032
- Figure 55: Europe NGS RNA Sequencing Market Revenue (Million), by End-User 2024 & 2032
- Figure 56: Europe NGS RNA Sequencing Market Volume (K Unit), by End-User 2024 & 2032
- Figure 57: Europe NGS RNA Sequencing Market Revenue Share (%), by End-User 2024 & 2032
- Figure 58: Europe NGS RNA Sequencing Market Volume Share (%), by End-User 2024 & 2032
- Figure 59: Europe NGS RNA Sequencing Market Revenue (Million), by Country 2024 & 2032
- Figure 60: Europe NGS RNA Sequencing Market Volume (K Unit), by Country 2024 & 2032
- Figure 61: Europe NGS RNA Sequencing Market Revenue Share (%), by Country 2024 & 2032
- Figure 62: Europe NGS RNA Sequencing Market Volume Share (%), by Country 2024 & 2032
- Figure 63: Asia Pacific NGS RNA Sequencing Market Revenue (Million), by Product and Services 2024 & 2032
- Figure 64: Asia Pacific NGS RNA Sequencing Market Volume (K Unit), by Product and Services 2024 & 2032
- Figure 65: Asia Pacific NGS RNA Sequencing Market Revenue Share (%), by Product and Services 2024 & 2032
- Figure 66: Asia Pacific NGS RNA Sequencing Market Volume Share (%), by Product and Services 2024 & 2032
- Figure 67: Asia Pacific NGS RNA Sequencing Market Revenue (Million), by Technology 2024 & 2032
- Figure 68: Asia Pacific NGS RNA Sequencing Market Volume (K Unit), by Technology 2024 & 2032
- Figure 69: Asia Pacific NGS RNA Sequencing Market Revenue Share (%), by Technology 2024 & 2032
- Figure 70: Asia Pacific NGS RNA Sequencing Market Volume Share (%), by Technology 2024 & 2032
- Figure 71: Asia Pacific NGS RNA Sequencing Market Revenue (Million), by Application 2024 & 2032
- Figure 72: Asia Pacific NGS RNA Sequencing Market Volume (K Unit), by Application 2024 & 2032
- Figure 73: Asia Pacific NGS RNA Sequencing Market Revenue Share (%), by Application 2024 & 2032
- Figure 74: Asia Pacific NGS RNA Sequencing Market Volume Share (%), by Application 2024 & 2032
- Figure 75: Asia Pacific NGS RNA Sequencing Market Revenue (Million), by End-User 2024 & 2032
- Figure 76: Asia Pacific NGS RNA Sequencing Market Volume (K Unit), by End-User 2024 & 2032
- Figure 77: Asia Pacific NGS RNA Sequencing Market Revenue Share (%), by End-User 2024 & 2032
- Figure 78: Asia Pacific NGS RNA Sequencing Market Volume Share (%), by End-User 2024 & 2032
- Figure 79: Asia Pacific NGS RNA Sequencing Market Revenue (Million), by Country 2024 & 2032
- Figure 80: Asia Pacific NGS RNA Sequencing Market Volume (K Unit), by Country 2024 & 2032
- Figure 81: Asia Pacific NGS RNA Sequencing Market Revenue Share (%), by Country 2024 & 2032
- Figure 82: Asia Pacific NGS RNA Sequencing Market Volume Share (%), by Country 2024 & 2032
- Figure 83: Middle East and Africa NGS RNA Sequencing Market Revenue (Million), by Product and Services 2024 & 2032
- Figure 84: Middle East and Africa NGS RNA Sequencing Market Volume (K Unit), by Product and Services 2024 & 2032
- Figure 85: Middle East and Africa NGS RNA Sequencing Market Revenue Share (%), by Product and Services 2024 & 2032
- Figure 86: Middle East and Africa NGS RNA Sequencing Market Volume Share (%), by Product and Services 2024 & 2032
- Figure 87: Middle East and Africa NGS RNA Sequencing Market Revenue (Million), by Technology 2024 & 2032
- Figure 88: Middle East and Africa NGS RNA Sequencing Market Volume (K Unit), by Technology 2024 & 2032
- Figure 89: Middle East and Africa NGS RNA Sequencing Market Revenue Share (%), by Technology 2024 & 2032
- Figure 90: Middle East and Africa NGS RNA Sequencing Market Volume Share (%), by Technology 2024 & 2032
- Figure 91: Middle East and Africa NGS RNA Sequencing Market Revenue (Million), by Application 2024 & 2032
- Figure 92: Middle East and Africa NGS RNA Sequencing Market Volume (K Unit), by Application 2024 & 2032
- Figure 93: Middle East and Africa NGS RNA Sequencing Market Revenue Share (%), by Application 2024 & 2032
- Figure 94: Middle East and Africa NGS RNA Sequencing Market Volume Share (%), by Application 2024 & 2032
- Figure 95: Middle East and Africa NGS RNA Sequencing Market Revenue (Million), by End-User 2024 & 2032
- Figure 96: Middle East and Africa NGS RNA Sequencing Market Volume (K Unit), by End-User 2024 & 2032
- Figure 97: Middle East and Africa NGS RNA Sequencing Market Revenue Share (%), by End-User 2024 & 2032
- Figure 98: Middle East and Africa NGS RNA Sequencing Market Volume Share (%), by End-User 2024 & 2032
- Figure 99: Middle East and Africa NGS RNA Sequencing Market Revenue (Million), by Country 2024 & 2032
- Figure 100: Middle East and Africa NGS RNA Sequencing Market Volume (K Unit), by Country 2024 & 2032
- Figure 101: Middle East and Africa NGS RNA Sequencing Market Revenue Share (%), by Country 2024 & 2032
- Figure 102: Middle East and Africa NGS RNA Sequencing Market Volume Share (%), by Country 2024 & 2032
- Figure 103: South America NGS RNA Sequencing Market Revenue (Million), by Product and Services 2024 & 2032
- Figure 104: South America NGS RNA Sequencing Market Volume (K Unit), by Product and Services 2024 & 2032
- Figure 105: South America NGS RNA Sequencing Market Revenue Share (%), by Product and Services 2024 & 2032
- Figure 106: South America NGS RNA Sequencing Market Volume Share (%), by Product and Services 2024 & 2032
- Figure 107: South America NGS RNA Sequencing Market Revenue (Million), by Technology 2024 & 2032
- Figure 108: South America NGS RNA Sequencing Market Volume (K Unit), by Technology 2024 & 2032
- Figure 109: South America NGS RNA Sequencing Market Revenue Share (%), by Technology 2024 & 2032
- Figure 110: South America NGS RNA Sequencing Market Volume Share (%), by Technology 2024 & 2032
- Figure 111: South America NGS RNA Sequencing Market Revenue (Million), by Application 2024 & 2032
- Figure 112: South America NGS RNA Sequencing Market Volume (K Unit), by Application 2024 & 2032
- Figure 113: South America NGS RNA Sequencing Market Revenue Share (%), by Application 2024 & 2032
- Figure 114: South America NGS RNA Sequencing Market Volume Share (%), by Application 2024 & 2032
- Figure 115: South America NGS RNA Sequencing Market Revenue (Million), by End-User 2024 & 2032
- Figure 116: South America NGS RNA Sequencing Market Volume (K Unit), by End-User 2024 & 2032
- Figure 117: South America NGS RNA Sequencing Market Revenue Share (%), by End-User 2024 & 2032
- Figure 118: South America NGS RNA Sequencing Market Volume Share (%), by End-User 2024 & 2032
- Figure 119: South America NGS RNA Sequencing Market Revenue (Million), by Country 2024 & 2032
- Figure 120: South America NGS RNA Sequencing Market Volume (K Unit), by Country 2024 & 2032
- Figure 121: South America NGS RNA Sequencing Market Revenue Share (%), by Country 2024 & 2032
- Figure 122: South America NGS RNA Sequencing Market Volume Share (%), by Country 2024 & 2032
List of Tables
- Table 1: Global NGS RNA Sequencing Market Revenue Million Forecast, by Region 2019 & 2032
- Table 2: Global NGS RNA Sequencing Market Volume K Unit Forecast, by Region 2019 & 2032
- Table 3: Global NGS RNA Sequencing Market Revenue Million Forecast, by Product and Services 2019 & 2032
- Table 4: Global NGS RNA Sequencing Market Volume K Unit Forecast, by Product and Services 2019 & 2032
- Table 5: Global NGS RNA Sequencing Market Revenue Million Forecast, by Technology 2019 & 2032
- Table 6: Global NGS RNA Sequencing Market Volume K Unit Forecast, by Technology 2019 & 2032
- Table 7: Global NGS RNA Sequencing Market Revenue Million Forecast, by Application 2019 & 2032
- Table 8: Global NGS RNA Sequencing Market Volume K Unit Forecast, by Application 2019 & 2032
- Table 9: Global NGS RNA Sequencing Market Revenue Million Forecast, by End-User 2019 & 2032
- Table 10: Global NGS RNA Sequencing Market Volume K Unit Forecast, by End-User 2019 & 2032
- Table 11: Global NGS RNA Sequencing Market Revenue Million Forecast, by Region 2019 & 2032
- Table 12: Global NGS RNA Sequencing Market Volume K Unit Forecast, by Region 2019 & 2032
- Table 13: Global NGS RNA Sequencing Market Revenue Million Forecast, by Country 2019 & 2032
- Table 14: Global NGS RNA Sequencing Market Volume K Unit Forecast, by Country 2019 & 2032
- Table 15: United States NGS RNA Sequencing Market Revenue (Million) Forecast, by Application 2019 & 2032
- Table 16: United States NGS RNA Sequencing Market Volume (K Unit) Forecast, by Application 2019 & 2032
- Table 17: Canada NGS RNA Sequencing Market Revenue (Million) Forecast, by Application 2019 & 2032
- Table 18: Canada NGS RNA Sequencing Market Volume (K Unit) Forecast, by Application 2019 & 2032
- Table 19: Mexico NGS RNA Sequencing Market Revenue (Million) Forecast, by Application 2019 & 2032
- Table 20: Mexico NGS RNA Sequencing Market Volume (K Unit) Forecast, by Application 2019 & 2032
- Table 21: Global NGS RNA Sequencing Market Revenue Million Forecast, by Country 2019 & 2032
- Table 22: Global NGS RNA Sequencing Market Volume K Unit Forecast, by Country 2019 & 2032
- Table 23: Germany NGS RNA Sequencing Market Revenue (Million) Forecast, by Application 2019 & 2032
- Table 24: Germany NGS RNA Sequencing Market Volume (K Unit) Forecast, by Application 2019 & 2032
- Table 25: United Kingdom NGS RNA Sequencing Market Revenue (Million) Forecast, by Application 2019 & 2032
- Table 26: United Kingdom NGS RNA Sequencing Market Volume (K Unit) Forecast, by Application 2019 & 2032
- Table 27: France NGS RNA Sequencing Market Revenue (Million) Forecast, by Application 2019 & 2032
- Table 28: France NGS RNA Sequencing Market Volume (K Unit) Forecast, by Application 2019 & 2032
- Table 29: Italy NGS RNA Sequencing Market Revenue (Million) Forecast, by Application 2019 & 2032
- Table 30: Italy NGS RNA Sequencing Market Volume (K Unit) Forecast, by Application 2019 & 2032
- Table 31: Spain NGS RNA Sequencing Market Revenue (Million) Forecast, by Application 2019 & 2032
- Table 32: Spain NGS RNA Sequencing Market Volume (K Unit) Forecast, by Application 2019 & 2032
- Table 33: Rest of Europe NGS RNA Sequencing Market Revenue (Million) Forecast, by Application 2019 & 2032
- Table 34: Rest of Europe NGS RNA Sequencing Market Volume (K Unit) Forecast, by Application 2019 & 2032
- Table 35: Global NGS RNA Sequencing Market Revenue Million Forecast, by Country 2019 & 2032
- Table 36: Global NGS RNA Sequencing Market Volume K Unit Forecast, by Country 2019 & 2032
- Table 37: China NGS RNA Sequencing Market Revenue (Million) Forecast, by Application 2019 & 2032
- Table 38: China NGS RNA Sequencing Market Volume (K Unit) Forecast, by Application 2019 & 2032
- Table 39: Japan NGS RNA Sequencing Market Revenue (Million) Forecast, by Application 2019 & 2032
- Table 40: Japan NGS RNA Sequencing Market Volume (K Unit) Forecast, by Application 2019 & 2032
- Table 41: India NGS RNA Sequencing Market Revenue (Million) Forecast, by Application 2019 & 2032
- Table 42: India NGS RNA Sequencing Market Volume (K Unit) Forecast, by Application 2019 & 2032
- Table 43: Australia NGS RNA Sequencing Market Revenue (Million) Forecast, by Application 2019 & 2032
- Table 44: Australia NGS RNA Sequencing Market Volume (K Unit) Forecast, by Application 2019 & 2032
- Table 45: South Korea NGS RNA Sequencing Market Revenue (Million) Forecast, by Application 2019 & 2032
- Table 46: South Korea NGS RNA Sequencing Market Volume (K Unit) Forecast, by Application 2019 & 2032
- Table 47: Rest of Asia Pacific NGS RNA Sequencing Market Revenue (Million) Forecast, by Application 2019 & 2032
- Table 48: Rest of Asia Pacific NGS RNA Sequencing Market Volume (K Unit) Forecast, by Application 2019 & 2032
- Table 49: Global NGS RNA Sequencing Market Revenue Million Forecast, by Country 2019 & 2032
- Table 50: Global NGS RNA Sequencing Market Volume K Unit Forecast, by Country 2019 & 2032
- Table 51: GCC NGS RNA Sequencing Market Revenue (Million) Forecast, by Application 2019 & 2032
- Table 52: GCC NGS RNA Sequencing Market Volume (K Unit) Forecast, by Application 2019 & 2032
- Table 53: South Africa NGS RNA Sequencing Market Revenue (Million) Forecast, by Application 2019 & 2032
- Table 54: South Africa NGS RNA Sequencing Market Volume (K Unit) Forecast, by Application 2019 & 2032
- Table 55: Rest of Middle East and Africa NGS RNA Sequencing Market Revenue (Million) Forecast, by Application 2019 & 2032
- Table 56: Rest of Middle East and Africa NGS RNA Sequencing Market Volume (K Unit) Forecast, by Application 2019 & 2032
- Table 57: Global NGS RNA Sequencing Market Revenue Million Forecast, by Country 2019 & 2032
- Table 58: Global NGS RNA Sequencing Market Volume K Unit Forecast, by Country 2019 & 2032
- Table 59: Brazil NGS RNA Sequencing Market Revenue (Million) Forecast, by Application 2019 & 2032
- Table 60: Brazil NGS RNA Sequencing Market Volume (K Unit) Forecast, by Application 2019 & 2032
- Table 61: Argentina NGS RNA Sequencing Market Revenue (Million) Forecast, by Application 2019 & 2032
- Table 62: Argentina NGS RNA Sequencing Market Volume (K Unit) Forecast, by Application 2019 & 2032
- Table 63: Rest of South America NGS RNA Sequencing Market Revenue (Million) Forecast, by Application 2019 & 2032
- Table 64: Rest of South America NGS RNA Sequencing Market Volume (K Unit) Forecast, by Application 2019 & 2032
- Table 65: Global NGS RNA Sequencing Market Revenue Million Forecast, by Product and Services 2019 & 2032
- Table 66: Global NGS RNA Sequencing Market Volume K Unit Forecast, by Product and Services 2019 & 2032
- Table 67: Global NGS RNA Sequencing Market Revenue Million Forecast, by Technology 2019 & 2032
- Table 68: Global NGS RNA Sequencing Market Volume K Unit Forecast, by Technology 2019 & 2032
- Table 69: Global NGS RNA Sequencing Market Revenue Million Forecast, by Application 2019 & 2032
- Table 70: Global NGS RNA Sequencing Market Volume K Unit Forecast, by Application 2019 & 2032
- Table 71: Global NGS RNA Sequencing Market Revenue Million Forecast, by End-User 2019 & 2032
- Table 72: Global NGS RNA Sequencing Market Volume K Unit Forecast, by End-User 2019 & 2032
- Table 73: Global NGS RNA Sequencing Market Revenue Million Forecast, by Country 2019 & 2032
- Table 74: Global NGS RNA Sequencing Market Volume K Unit Forecast, by Country 2019 & 2032
- Table 75: United States NGS RNA Sequencing Market Revenue (Million) Forecast, by Application 2019 & 2032
- Table 76: United States NGS RNA Sequencing Market Volume (K Unit) Forecast, by Application 2019 & 2032
- Table 77: Canada NGS RNA Sequencing Market Revenue (Million) Forecast, by Application 2019 & 2032
- Table 78: Canada NGS RNA Sequencing Market Volume (K Unit) Forecast, by Application 2019 & 2032
- Table 79: Mexico NGS RNA Sequencing Market Revenue (Million) Forecast, by Application 2019 & 2032
- Table 80: Mexico NGS RNA Sequencing Market Volume (K Unit) Forecast, by Application 2019 & 2032
- Table 81: Global NGS RNA Sequencing Market Revenue Million Forecast, by Product and Services 2019 & 2032
- Table 82: Global NGS RNA Sequencing Market Volume K Unit Forecast, by Product and Services 2019 & 2032
- Table 83: Global NGS RNA Sequencing Market Revenue Million Forecast, by Technology 2019 & 2032
- Table 84: Global NGS RNA Sequencing Market Volume K Unit Forecast, by Technology 2019 & 2032
- Table 85: Global NGS RNA Sequencing Market Revenue Million Forecast, by Application 2019 & 2032
- Table 86: Global NGS RNA Sequencing Market Volume K Unit Forecast, by Application 2019 & 2032
- Table 87: Global NGS RNA Sequencing Market Revenue Million Forecast, by End-User 2019 & 2032
- Table 88: Global NGS RNA Sequencing Market Volume K Unit Forecast, by End-User 2019 & 2032
- Table 89: Global NGS RNA Sequencing Market Revenue Million Forecast, by Country 2019 & 2032
- Table 90: Global NGS RNA Sequencing Market Volume K Unit Forecast, by Country 2019 & 2032
- Table 91: Germany NGS RNA Sequencing Market Revenue (Million) Forecast, by Application 2019 & 2032
- Table 92: Germany NGS RNA Sequencing Market Volume (K Unit) Forecast, by Application 2019 & 2032
- Table 93: United Kingdom NGS RNA Sequencing Market Revenue (Million) Forecast, by Application 2019 & 2032
- Table 94: United Kingdom NGS RNA Sequencing Market Volume (K Unit) Forecast, by Application 2019 & 2032
- Table 95: France NGS RNA Sequencing Market Revenue (Million) Forecast, by Application 2019 & 2032
- Table 96: France NGS RNA Sequencing Market Volume (K Unit) Forecast, by Application 2019 & 2032
- Table 97: Italy NGS RNA Sequencing Market Revenue (Million) Forecast, by Application 2019 & 2032
- Table 98: Italy NGS RNA Sequencing Market Volume (K Unit) Forecast, by Application 2019 & 2032
- Table 99: Spain NGS RNA Sequencing Market Revenue (Million) Forecast, by Application 2019 & 2032
- Table 100: Spain NGS RNA Sequencing Market Volume (K Unit) Forecast, by Application 2019 & 2032
- Table 101: Rest of Europe NGS RNA Sequencing Market Revenue (Million) Forecast, by Application 2019 & 2032
- Table 102: Rest of Europe NGS RNA Sequencing Market Volume (K Unit) Forecast, by Application 2019 & 2032
- Table 103: Global NGS RNA Sequencing Market Revenue Million Forecast, by Product and Services 2019 & 2032
- Table 104: Global NGS RNA Sequencing Market Volume K Unit Forecast, by Product and Services 2019 & 2032
- Table 105: Global NGS RNA Sequencing Market Revenue Million Forecast, by Technology 2019 & 2032
- Table 106: Global NGS RNA Sequencing Market Volume K Unit Forecast, by Technology 2019 & 2032
- Table 107: Global NGS RNA Sequencing Market Revenue Million Forecast, by Application 2019 & 2032
- Table 108: Global NGS RNA Sequencing Market Volume K Unit Forecast, by Application 2019 & 2032
- Table 109: Global NGS RNA Sequencing Market Revenue Million Forecast, by End-User 2019 & 2032
- Table 110: Global NGS RNA Sequencing Market Volume K Unit Forecast, by End-User 2019 & 2032
- Table 111: Global NGS RNA Sequencing Market Revenue Million Forecast, by Country 2019 & 2032
- Table 112: Global NGS RNA Sequencing Market Volume K Unit Forecast, by Country 2019 & 2032
- Table 113: China NGS RNA Sequencing Market Revenue (Million) Forecast, by Application 2019 & 2032
- Table 114: China NGS RNA Sequencing Market Volume (K Unit) Forecast, by Application 2019 & 2032
- Table 115: Japan NGS RNA Sequencing Market Revenue (Million) Forecast, by Application 2019 & 2032
- Table 116: Japan NGS RNA Sequencing Market Volume (K Unit) Forecast, by Application 2019 & 2032
- Table 117: India NGS RNA Sequencing Market Revenue (Million) Forecast, by Application 2019 & 2032
- Table 118: India NGS RNA Sequencing Market Volume (K Unit) Forecast, by Application 2019 & 2032
- Table 119: Australia NGS RNA Sequencing Market Revenue (Million) Forecast, by Application 2019 & 2032
- Table 120: Australia NGS RNA Sequencing Market Volume (K Unit) Forecast, by Application 2019 & 2032
- Table 121: South Korea NGS RNA Sequencing Market Revenue (Million) Forecast, by Application 2019 & 2032
- Table 122: South Korea NGS RNA Sequencing Market Volume (K Unit) Forecast, by Application 2019 & 2032
- Table 123: Rest of Asia Pacific NGS RNA Sequencing Market Revenue (Million) Forecast, by Application 2019 & 2032
- Table 124: Rest of Asia Pacific NGS RNA Sequencing Market Volume (K Unit) Forecast, by Application 2019 & 2032
- Table 125: Global NGS RNA Sequencing Market Revenue Million Forecast, by Product and Services 2019 & 2032
- Table 126: Global NGS RNA Sequencing Market Volume K Unit Forecast, by Product and Services 2019 & 2032
- Table 127: Global NGS RNA Sequencing Market Revenue Million Forecast, by Technology 2019 & 2032
- Table 128: Global NGS RNA Sequencing Market Volume K Unit Forecast, by Technology 2019 & 2032
- Table 129: Global NGS RNA Sequencing Market Revenue Million Forecast, by Application 2019 & 2032
- Table 130: Global NGS RNA Sequencing Market Volume K Unit Forecast, by Application 2019 & 2032
- Table 131: Global NGS RNA Sequencing Market Revenue Million Forecast, by End-User 2019 & 2032
- Table 132: Global NGS RNA Sequencing Market Volume K Unit Forecast, by End-User 2019 & 2032
- Table 133: Global NGS RNA Sequencing Market Revenue Million Forecast, by Country 2019 & 2032
- Table 134: Global NGS RNA Sequencing Market Volume K Unit Forecast, by Country 2019 & 2032
- Table 135: GCC NGS RNA Sequencing Market Revenue (Million) Forecast, by Application 2019 & 2032
- Table 136: GCC NGS RNA Sequencing Market Volume (K Unit) Forecast, by Application 2019 & 2032
- Table 137: South Africa NGS RNA Sequencing Market Revenue (Million) Forecast, by Application 2019 & 2032
- Table 138: South Africa NGS RNA Sequencing Market Volume (K Unit) Forecast, by Application 2019 & 2032
- Table 139: Rest of Middle East and Africa NGS RNA Sequencing Market Revenue (Million) Forecast, by Application 2019 & 2032
- Table 140: Rest of Middle East and Africa NGS RNA Sequencing Market Volume (K Unit) Forecast, by Application 2019 & 2032
- Table 141: Global NGS RNA Sequencing Market Revenue Million Forecast, by Product and Services 2019 & 2032
- Table 142: Global NGS RNA Sequencing Market Volume K Unit Forecast, by Product and Services 2019 & 2032
- Table 143: Global NGS RNA Sequencing Market Revenue Million Forecast, by Technology 2019 & 2032
- Table 144: Global NGS RNA Sequencing Market Volume K Unit Forecast, by Technology 2019 & 2032
- Table 145: Global NGS RNA Sequencing Market Revenue Million Forecast, by Application 2019 & 2032
- Table 146: Global NGS RNA Sequencing Market Volume K Unit Forecast, by Application 2019 & 2032
- Table 147: Global NGS RNA Sequencing Market Revenue Million Forecast, by End-User 2019 & 2032
- Table 148: Global NGS RNA Sequencing Market Volume K Unit Forecast, by End-User 2019 & 2032
- Table 149: Global NGS RNA Sequencing Market Revenue Million Forecast, by Country 2019 & 2032
- Table 150: Global NGS RNA Sequencing Market Volume K Unit Forecast, by Country 2019 & 2032
- Table 151: Brazil NGS RNA Sequencing Market Revenue (Million) Forecast, by Application 2019 & 2032
- Table 152: Brazil NGS RNA Sequencing Market Volume (K Unit) Forecast, by Application 2019 & 2032
- Table 153: Argentina NGS RNA Sequencing Market Revenue (Million) Forecast, by Application 2019 & 2032
- Table 154: Argentina NGS RNA Sequencing Market Volume (K Unit) Forecast, by Application 2019 & 2032
- Table 155: Rest of South America NGS RNA Sequencing Market Revenue (Million) Forecast, by Application 2019 & 2032
- Table 156: Rest of South America NGS RNA Sequencing Market Volume (K Unit) Forecast, by Application 2019 & 2032
Frequently Asked Questions
1. What is the projected Compound Annual Growth Rate (CAGR) of the NGS RNA Sequencing Market?
The projected CAGR is approximately 20.06%.
2. Which companies are prominent players in the NGS RNA Sequencing Market?
Key companies in the market include IlluminaInc, Tecan Trading AG, Thermo Fisher Scientific Inc , Bio-Rad Laboratories Inc, F Hoffmann-La Roche Ltd, Takara Bio Inc, Agilent Technologies Inc, Hamilton Company, PerkinElmer Inc, Oxford Nanopore Technologies.
3. What are the main segments of the NGS RNA Sequencing Market?
The market segments include Product and Services, Technology, Application, End-User.
4. Can you provide details about the market size?
The market size is estimated to be USD 3.71 Million as of 2022.
5. What are some drivers contributing to market growth?
Surge in Products Approvals for RNA-sequencing Platforms and Consumables; Advancements in Precision Medicine; Advantages of NGS-based RNA-sequencing.
6. What are the notable trends driving market growth?
Sequencing Platform and Consumables Segment is Expected to Hold the Significant Market Share in the NGS-Based RNA-Sequencing Market Over the Forecast Period.
7. Are there any restraints impacting market growth?
Lack of Standardization; Interpretation Of Complex Data And Lack Of Skilled Professionals.
8. Can you provide examples of recent developments in the market?
October 2022: PacBio launched a multiplexed array sequencing (MAS-Seq) kit in partnership with the Broad Institute of MIT and Harvard and 10x Genomics. The kit enables long-read single-cell RNA sequencing to further detect and characterize novel isoforms, novel driver mutations, and cancer fusion genes.
9. What pricing options are available for accessing the report?
Pricing options include single-user, multi-user, and enterprise licenses priced at USD 4750, USD 5250, and USD 8750 respectively.
10. Is the market size provided in terms of value or volume?
The market size is provided in terms of value, measured in Million and volume, measured in K Unit.
11. Are there any specific market keywords associated with the report?
Yes, the market keyword associated with the report is "NGS RNA Sequencing Market," which aids in identifying and referencing the specific market segment covered.
12. How do I determine which pricing option suits my needs best?
The pricing options vary based on user requirements and access needs. Individual users may opt for single-user licenses, while businesses requiring broader access may choose multi-user or enterprise licenses for cost-effective access to the report.
13. Are there any additional resources or data provided in the NGS RNA Sequencing Market report?
While the report offers comprehensive insights, it's advisable to review the specific contents or supplementary materials provided to ascertain if additional resources or data are available.
14. How can I stay updated on further developments or reports in the NGS RNA Sequencing Market?
To stay informed about further developments, trends, and reports in the NGS RNA Sequencing Market, consider subscribing to industry newsletters, following relevant companies and organizations, or regularly checking reputable industry news sources and publications.
Methodology
Step 1 - Identification of Relevant Samples Size from Population Database


Step 2 - Approaches for Defining Global Market Size (Value, Volume* & Price*)

Note*: In applicable scenarios
Step 3 - Data Sources
Primary Research
- Web Analytics
- Survey Reports
- Research Institute
- Latest Research Reports
- Opinion Leaders
Secondary Research
- Annual Reports
- White Paper
- Latest Press Release
- Industry Association
- Paid Database
- Investor Presentations

Step 4 - Data Triangulation
Involves using different sources of information in order to increase the validity of a study
These sources are likely to be stakeholders in a program - participants, other researchers, program staff, other community members, and so on.
Then we put all data in single framework & apply various statistical tools to find out the dynamic on the market.
During the analysis stage, feedback from the stakeholder groups would be compared to determine areas of agreement as well as areas of divergence


