

Key Insights
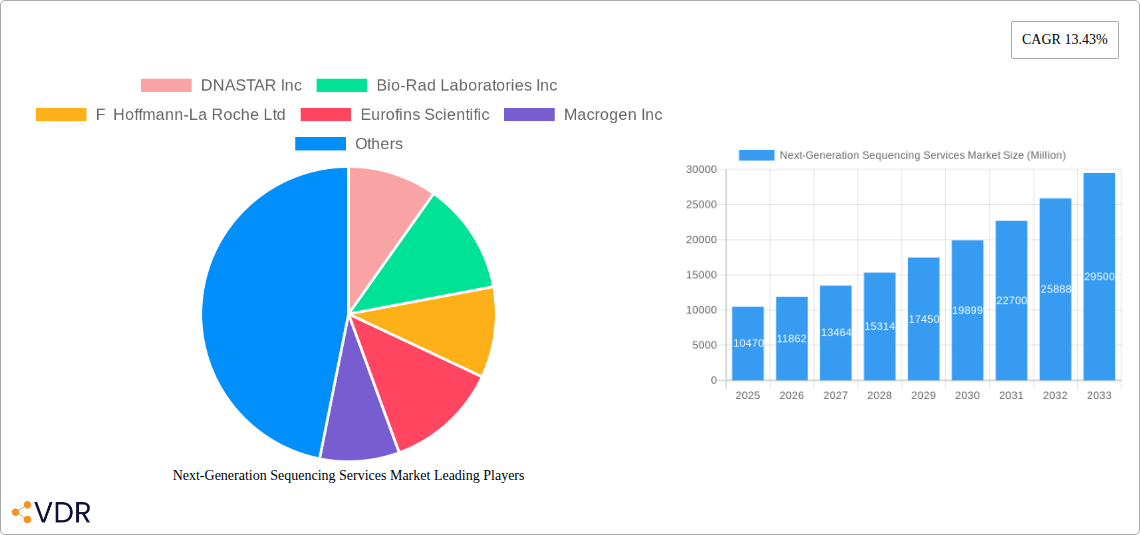
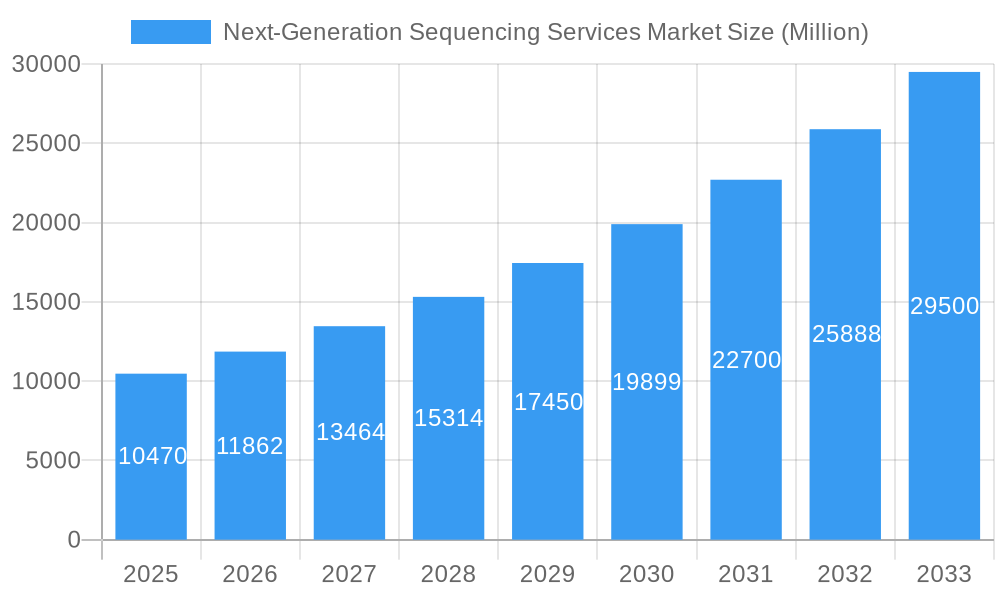
The Next-Generation Sequencing (NGS) services market is experiencing robust growth, projected to reach a market size of $10.47 billion in 2025 and exhibiting a Compound Annual Growth Rate (CAGR) of 13.43% from 2025 to 2033. This expansion is driven by several key factors. The increasing prevalence of chronic diseases necessitating advanced diagnostics fuels demand for NGS in drug discovery and personalized medicine. Furthermore, advancements in genomic research are broadening the applications of NGS across genetic screening, diagnostics, agriculture, and animal research, creating diverse revenue streams. The rising adoption of NGS in academic research and the growing investments by pharmaceutical and biotechnology companies in developing targeted therapies further contribute to market growth. Technological innovations leading to higher throughput, reduced costs, and increased accessibility of NGS technologies are also significant drivers. While data privacy concerns and regulatory hurdles pose some challenges, the overall market outlook remains positive. The market segmentation reveals a strong demand for whole genome sequencing services, followed by targeted resequencing and whole exome sequencing. Instrument sales constitute a substantial portion of the market, followed by reagents and consumables, and services. North America and Europe currently hold significant market shares, yet the Asia-Pacific region is anticipated to witness substantial growth owing to increasing healthcare expenditure and a rising prevalence of genetic disorders.
Next-Generation Sequencing Services Market Market Size (In Billion)
The competitive landscape is marked by a mix of established players like Illumina, Thermo Fisher Scientific, and Qiagen, alongside emerging companies. These companies are actively engaged in research and development to enhance NGS technologies and expand their service offerings. Strategic partnerships and acquisitions are common strategies to strengthen market positioning and expand into new geographical areas. The continued focus on developing user-friendly platforms and reducing turnaround times will likely further drive the adoption of NGS services across various sectors. The long-term outlook for the NGS services market is optimistic, driven by technological advancements, rising awareness about personalized medicine, and increasing government funding for genomics research. The market's future growth will depend on continued innovation, addressing regulatory concerns, and maintaining affordability to ensure broader access to this transformative technology.
Next-Generation Sequencing Services Market Company Market Share
Next-Generation Sequencing Services Market: A Comprehensive Report (2019-2033)
This comprehensive report provides an in-depth analysis of the Next-Generation Sequencing (NGS) Services market, encompassing its dynamics, growth trends, dominant segments, and key players. With a study period spanning 2019-2033, a base year of 2025, and a forecast period of 2025-2033, this report offers invaluable insights for industry professionals, investors, and researchers. The market is segmented by application, type of sequencing, product type, and end-user, providing a granular understanding of its diverse landscape. The total market size in 2025 is estimated at xx Million.
Next-Generation Sequencing Services Market Dynamics & Structure
The NGS services market is characterized by a moderately concentrated structure with a few dominant players holding significant market share. Illumina, Thermo Fisher Scientific, and Qiagen, among others, currently lead the market, accounting for approximately xx% of the total market share in 2025. Technological innovation is a key driver, with continuous advancements in sequencing technologies leading to increased throughput, reduced costs, and improved accuracy. Stringent regulatory frameworks governing the use of NGS data in diagnostics and personalized medicine influence market growth, necessitating compliance with regulations like HIPAA and GDPR. The market also experiences competition from traditional sequencing methods, although NGS's superior speed and capacity are making it increasingly dominant. End-user demographics are shifting, with a growing emphasis on personalized medicine driving demand from hospitals, pharmaceutical companies, and academic institutions. The market is witnessing an increasing number of mergers and acquisitions (M&As), with xx M&A deals recorded in the last 5 years, primarily driven by companies seeking to expand their product portfolios and market reach.
- Market Concentration: Moderately concentrated, with top players holding xx% market share in 2025.
- Technological Innovation: Continuous advancements in sequencing technologies, driving cost reduction and increased accuracy.
- Regulatory Landscape: Stringent regulations impacting data usage and market access.
- Competitive Substitutes: Traditional sequencing methods, but NGS's superior capabilities are driving market shift.
- End-User Demographics: Growing demand from hospitals, pharmaceutical companies, and research institutions.
- M&A Activity: xx M&A deals in the last 5 years, reflecting market consolidation.
Next-Generation Sequencing Services Market Growth Trends & Insights
The NGS services market is experiencing robust growth, driven by the increasing adoption of NGS technologies across various applications. The market size grew from xx Million in 2019 to an estimated xx Million in 2025, exhibiting a CAGR of xx% during the historical period (2019-2024). This growth is propelled by several factors, including declining sequencing costs, rising healthcare expenditure globally, and an increasing focus on personalized medicine. Technological disruptions, such as the introduction of long-read sequencing technologies and advancements in bioinformatics, are further accelerating market expansion. The market penetration of NGS services is increasing across various end-user segments, particularly in the healthcare and pharmaceutical sectors, as the clinical utility of NGS becomes more widely recognized. Shifting consumer behavior, driven by a growing awareness of genomic medicine, is also contributing to the market's growth trajectory. We project the market to reach xx Million by 2033, with a CAGR of xx% during the forecast period (2025-2033).
Dominant Regions, Countries, or Segments in Next-Generation Sequencing Services Market
North America currently dominates the NGS services market, driven by significant investments in healthcare infrastructure, a strong regulatory framework supporting NGS adoption, and the presence of major players in the region. The region holds approximately xx% of the global market share in 2025, exhibiting a significant growth potential in the coming years. Europe follows closely, accounting for roughly xx% of the market share. Within the application segment, Drug Discovery and Personalized Medicine demonstrates the highest growth, owing to increasing demand for targeted therapies and precision oncology. The Whole Genome Sequencing segment dominates within the type of sequencing category, while Instruments constitute the largest share in the product type segment. Hospitals and Healthcare Institutions are the largest end-user segment in 2025, showcasing strong growth potential.
- Key Drivers:
- Strong healthcare infrastructure and investment (North America)
- Favorable regulatory environment (North America & Europe)
- High adoption rates in drug discovery and personalized medicine (global)
- Growing awareness and acceptance of genomic medicine (global)
- Dominant Segments:
- Region: North America (xx% market share)
- Application: Drug Discovery and Personalized Medicine
- Type of Sequencing: Whole Genome Sequencing
- Product Type: Instruments
- End-User: Hospitals and Healthcare Institutions
Next-Generation Sequencing Services Market Product Landscape
The NGS services market showcases a diverse range of products, including high-throughput sequencers, sample preparation kits, bioinformatics software, and data analysis services. Continuous innovations in sequencing technologies, such as the development of faster, more accurate, and cost-effective platforms, are shaping the product landscape. The unique selling propositions of many products center on speed, accuracy, and data analysis capabilities tailored to specific applications. Technological advancements are leading to improved workflow efficiency and accessibility of NGS for a broader user base, expanding market reach.
Key Drivers, Barriers & Challenges in Next-Generation Sequencing Services Market
Key Drivers:
The NGS services market is propelled by factors such as the increasing demand for personalized medicine, advancements in sequencing technologies, decreasing sequencing costs, rising government funding for genomics research, and a growing understanding of the clinical utility of NGS in diagnostics.
Key Challenges:
Key challenges include the high initial investment costs associated with NGS equipment, the complexity of data analysis and interpretation, data privacy and security concerns, regulatory hurdles in specific jurisdictions, and intense competition among providers leading to price pressures. These challenges, while significant, are unlikely to stifle overall market growth, due to the substantial advantages NGS offers in healthcare and research.
Emerging Opportunities in Next-Generation Sequencing Services Market
Emerging opportunities lie in the expansion of NGS applications into new areas, such as infectious disease diagnostics, agricultural genomics, and environmental monitoring. Untapped markets in developing countries present significant growth potential. The integration of artificial intelligence (AI) and machine learning (ML) in NGS data analysis offers new avenues for improved accuracy and efficiency. The increasing demand for comprehensive genomic testing panels opens further avenues for innovation and market expansion.
Growth Accelerators in the Next-Generation Sequencing Services Market Industry
Long-term growth in the NGS services market will be fueled by several factors, including the development of more affordable and portable sequencers, strategic collaborations between technology providers and healthcare institutions, the ongoing expansion into new applications, and increasing access to genomic data for research purposes. The evolution of cloud-based data analysis platforms will streamline data handling and enhance accessibility.
Key Players Shaping the Next-Generation Sequencing Services Market Market
Notable Milestones in Next-Generation Sequencing Services Market Sector
- September 2022: Illumina Inc. launched the NovaSeq X Series, significantly increasing sequencing speed and efficiency.
- March 2023: SOPHiA GENETICS partnered with Qiagen, combining QIAseq technology with the DDM platform for enhanced tumor analysis.
- January 2023: QIAGEN partnered with Helix to advance next-generation sequencing companion diagnostics in hereditary diseases.
- March 2022: Thermo Fisher Scientific launched the Ion Torrent Genexus Dx Integrated Sequencer, an automated NGS platform.
In-Depth Next-Generation Sequencing Services Market Market Outlook
The future of the NGS services market is exceptionally promising, driven by continued technological advancements, expanding applications, and the growing understanding of the clinical and research utility of genomic data. Strategic partnerships and collaborations between technology providers and healthcare institutions will accelerate market growth. The focus on data analysis and interpretation will also drive innovation, leading to the development of sophisticated bioinformatics tools and improved diagnostic capabilities. The market's long-term growth trajectory is projected to remain robust, presenting significant opportunities for both established players and emerging companies.
Next-Generation Sequencing Services Market Segmentation
-
1. Type of Sequencing
- 1.1. Whole Genome Sequencing
- 1.2. Targeted Resequencing
- 1.3. Whole Exome Sequencing
- 1.4. RNA Sequencing
- 1.5. CHIP Sequencing
- 1.6. De Novo Sequencing
- 1.7. Methyl Sequencing
-
2. Product Type
- 2.1. Instruments
- 2.2. Reagents and Consumables
- 2.3. Services
-
3. End-User
- 3.1. Hospitals and Healthcare Institutions
- 3.2. Academics
- 3.3. Pharmaceutical and Biotechnology Companies
-
4. Application
- 4.1. Drug Discovery and Personalized Medicine
- 4.2. Genetic Screening
- 4.3. Diagnostics
- 4.4. Agriculture and Animal Research
- 4.5. Other Applications
Next-Generation Sequencing Services Market Segmentation By Geography
-
1. North America
- 1.1. United States
- 1.2. Canada
- 1.3. Mexico
-
2. Europe
- 2.1. Germany
- 2.2. United Kingdom
- 2.3. France
- 2.4. Italy
- 2.5. Spain
- 2.6. Rest of Europe
-
3. Asia Pacific
- 3.1. China
- 3.2. Japan
- 3.3. India
- 3.4. Australia
- 3.5. South Korea
- 3.6. Rest of Asia Pacific
-
4. Middle East and Africa
- 4.1. GCC
- 4.2. South Africa
- 4.3. Rest of Middle East and Africa
-
5. South America
- 5.1. Brazil
- 5.2. Argentina
- 5.3. Rest of South America
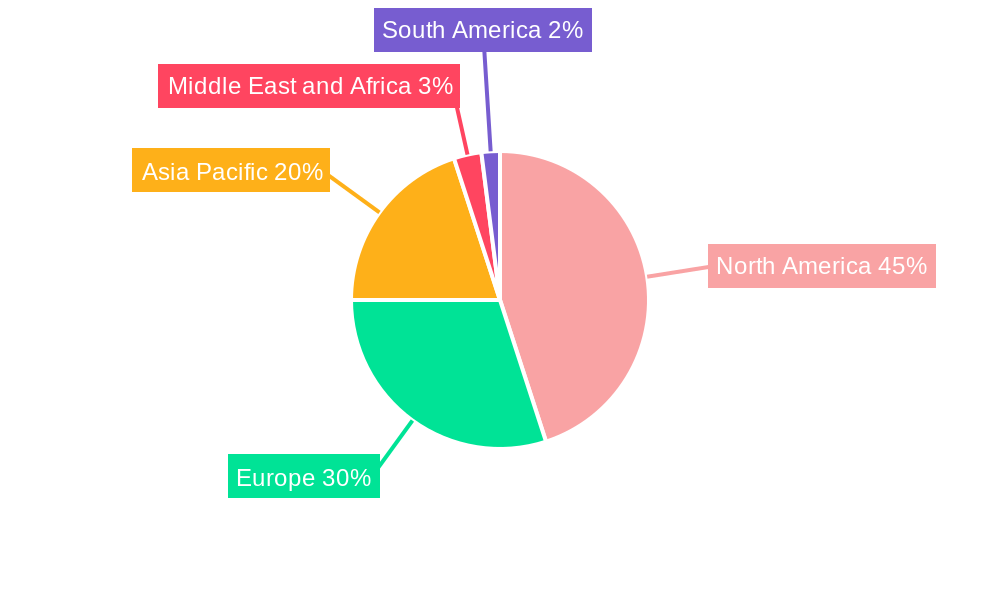
Next-Generation Sequencing Services Market Regional Market Share
Geographic Coverage of Next-Generation Sequencing Services Market
Next-Generation Sequencing Services Market REPORT HIGHLIGHTS
| Aspects | Details |
|---|---|
| Study Period | 2020-2034 |
| Base Year | 2025 |
| Estimated Year | 2026 |
| Forecast Period | 2026-2034 |
| Historical Period | 2020-2025 |
| Growth Rate | CAGR of 13.43% from 2020-2034 |
| Segmentation |
|
Table of Contents
- 1. Introduction
- 1.1. Research Scope
- 1.2. Market Segmentation
- 1.3. Research Objective
- 1.4. Definitions and Assumptions
- 2. Executive Summary
- 2.1. Market Snapshot
- 3. Market Dynamics
- 3.1. Market Drivers
- 3.2. Market Restrains
- 3.3. Market Trends
- 3.4. Market Opportunities
- 4. Market Factor Analysis
- 4.1. Porters Five Forces
- 4.1.1. Bargaining Power of Suppliers
- 4.1.2. Bargaining Power of Buyers
- 4.1.3. Threat of New Entrants
- 4.1.4. Threat of Substitutes
- 4.1.5. Competitive Rivalry
- 4.2. PESTEL analysis
- 4.3. BCG Analysis
- 4.3.1. Stars (High Growth, High Market Share)
- 4.3.2. Cash Cows (Low Growth, High Market Share)
- 4.3.3. Question Mark (High Growth, Low Market Share)
- 4.3.4. Dogs (Low Growth, Low Market Share)
- 4.4. Ansoff Matrix Analysis
- 4.5. Supply Chain Analysis
- 4.6. Regulatory Landscape
- 4.7. Current Market Potential and Opportunity Assessment (TAM–SAM–SOM Framework)
- 4.8. VDR Analyst Note
- 4.1. Porters Five Forces
- 5. Market Analysis, Insights and Forecast 2021-2033
- 5.1. Market Analysis, Insights and Forecast - by Type of Sequencing
- 5.1.1. Whole Genome Sequencing
- 5.1.2. Targeted Resequencing
- 5.1.3. Whole Exome Sequencing
- 5.1.4. RNA Sequencing
- 5.1.5. CHIP Sequencing
- 5.1.6. De Novo Sequencing
- 5.1.7. Methyl Sequencing
- 5.2. Market Analysis, Insights and Forecast - by Product Type
- 5.2.1. Instruments
- 5.2.2. Reagents and Consumables
- 5.2.3. Services
- 5.3. Market Analysis, Insights and Forecast - by End-User
- 5.3.1. Hospitals and Healthcare Institutions
- 5.3.2. Academics
- 5.3.3. Pharmaceutical and Biotechnology Companies
- 5.4. Market Analysis, Insights and Forecast - by Application
- 5.4.1. Drug Discovery and Personalized Medicine
- 5.4.2. Genetic Screening
- 5.4.3. Diagnostics
- 5.4.4. Agriculture and Animal Research
- 5.4.5. Other Applications
- 5.5. Market Analysis, Insights and Forecast - by Region
- 5.5.1. North America
- 5.5.2. Europe
- 5.5.3. Asia Pacific
- 5.5.4. Middle East and Africa
- 5.5.5. South America
- 5.1. Market Analysis, Insights and Forecast - by Type of Sequencing
- 6. Global Next-Generation Sequencing Services Market Analysis, Insights and Forecast, 2021-2033
- 6.1. Market Analysis, Insights and Forecast - by Type of Sequencing
- 6.1.1. Whole Genome Sequencing
- 6.1.2. Targeted Resequencing
- 6.1.3. Whole Exome Sequencing
- 6.1.4. RNA Sequencing
- 6.1.5. CHIP Sequencing
- 6.1.6. De Novo Sequencing
- 6.1.7. Methyl Sequencing
- 6.2. Market Analysis, Insights and Forecast - by Product Type
- 6.2.1. Instruments
- 6.2.2. Reagents and Consumables
- 6.2.3. Services
- 6.3. Market Analysis, Insights and Forecast - by End-User
- 6.3.1. Hospitals and Healthcare Institutions
- 6.3.2. Academics
- 6.3.3. Pharmaceutical and Biotechnology Companies
- 6.4. Market Analysis, Insights and Forecast - by Application
- 6.4.1. Drug Discovery and Personalized Medicine
- 6.4.2. Genetic Screening
- 6.4.3. Diagnostics
- 6.4.4. Agriculture and Animal Research
- 6.4.5. Other Applications
- 6.1. Market Analysis, Insights and Forecast - by Type of Sequencing
- 7. North America Next-Generation Sequencing Services Market Analysis, Insights and Forecast, 2021-2033
- 7.1. Market Analysis, Insights and Forecast - by Type of Sequencing
- 7.1.1. Whole Genome Sequencing
- 7.1.2. Targeted Resequencing
- 7.1.3. Whole Exome Sequencing
- 7.1.4. RNA Sequencing
- 7.1.5. CHIP Sequencing
- 7.1.6. De Novo Sequencing
- 7.1.7. Methyl Sequencing
- 7.2. Market Analysis, Insights and Forecast - by Product Type
- 7.2.1. Instruments
- 7.2.2. Reagents and Consumables
- 7.2.3. Services
- 7.3. Market Analysis, Insights and Forecast - by End-User
- 7.3.1. Hospitals and Healthcare Institutions
- 7.3.2. Academics
- 7.3.3. Pharmaceutical and Biotechnology Companies
- 7.4. Market Analysis, Insights and Forecast - by Application
- 7.4.1. Drug Discovery and Personalized Medicine
- 7.4.2. Genetic Screening
- 7.4.3. Diagnostics
- 7.4.4. Agriculture and Animal Research
- 7.4.5. Other Applications
- 7.1. Market Analysis, Insights and Forecast - by Type of Sequencing
- 8. Europe Next-Generation Sequencing Services Market Analysis, Insights and Forecast, 2021-2033
- 8.1. Market Analysis, Insights and Forecast - by Type of Sequencing
- 8.1.1. Whole Genome Sequencing
- 8.1.2. Targeted Resequencing
- 8.1.3. Whole Exome Sequencing
- 8.1.4. RNA Sequencing
- 8.1.5. CHIP Sequencing
- 8.1.6. De Novo Sequencing
- 8.1.7. Methyl Sequencing
- 8.2. Market Analysis, Insights and Forecast - by Product Type
- 8.2.1. Instruments
- 8.2.2. Reagents and Consumables
- 8.2.3. Services
- 8.3. Market Analysis, Insights and Forecast - by End-User
- 8.3.1. Hospitals and Healthcare Institutions
- 8.3.2. Academics
- 8.3.3. Pharmaceutical and Biotechnology Companies
- 8.4. Market Analysis, Insights and Forecast - by Application
- 8.4.1. Drug Discovery and Personalized Medicine
- 8.4.2. Genetic Screening
- 8.4.3. Diagnostics
- 8.4.4. Agriculture and Animal Research
- 8.4.5. Other Applications
- 8.1. Market Analysis, Insights and Forecast - by Type of Sequencing
- 9. Asia Pacific Next-Generation Sequencing Services Market Analysis, Insights and Forecast, 2021-2033
- 9.1. Market Analysis, Insights and Forecast - by Type of Sequencing
- 9.1.1. Whole Genome Sequencing
- 9.1.2. Targeted Resequencing
- 9.1.3. Whole Exome Sequencing
- 9.1.4. RNA Sequencing
- 9.1.5. CHIP Sequencing
- 9.1.6. De Novo Sequencing
- 9.1.7. Methyl Sequencing
- 9.2. Market Analysis, Insights and Forecast - by Product Type
- 9.2.1. Instruments
- 9.2.2. Reagents and Consumables
- 9.2.3. Services
- 9.3. Market Analysis, Insights and Forecast - by End-User
- 9.3.1. Hospitals and Healthcare Institutions
- 9.3.2. Academics
- 9.3.3. Pharmaceutical and Biotechnology Companies
- 9.4. Market Analysis, Insights and Forecast - by Application
- 9.4.1. Drug Discovery and Personalized Medicine
- 9.4.2. Genetic Screening
- 9.4.3. Diagnostics
- 9.4.4. Agriculture and Animal Research
- 9.4.5. Other Applications
- 9.1. Market Analysis, Insights and Forecast - by Type of Sequencing
- 10. Middle East and Africa Next-Generation Sequencing Services Market Analysis, Insights and Forecast, 2021-2033
- 10.1. Market Analysis, Insights and Forecast - by Type of Sequencing
- 10.1.1. Whole Genome Sequencing
- 10.1.2. Targeted Resequencing
- 10.1.3. Whole Exome Sequencing
- 10.1.4. RNA Sequencing
- 10.1.5. CHIP Sequencing
- 10.1.6. De Novo Sequencing
- 10.1.7. Methyl Sequencing
- 10.2. Market Analysis, Insights and Forecast - by Product Type
- 10.2.1. Instruments
- 10.2.2. Reagents and Consumables
- 10.2.3. Services
- 10.3. Market Analysis, Insights and Forecast - by End-User
- 10.3.1. Hospitals and Healthcare Institutions
- 10.3.2. Academics
- 10.3.3. Pharmaceutical and Biotechnology Companies
- 10.4. Market Analysis, Insights and Forecast - by Application
- 10.4.1. Drug Discovery and Personalized Medicine
- 10.4.2. Genetic Screening
- 10.4.3. Diagnostics
- 10.4.4. Agriculture and Animal Research
- 10.4.5. Other Applications
- 10.1. Market Analysis, Insights and Forecast - by Type of Sequencing
- 11. South America Next-Generation Sequencing Services Market Analysis, Insights and Forecast, 2021-2033
- 11.1. Market Analysis, Insights and Forecast - by Type of Sequencing
- 11.1.1. Whole Genome Sequencing
- 11.1.2. Targeted Resequencing
- 11.1.3. Whole Exome Sequencing
- 11.1.4. RNA Sequencing
- 11.1.5. CHIP Sequencing
- 11.1.6. De Novo Sequencing
- 11.1.7. Methyl Sequencing
- 11.2. Market Analysis, Insights and Forecast - by Product Type
- 11.2.1. Instruments
- 11.2.2. Reagents and Consumables
- 11.2.3. Services
- 11.3. Market Analysis, Insights and Forecast - by End-User
- 11.3.1. Hospitals and Healthcare Institutions
- 11.3.2. Academics
- 11.3.3. Pharmaceutical and Biotechnology Companies
- 11.4. Market Analysis, Insights and Forecast - by Application
- 11.4.1. Drug Discovery and Personalized Medicine
- 11.4.2. Genetic Screening
- 11.4.3. Diagnostics
- 11.4.4. Agriculture and Animal Research
- 11.4.5. Other Applications
- 11.1. Market Analysis, Insights and Forecast - by Type of Sequencing
- 12. Competitive Analysis
- 12.1. Company Profiles
- 12.1.1 DNASTAR Inc
- 12.1.1.1. Company Overview
- 12.1.1.2. Products
- 12.1.1.3. Company Financials
- 12.1.1.4. SWOT Analysis
- 12.1.2 Bio-Rad Laboratories Inc
- 12.1.2.1. Company Overview
- 12.1.2.2. Products
- 12.1.2.3. Company Financials
- 12.1.2.4. SWOT Analysis
- 12.1.3 F Hoffmann-La Roche Ltd
- 12.1.3.1. Company Overview
- 12.1.3.2. Products
- 12.1.3.3. Company Financials
- 12.1.3.4. SWOT Analysis
- 12.1.4 Eurofins Scientific
- 12.1.4.1. Company Overview
- 12.1.4.2. Products
- 12.1.4.3. Company Financials
- 12.1.4.4. SWOT Analysis
- 12.1.5 Macrogen Inc
- 12.1.5.1. Company Overview
- 12.1.5.2. Products
- 12.1.5.3. Company Financials
- 12.1.5.4. SWOT Analysis
- 12.1.6 Thermo Fisher Scientific Inc
- 12.1.6.1. Company Overview
- 12.1.6.2. Products
- 12.1.6.3. Company Financials
- 12.1.6.4. SWOT Analysis
- 12.1.7 Qiagen
- 12.1.7.1. Company Overview
- 12.1.7.2. Products
- 12.1.7.3. Company Financials
- 12.1.7.4. SWOT Analysis
- 12.1.8 PerkinElmer Inc
- 12.1.8.1. Company Overview
- 12.1.8.2. Products
- 12.1.8.3. Company Financials
- 12.1.8.4. SWOT Analysis
- 12.1.9 Illumina Inc
- 12.1.9.1. Company Overview
- 12.1.9.2. Products
- 12.1.9.3. Company Financials
- 12.1.9.4. SWOT Analysis
- 12.1.10 Pacific Biosciences of California Inc
- 12.1.10.1. Company Overview
- 12.1.10.2. Products
- 12.1.10.3. Company Financials
- 12.1.10.4. SWOT Analysis
- 12.1.11 CD Genomics
- 12.1.11.1. Company Overview
- 12.1.11.2. Products
- 12.1.11.3. Company Financials
- 12.1.11.4. SWOT Analysis
- 12.1.12 Agilent Technologies
- 12.1.12.1. Company Overview
- 12.1.12.2. Products
- 12.1.12.3. Company Financials
- 12.1.12.4. SWOT Analysis
- 12.1.1 DNASTAR Inc
- 12.2. Market Entropy
- 12.2.1 Company's Key Areas Served
- 12.2.2 Recent Developments
- 12.3. Company Market Share Analysis 2025
- 12.3.1 Top 5 Companies Market Share Analysis
- 12.3.2 Top 3 Companies Market Share Analysis
- 12.4. List of Potential Customers
- 13. Research Methodology
List of Figures
- Figure 1: Global Next-Generation Sequencing Services Market Revenue Breakdown (Million, %) by Region 2025 & 2033
- Figure 2: Global Next-Generation Sequencing Services Market Volume Breakdown (K Units, %) by Region 2025 & 2033
- Figure 3: North America Next-Generation Sequencing Services Market Revenue (Million), by Type of Sequencing 2025 & 2033
- Figure 4: North America Next-Generation Sequencing Services Market Volume (K Units), by Type of Sequencing 2025 & 2033
- Figure 5: North America Next-Generation Sequencing Services Market Revenue Share (%), by Type of Sequencing 2025 & 2033
- Figure 6: North America Next-Generation Sequencing Services Market Volume Share (%), by Type of Sequencing 2025 & 2033
- Figure 7: North America Next-Generation Sequencing Services Market Revenue (Million), by Product Type 2025 & 2033
- Figure 8: North America Next-Generation Sequencing Services Market Volume (K Units), by Product Type 2025 & 2033
- Figure 9: North America Next-Generation Sequencing Services Market Revenue Share (%), by Product Type 2025 & 2033
- Figure 10: North America Next-Generation Sequencing Services Market Volume Share (%), by Product Type 2025 & 2033
- Figure 11: North America Next-Generation Sequencing Services Market Revenue (Million), by End-User 2025 & 2033
- Figure 12: North America Next-Generation Sequencing Services Market Volume (K Units), by End-User 2025 & 2033
- Figure 13: North America Next-Generation Sequencing Services Market Revenue Share (%), by End-User 2025 & 2033
- Figure 14: North America Next-Generation Sequencing Services Market Volume Share (%), by End-User 2025 & 2033
- Figure 15: North America Next-Generation Sequencing Services Market Revenue (Million), by Application 2025 & 2033
- Figure 16: North America Next-Generation Sequencing Services Market Volume (K Units), by Application 2025 & 2033
- Figure 17: North America Next-Generation Sequencing Services Market Revenue Share (%), by Application 2025 & 2033
- Figure 18: North America Next-Generation Sequencing Services Market Volume Share (%), by Application 2025 & 2033
- Figure 19: North America Next-Generation Sequencing Services Market Revenue (Million), by Country 2025 & 2033
- Figure 20: North America Next-Generation Sequencing Services Market Volume (K Units), by Country 2025 & 2033
- Figure 21: North America Next-Generation Sequencing Services Market Revenue Share (%), by Country 2025 & 2033
- Figure 22: North America Next-Generation Sequencing Services Market Volume Share (%), by Country 2025 & 2033
- Figure 23: Europe Next-Generation Sequencing Services Market Revenue (Million), by Type of Sequencing 2025 & 2033
- Figure 24: Europe Next-Generation Sequencing Services Market Volume (K Units), by Type of Sequencing 2025 & 2033
- Figure 25: Europe Next-Generation Sequencing Services Market Revenue Share (%), by Type of Sequencing 2025 & 2033
- Figure 26: Europe Next-Generation Sequencing Services Market Volume Share (%), by Type of Sequencing 2025 & 2033
- Figure 27: Europe Next-Generation Sequencing Services Market Revenue (Million), by Product Type 2025 & 2033
- Figure 28: Europe Next-Generation Sequencing Services Market Volume (K Units), by Product Type 2025 & 2033
- Figure 29: Europe Next-Generation Sequencing Services Market Revenue Share (%), by Product Type 2025 & 2033
- Figure 30: Europe Next-Generation Sequencing Services Market Volume Share (%), by Product Type 2025 & 2033
- Figure 31: Europe Next-Generation Sequencing Services Market Revenue (Million), by End-User 2025 & 2033
- Figure 32: Europe Next-Generation Sequencing Services Market Volume (K Units), by End-User 2025 & 2033
- Figure 33: Europe Next-Generation Sequencing Services Market Revenue Share (%), by End-User 2025 & 2033
- Figure 34: Europe Next-Generation Sequencing Services Market Volume Share (%), by End-User 2025 & 2033
- Figure 35: Europe Next-Generation Sequencing Services Market Revenue (Million), by Application 2025 & 2033
- Figure 36: Europe Next-Generation Sequencing Services Market Volume (K Units), by Application 2025 & 2033
- Figure 37: Europe Next-Generation Sequencing Services Market Revenue Share (%), by Application 2025 & 2033
- Figure 38: Europe Next-Generation Sequencing Services Market Volume Share (%), by Application 2025 & 2033
- Figure 39: Europe Next-Generation Sequencing Services Market Revenue (Million), by Country 2025 & 2033
- Figure 40: Europe Next-Generation Sequencing Services Market Volume (K Units), by Country 2025 & 2033
- Figure 41: Europe Next-Generation Sequencing Services Market Revenue Share (%), by Country 2025 & 2033
- Figure 42: Europe Next-Generation Sequencing Services Market Volume Share (%), by Country 2025 & 2033
- Figure 43: Asia Pacific Next-Generation Sequencing Services Market Revenue (Million), by Type of Sequencing 2025 & 2033
- Figure 44: Asia Pacific Next-Generation Sequencing Services Market Volume (K Units), by Type of Sequencing 2025 & 2033
- Figure 45: Asia Pacific Next-Generation Sequencing Services Market Revenue Share (%), by Type of Sequencing 2025 & 2033
- Figure 46: Asia Pacific Next-Generation Sequencing Services Market Volume Share (%), by Type of Sequencing 2025 & 2033
- Figure 47: Asia Pacific Next-Generation Sequencing Services Market Revenue (Million), by Product Type 2025 & 2033
- Figure 48: Asia Pacific Next-Generation Sequencing Services Market Volume (K Units), by Product Type 2025 & 2033
- Figure 49: Asia Pacific Next-Generation Sequencing Services Market Revenue Share (%), by Product Type 2025 & 2033
- Figure 50: Asia Pacific Next-Generation Sequencing Services Market Volume Share (%), by Product Type 2025 & 2033
- Figure 51: Asia Pacific Next-Generation Sequencing Services Market Revenue (Million), by End-User 2025 & 2033
- Figure 52: Asia Pacific Next-Generation Sequencing Services Market Volume (K Units), by End-User 2025 & 2033
- Figure 53: Asia Pacific Next-Generation Sequencing Services Market Revenue Share (%), by End-User 2025 & 2033
- Figure 54: Asia Pacific Next-Generation Sequencing Services Market Volume Share (%), by End-User 2025 & 2033
- Figure 55: Asia Pacific Next-Generation Sequencing Services Market Revenue (Million), by Application 2025 & 2033
- Figure 56: Asia Pacific Next-Generation Sequencing Services Market Volume (K Units), by Application 2025 & 2033
- Figure 57: Asia Pacific Next-Generation Sequencing Services Market Revenue Share (%), by Application 2025 & 2033
- Figure 58: Asia Pacific Next-Generation Sequencing Services Market Volume Share (%), by Application 2025 & 2033
- Figure 59: Asia Pacific Next-Generation Sequencing Services Market Revenue (Million), by Country 2025 & 2033
- Figure 60: Asia Pacific Next-Generation Sequencing Services Market Volume (K Units), by Country 2025 & 2033
- Figure 61: Asia Pacific Next-Generation Sequencing Services Market Revenue Share (%), by Country 2025 & 2033
- Figure 62: Asia Pacific Next-Generation Sequencing Services Market Volume Share (%), by Country 2025 & 2033
- Figure 63: Middle East and Africa Next-Generation Sequencing Services Market Revenue (Million), by Type of Sequencing 2025 & 2033
- Figure 64: Middle East and Africa Next-Generation Sequencing Services Market Volume (K Units), by Type of Sequencing 2025 & 2033
- Figure 65: Middle East and Africa Next-Generation Sequencing Services Market Revenue Share (%), by Type of Sequencing 2025 & 2033
- Figure 66: Middle East and Africa Next-Generation Sequencing Services Market Volume Share (%), by Type of Sequencing 2025 & 2033
- Figure 67: Middle East and Africa Next-Generation Sequencing Services Market Revenue (Million), by Product Type 2025 & 2033
- Figure 68: Middle East and Africa Next-Generation Sequencing Services Market Volume (K Units), by Product Type 2025 & 2033
- Figure 69: Middle East and Africa Next-Generation Sequencing Services Market Revenue Share (%), by Product Type 2025 & 2033
- Figure 70: Middle East and Africa Next-Generation Sequencing Services Market Volume Share (%), by Product Type 2025 & 2033
- Figure 71: Middle East and Africa Next-Generation Sequencing Services Market Revenue (Million), by End-User 2025 & 2033
- Figure 72: Middle East and Africa Next-Generation Sequencing Services Market Volume (K Units), by End-User 2025 & 2033
- Figure 73: Middle East and Africa Next-Generation Sequencing Services Market Revenue Share (%), by End-User 2025 & 2033
- Figure 74: Middle East and Africa Next-Generation Sequencing Services Market Volume Share (%), by End-User 2025 & 2033
- Figure 75: Middle East and Africa Next-Generation Sequencing Services Market Revenue (Million), by Application 2025 & 2033
- Figure 76: Middle East and Africa Next-Generation Sequencing Services Market Volume (K Units), by Application 2025 & 2033
- Figure 77: Middle East and Africa Next-Generation Sequencing Services Market Revenue Share (%), by Application 2025 & 2033
- Figure 78: Middle East and Africa Next-Generation Sequencing Services Market Volume Share (%), by Application 2025 & 2033
- Figure 79: Middle East and Africa Next-Generation Sequencing Services Market Revenue (Million), by Country 2025 & 2033
- Figure 80: Middle East and Africa Next-Generation Sequencing Services Market Volume (K Units), by Country 2025 & 2033
- Figure 81: Middle East and Africa Next-Generation Sequencing Services Market Revenue Share (%), by Country 2025 & 2033
- Figure 82: Middle East and Africa Next-Generation Sequencing Services Market Volume Share (%), by Country 2025 & 2033
- Figure 83: South America Next-Generation Sequencing Services Market Revenue (Million), by Type of Sequencing 2025 & 2033
- Figure 84: South America Next-Generation Sequencing Services Market Volume (K Units), by Type of Sequencing 2025 & 2033
- Figure 85: South America Next-Generation Sequencing Services Market Revenue Share (%), by Type of Sequencing 2025 & 2033
- Figure 86: South America Next-Generation Sequencing Services Market Volume Share (%), by Type of Sequencing 2025 & 2033
- Figure 87: South America Next-Generation Sequencing Services Market Revenue (Million), by Product Type 2025 & 2033
- Figure 88: South America Next-Generation Sequencing Services Market Volume (K Units), by Product Type 2025 & 2033
- Figure 89: South America Next-Generation Sequencing Services Market Revenue Share (%), by Product Type 2025 & 2033
- Figure 90: South America Next-Generation Sequencing Services Market Volume Share (%), by Product Type 2025 & 2033
- Figure 91: South America Next-Generation Sequencing Services Market Revenue (Million), by End-User 2025 & 2033
- Figure 92: South America Next-Generation Sequencing Services Market Volume (K Units), by End-User 2025 & 2033
- Figure 93: South America Next-Generation Sequencing Services Market Revenue Share (%), by End-User 2025 & 2033
- Figure 94: South America Next-Generation Sequencing Services Market Volume Share (%), by End-User 2025 & 2033
- Figure 95: South America Next-Generation Sequencing Services Market Revenue (Million), by Application 2025 & 2033
- Figure 96: South America Next-Generation Sequencing Services Market Volume (K Units), by Application 2025 & 2033
- Figure 97: South America Next-Generation Sequencing Services Market Revenue Share (%), by Application 2025 & 2033
- Figure 98: South America Next-Generation Sequencing Services Market Volume Share (%), by Application 2025 & 2033
- Figure 99: South America Next-Generation Sequencing Services Market Revenue (Million), by Country 2025 & 2033
- Figure 100: South America Next-Generation Sequencing Services Market Volume (K Units), by Country 2025 & 2033
- Figure 101: South America Next-Generation Sequencing Services Market Revenue Share (%), by Country 2025 & 2033
- Figure 102: South America Next-Generation Sequencing Services Market Volume Share (%), by Country 2025 & 2033
List of Tables
- Table 1: Global Next-Generation Sequencing Services Market Revenue Million Forecast, by Type of Sequencing 2020 & 2033
- Table 2: Global Next-Generation Sequencing Services Market Volume K Units Forecast, by Type of Sequencing 2020 & 2033
- Table 3: Global Next-Generation Sequencing Services Market Revenue Million Forecast, by Product Type 2020 & 2033
- Table 4: Global Next-Generation Sequencing Services Market Volume K Units Forecast, by Product Type 2020 & 2033
- Table 5: Global Next-Generation Sequencing Services Market Revenue Million Forecast, by End-User 2020 & 2033
- Table 6: Global Next-Generation Sequencing Services Market Volume K Units Forecast, by End-User 2020 & 2033
- Table 7: Global Next-Generation Sequencing Services Market Revenue Million Forecast, by Application 2020 & 2033
- Table 8: Global Next-Generation Sequencing Services Market Volume K Units Forecast, by Application 2020 & 2033
- Table 9: Global Next-Generation Sequencing Services Market Revenue Million Forecast, by Region 2020 & 2033
- Table 10: Global Next-Generation Sequencing Services Market Volume K Units Forecast, by Region 2020 & 2033
- Table 11: Global Next-Generation Sequencing Services Market Revenue Million Forecast, by Type of Sequencing 2020 & 2033
- Table 12: Global Next-Generation Sequencing Services Market Volume K Units Forecast, by Type of Sequencing 2020 & 2033
- Table 13: Global Next-Generation Sequencing Services Market Revenue Million Forecast, by Product Type 2020 & 2033
- Table 14: Global Next-Generation Sequencing Services Market Volume K Units Forecast, by Product Type 2020 & 2033
- Table 15: Global Next-Generation Sequencing Services Market Revenue Million Forecast, by End-User 2020 & 2033
- Table 16: Global Next-Generation Sequencing Services Market Volume K Units Forecast, by End-User 2020 & 2033
- Table 17: Global Next-Generation Sequencing Services Market Revenue Million Forecast, by Application 2020 & 2033
- Table 18: Global Next-Generation Sequencing Services Market Volume K Units Forecast, by Application 2020 & 2033
- Table 19: Global Next-Generation Sequencing Services Market Revenue Million Forecast, by Country 2020 & 2033
- Table 20: Global Next-Generation Sequencing Services Market Volume K Units Forecast, by Country 2020 & 2033
- Table 21: United States Next-Generation Sequencing Services Market Revenue (Million) Forecast, by Application 2020 & 2033
- Table 22: United States Next-Generation Sequencing Services Market Volume (K Units) Forecast, by Application 2020 & 2033
- Table 23: Canada Next-Generation Sequencing Services Market Revenue (Million) Forecast, by Application 2020 & 2033
- Table 24: Canada Next-Generation Sequencing Services Market Volume (K Units) Forecast, by Application 2020 & 2033
- Table 25: Mexico Next-Generation Sequencing Services Market Revenue (Million) Forecast, by Application 2020 & 2033
- Table 26: Mexico Next-Generation Sequencing Services Market Volume (K Units) Forecast, by Application 2020 & 2033
- Table 27: Global Next-Generation Sequencing Services Market Revenue Million Forecast, by Type of Sequencing 2020 & 2033
- Table 28: Global Next-Generation Sequencing Services Market Volume K Units Forecast, by Type of Sequencing 2020 & 2033
- Table 29: Global Next-Generation Sequencing Services Market Revenue Million Forecast, by Product Type 2020 & 2033
- Table 30: Global Next-Generation Sequencing Services Market Volume K Units Forecast, by Product Type 2020 & 2033
- Table 31: Global Next-Generation Sequencing Services Market Revenue Million Forecast, by End-User 2020 & 2033
- Table 32: Global Next-Generation Sequencing Services Market Volume K Units Forecast, by End-User 2020 & 2033
- Table 33: Global Next-Generation Sequencing Services Market Revenue Million Forecast, by Application 2020 & 2033
- Table 34: Global Next-Generation Sequencing Services Market Volume K Units Forecast, by Application 2020 & 2033
- Table 35: Global Next-Generation Sequencing Services Market Revenue Million Forecast, by Country 2020 & 2033
- Table 36: Global Next-Generation Sequencing Services Market Volume K Units Forecast, by Country 2020 & 2033
- Table 37: Germany Next-Generation Sequencing Services Market Revenue (Million) Forecast, by Application 2020 & 2033
- Table 38: Germany Next-Generation Sequencing Services Market Volume (K Units) Forecast, by Application 2020 & 2033
- Table 39: United Kingdom Next-Generation Sequencing Services Market Revenue (Million) Forecast, by Application 2020 & 2033
- Table 40: United Kingdom Next-Generation Sequencing Services Market Volume (K Units) Forecast, by Application 2020 & 2033
- Table 41: France Next-Generation Sequencing Services Market Revenue (Million) Forecast, by Application 2020 & 2033
- Table 42: France Next-Generation Sequencing Services Market Volume (K Units) Forecast, by Application 2020 & 2033
- Table 43: Italy Next-Generation Sequencing Services Market Revenue (Million) Forecast, by Application 2020 & 2033
- Table 44: Italy Next-Generation Sequencing Services Market Volume (K Units) Forecast, by Application 2020 & 2033
- Table 45: Spain Next-Generation Sequencing Services Market Revenue (Million) Forecast, by Application 2020 & 2033
- Table 46: Spain Next-Generation Sequencing Services Market Volume (K Units) Forecast, by Application 2020 & 2033
- Table 47: Rest of Europe Next-Generation Sequencing Services Market Revenue (Million) Forecast, by Application 2020 & 2033
- Table 48: Rest of Europe Next-Generation Sequencing Services Market Volume (K Units) Forecast, by Application 2020 & 2033
- Table 49: Global Next-Generation Sequencing Services Market Revenue Million Forecast, by Type of Sequencing 2020 & 2033
- Table 50: Global Next-Generation Sequencing Services Market Volume K Units Forecast, by Type of Sequencing 2020 & 2033
- Table 51: Global Next-Generation Sequencing Services Market Revenue Million Forecast, by Product Type 2020 & 2033
- Table 52: Global Next-Generation Sequencing Services Market Volume K Units Forecast, by Product Type 2020 & 2033
- Table 53: Global Next-Generation Sequencing Services Market Revenue Million Forecast, by End-User 2020 & 2033
- Table 54: Global Next-Generation Sequencing Services Market Volume K Units Forecast, by End-User 2020 & 2033
- Table 55: Global Next-Generation Sequencing Services Market Revenue Million Forecast, by Application 2020 & 2033
- Table 56: Global Next-Generation Sequencing Services Market Volume K Units Forecast, by Application 2020 & 2033
- Table 57: Global Next-Generation Sequencing Services Market Revenue Million Forecast, by Country 2020 & 2033
- Table 58: Global Next-Generation Sequencing Services Market Volume K Units Forecast, by Country 2020 & 2033
- Table 59: China Next-Generation Sequencing Services Market Revenue (Million) Forecast, by Application 2020 & 2033
- Table 60: China Next-Generation Sequencing Services Market Volume (K Units) Forecast, by Application 2020 & 2033
- Table 61: Japan Next-Generation Sequencing Services Market Revenue (Million) Forecast, by Application 2020 & 2033
- Table 62: Japan Next-Generation Sequencing Services Market Volume (K Units) Forecast, by Application 2020 & 2033
- Table 63: India Next-Generation Sequencing Services Market Revenue (Million) Forecast, by Application 2020 & 2033
- Table 64: India Next-Generation Sequencing Services Market Volume (K Units) Forecast, by Application 2020 & 2033
- Table 65: Australia Next-Generation Sequencing Services Market Revenue (Million) Forecast, by Application 2020 & 2033
- Table 66: Australia Next-Generation Sequencing Services Market Volume (K Units) Forecast, by Application 2020 & 2033
- Table 67: South Korea Next-Generation Sequencing Services Market Revenue (Million) Forecast, by Application 2020 & 2033
- Table 68: South Korea Next-Generation Sequencing Services Market Volume (K Units) Forecast, by Application 2020 & 2033
- Table 69: Rest of Asia Pacific Next-Generation Sequencing Services Market Revenue (Million) Forecast, by Application 2020 & 2033
- Table 70: Rest of Asia Pacific Next-Generation Sequencing Services Market Volume (K Units) Forecast, by Application 2020 & 2033
- Table 71: Global Next-Generation Sequencing Services Market Revenue Million Forecast, by Type of Sequencing 2020 & 2033
- Table 72: Global Next-Generation Sequencing Services Market Volume K Units Forecast, by Type of Sequencing 2020 & 2033
- Table 73: Global Next-Generation Sequencing Services Market Revenue Million Forecast, by Product Type 2020 & 2033
- Table 74: Global Next-Generation Sequencing Services Market Volume K Units Forecast, by Product Type 2020 & 2033
- Table 75: Global Next-Generation Sequencing Services Market Revenue Million Forecast, by End-User 2020 & 2033
- Table 76: Global Next-Generation Sequencing Services Market Volume K Units Forecast, by End-User 2020 & 2033
- Table 77: Global Next-Generation Sequencing Services Market Revenue Million Forecast, by Application 2020 & 2033
- Table 78: Global Next-Generation Sequencing Services Market Volume K Units Forecast, by Application 2020 & 2033
- Table 79: Global Next-Generation Sequencing Services Market Revenue Million Forecast, by Country 2020 & 2033
- Table 80: Global Next-Generation Sequencing Services Market Volume K Units Forecast, by Country 2020 & 2033
- Table 81: GCC Next-Generation Sequencing Services Market Revenue (Million) Forecast, by Application 2020 & 2033
- Table 82: GCC Next-Generation Sequencing Services Market Volume (K Units) Forecast, by Application 2020 & 2033
- Table 83: South Africa Next-Generation Sequencing Services Market Revenue (Million) Forecast, by Application 2020 & 2033
- Table 84: South Africa Next-Generation Sequencing Services Market Volume (K Units) Forecast, by Application 2020 & 2033
- Table 85: Rest of Middle East and Africa Next-Generation Sequencing Services Market Revenue (Million) Forecast, by Application 2020 & 2033
- Table 86: Rest of Middle East and Africa Next-Generation Sequencing Services Market Volume (K Units) Forecast, by Application 2020 & 2033
- Table 87: Global Next-Generation Sequencing Services Market Revenue Million Forecast, by Type of Sequencing 2020 & 2033
- Table 88: Global Next-Generation Sequencing Services Market Volume K Units Forecast, by Type of Sequencing 2020 & 2033
- Table 89: Global Next-Generation Sequencing Services Market Revenue Million Forecast, by Product Type 2020 & 2033
- Table 90: Global Next-Generation Sequencing Services Market Volume K Units Forecast, by Product Type 2020 & 2033
- Table 91: Global Next-Generation Sequencing Services Market Revenue Million Forecast, by End-User 2020 & 2033
- Table 92: Global Next-Generation Sequencing Services Market Volume K Units Forecast, by End-User 2020 & 2033
- Table 93: Global Next-Generation Sequencing Services Market Revenue Million Forecast, by Application 2020 & 2033
- Table 94: Global Next-Generation Sequencing Services Market Volume K Units Forecast, by Application 2020 & 2033
- Table 95: Global Next-Generation Sequencing Services Market Revenue Million Forecast, by Country 2020 & 2033
- Table 96: Global Next-Generation Sequencing Services Market Volume K Units Forecast, by Country 2020 & 2033
- Table 97: Brazil Next-Generation Sequencing Services Market Revenue (Million) Forecast, by Application 2020 & 2033
- Table 98: Brazil Next-Generation Sequencing Services Market Volume (K Units) Forecast, by Application 2020 & 2033
- Table 99: Argentina Next-Generation Sequencing Services Market Revenue (Million) Forecast, by Application 2020 & 2033
- Table 100: Argentina Next-Generation Sequencing Services Market Volume (K Units) Forecast, by Application 2020 & 2033
- Table 101: Rest of South America Next-Generation Sequencing Services Market Revenue (Million) Forecast, by Application 2020 & 2033
- Table 102: Rest of South America Next-Generation Sequencing Services Market Volume (K Units) Forecast, by Application 2020 & 2033
Frequently Asked Questions
1. What is the projected Compound Annual Growth Rate (CAGR) of the Next-Generation Sequencing Services Market?
The projected CAGR is approximately 13.43%.
2. Which companies are prominent players in the Next-Generation Sequencing Services Market?
Key companies in the market include DNASTAR Inc, Bio-Rad Laboratories Inc, F Hoffmann-La Roche Ltd, Eurofins Scientific, Macrogen Inc, Thermo Fisher Scientific Inc, Qiagen, PerkinElmer Inc, Illumina Inc, Pacific Biosciences of California Inc, CD Genomics, Agilent Technologies.
3. What are the main segments of the Next-Generation Sequencing Services Market?
The market segments include Type of Sequencing, Product Type, End-User, Application.
4. Can you provide details about the market size?
The market size is estimated to be USD 10.47 Million as of 2022.
5. What are some drivers contributing to market growth?
Increasing Applications in Clinical Diagnosis and Speed. Cost. and Accuracy; Increasing Efficiency when Compared To Traditional Technologies Such As Microarrays and Rising Drug Discovery Applications.
6. What are the notable trends driving market growth?
The Whole Genome Sequencing Segment is Expected to Grow at a Significant Rate Over the Forecast Period.
7. Are there any restraints impacting market growth?
Legal and Ethical Issues; Interpretation of Complex Data and Lack of Skilled Professionals.
8. Can you provide examples of recent developments in the market?
January 2023: QIAGEN announced a strategic partnership with California-based population genomics leader Helix to advance next-generation sequencing companion diagnostics in hereditary diseases.
9. What pricing options are available for accessing the report?
Pricing options include single-user, multi-user, and enterprise licenses priced at USD 4750, USD 5250, and USD 8750 respectively.
10. Is the market size provided in terms of value or volume?
The market size is provided in terms of value, measured in Million and volume, measured in K Units.
11. Are there any specific market keywords associated with the report?
Yes, the market keyword associated with the report is "Next-Generation Sequencing Services Market," which aids in identifying and referencing the specific market segment covered.
12. How do I determine which pricing option suits my needs best?
The pricing options vary based on user requirements and access needs. Individual users may opt for single-user licenses, while businesses requiring broader access may choose multi-user or enterprise licenses for cost-effective access to the report.
13. Are there any additional resources or data provided in the Next-Generation Sequencing Services Market report?
While the report offers comprehensive insights, it's advisable to review the specific contents or supplementary materials provided to ascertain if additional resources or data are available.
14. How can I stay updated on further developments or reports in the Next-Generation Sequencing Services Market?
To stay informed about further developments, trends, and reports in the Next-Generation Sequencing Services Market, consider subscribing to industry newsletters, following relevant companies and organizations, or regularly checking reputable industry news sources and publications.
Methodology
Step 1 - Identification of Relevant Samples Size from Population Database


Step 2 - Approaches for Defining Global Market Size (Value, Volume* & Price*)

Note*: In applicable scenarios
Step 3 - Data Sources
Primary Research
- Web Analytics
- Survey Reports
- Research Institute
- Latest Research Reports
- Opinion Leaders
Secondary Research
- Annual Reports
- White Paper
- Latest Press Release
- Industry Association
- Paid Database
- Investor Presentations

Step 4 - Data Triangulation
Involves using different sources of information in order to increase the validity of a study
These sources are likely to be stakeholders in a program - participants, other researchers, program staff, other community members, and so on.
Then we put all data in single framework & apply various statistical tools to find out the dynamic on the market.
During the analysis stage, feedback from the stakeholder groups would be compared to determine areas of agreement as well as areas of divergence