

Key Insights
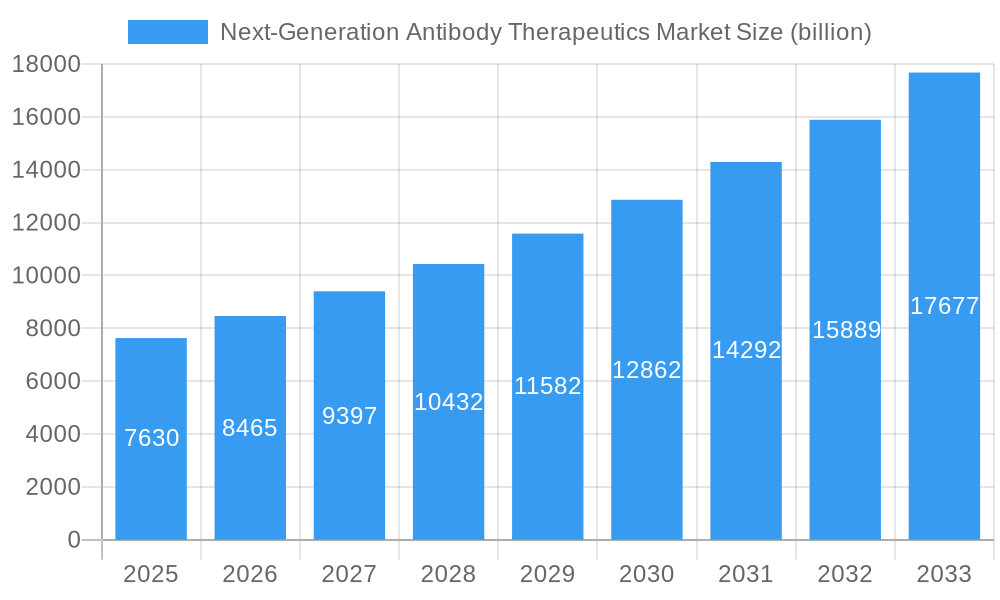
The global Next-Generation Antibody Therapeutics Market is poised for significant expansion, projected to reach an estimated USD 7.63 billion in 2025, driven by a robust CAGR of 10.9% from 2019-2033. This remarkable growth trajectory is fueled by advancements in antibody engineering and a broadening therapeutic landscape. Key drivers include the escalating prevalence of chronic diseases like cancer and autoimmune disorders, necessitating more targeted and effective treatment modalities. The increasing investment in research and development by leading pharmaceutical and biotechnology companies, coupled with favorable regulatory pathways for innovative biologics, further bolsters market optimism. Furthermore, the growing adoption of sophisticated technologies such as Antibody-Drug Conjugates (ADCs), Bispecific Antibodies (BsAbs), and Fc-Engineered Antibodies, which offer enhanced efficacy and reduced off-target effects, are fundamentally reshaping treatment paradigms and contributing to the market's upward momentum. The market's segmentation by therapeutic area, with Oncology and Autoimmune/Inflammatory conditions at the forefront, highlights the critical role these advanced antibodies play in addressing significant unmet medical needs.
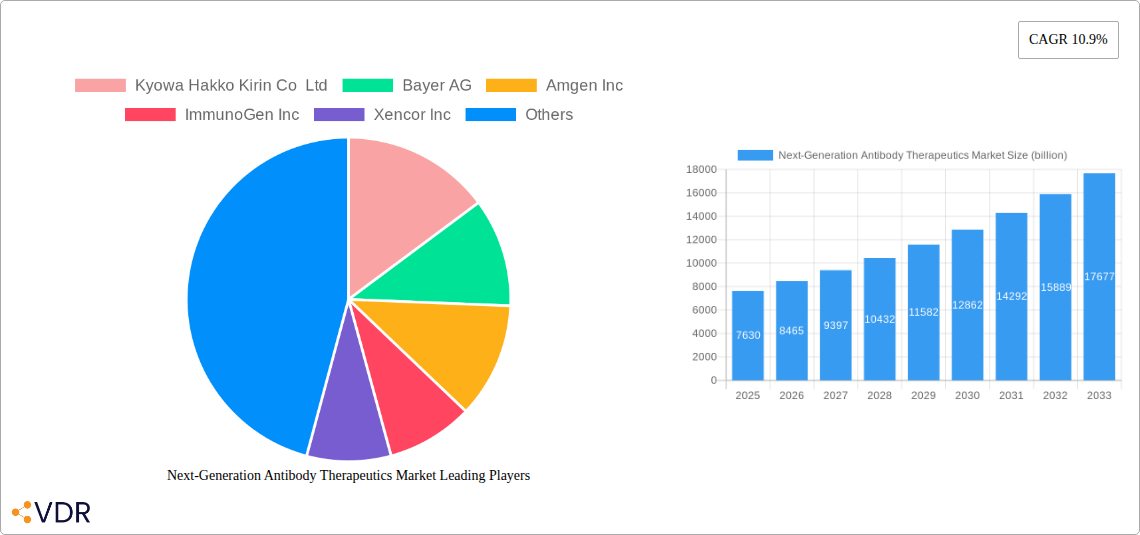
Next-Generation Antibody Therapeutics Market Market Size (In Billion)
The market's expansion is also influenced by emerging trends such as the rise of biosimilar antibody products, which promise to increase accessibility and affordability while maintaining therapeutic equivalence. These developments are particularly impactful in addressing the cost barriers associated with advanced biologics. While the market is characterized by strong growth, potential restraints such as the high cost of development and manufacturing, coupled with complex regulatory hurdles for novel antibody therapies, warrant strategic consideration. Nevertheless, the continuous innovation in antibody platforms, including advancements in antibody discovery and engineering techniques, alongside strategic collaborations and acquisitions among key players like Roche, Amgen, and AstraZeneca, are paving the way for sustained market dominance. The geographic distribution of the market indicates strong footholds in North America and Europe, with Asia Pacific emerging as a significant growth region, driven by increasing healthcare expenditure and a growing patient population.
Next-Generation Antibody Therapeutics Market Company Market Share
Next-Generation Antibody Therapeutics Market: Unlocking Future Therapies
This comprehensive report offers an in-depth analysis of the Next-Generation Antibody Therapeutics Market, providing critical insights into market dynamics, growth trends, and future opportunities. With a focus on advanced antibody technologies and their impact on treating complex diseases, this report is an indispensable resource for pharmaceutical companies, biotech innovators, investors, and healthcare professionals navigating this rapidly evolving sector. The study encompasses a forecast period from 2025 to 2033, with a base year of 2025 and historical data from 2019 to 2024. Explore the market's potential, estimated to reach $XXX billion by 2033, driven by a CAGR of XX.X%.
Next-Generation Antibody Therapeutics Market Dynamics & Structure
The Next-Generation Antibody Therapeutics Market is characterized by a dynamic interplay of technological innovation, stringent regulatory oversight, and robust investor interest. Market concentration is moderately fragmented, with leading players actively engaged in research and development to maintain a competitive edge. Key technological innovation drivers include advancements in protein engineering, targeted delivery systems, and novel therapeutic modalities like bispecific antibodies and antibody-drug conjugates (ADCs). The competitive product landscape features a growing number of biosimilar antibody products, offering cost-effective alternatives and expanding patient access, alongside innovative biologics. End-user demographics are shifting towards an aging global population with a higher prevalence of chronic diseases, fueling demand for advanced therapeutic solutions. Mergers and acquisitions (M&A) are a significant trend, enabling companies to expand their pipelines, acquire novel technologies, and strengthen their market positions. For instance, the Q3 2024 saw X significant M&A deals, totaling $XX billion, reflecting consolidation and strategic growth initiatives. Innovation barriers include the high cost of R&D, lengthy clinical trial durations, and complex manufacturing processes.
- Market Concentration: Moderately fragmented with a mix of large pharmaceutical corporations and emerging biotechnology firms.
- Technological Innovation Drivers: Advancements in antibody engineering, platform technologies, and combinatorial approaches.
- Regulatory Frameworks: Strict oversight by bodies like the FDA and EMA, impacting drug development and approval timelines.
- Competitive Product Substitutes: Growing presence of biosimilar antibody products and alternative therapeutic modalities.
- End-User Demographics: Increasing prevalence of chronic diseases and an aging population driving demand.
- M&A Trends: Active M&A landscape aimed at pipeline expansion and technology acquisition, with an estimated X% increase in deal volume from 2023 to 2024.
Next-Generation Antibody Therapeutics Market Growth Trends & Insights
The Next-Generation Antibody Therapeutics Market is poised for substantial growth, driven by an expanding understanding of disease mechanisms and the development of highly specific and potent therapeutic agents. Market size evolution is projected to witness a significant upward trajectory, from an estimated $XXX billion in 2025 to reach $XXX billion by 2033, exhibiting a compound annual growth rate (CAGR) of XX.X%. Adoption rates of these advanced therapies are accelerating, particularly in oncology and autoimmune diseases, due to their improved efficacy and reduced side effects compared to traditional treatments. Technological disruptions, such as the advent of bispecific antibodies (BsAbs) capable of targeting multiple antigens and the enhanced precision of antibody-drug conjugates (ADCs), are reshaping treatment paradigms. Consumer behavior shifts are also playing a role, with patients and healthcare providers increasingly seeking personalized and targeted treatment options. The market penetration of advanced antibody therapeutics is projected to grow from XX% in 2025 to XX% by 2033. Furthermore, the increasing investment in biologics research and development, coupled with strategic collaborations between pharmaceutical giants and innovative biotech startups, is expected to fuel this expansion. The rising burden of chronic diseases globally, including cancer and inflammatory disorders, creates a sustained demand for effective treatment modalities.
Dominant Regions, Countries, or Segments in Next-Generation Antibody Therapeutics Market
The Next-Generation Antibody Therapeutics Market is witnessing robust growth across various therapeutic areas and technological segments, with Oncology consistently emerging as the dominant therapeutic area. The market share for oncology applications is estimated to be around XX% in 2025, projected to grow to XX% by 2033. This dominance is fueled by the high unmet medical need in cancer treatment, the increasing incidence of various cancer types globally, and the significant success of antibody-based therapies in improving patient outcomes. Key drivers include extensive research and development efforts focused on novel targets, the development of highly effective antibody-drug conjugates (ADCs) and bispecific antibodies (BsAbs) for cancer therapy, and favorable reimbursement policies for innovative oncology treatments.
Within the technology segment, Antibody-Drug Conjugates (ADCs) are experiencing rapid expansion, capturing an estimated XX% of the market share in 2025, with projections to reach XX% by 2033. The increasing sophistication of linker technologies and the development of potent cytotoxic payloads are enhancing the efficacy and safety profiles of ADCs, making them a cornerstone of modern cancer treatment.
Geographically, North America leads the market, accounting for an estimated XX% of the global share in 2025, driven by its advanced healthcare infrastructure, strong R&D capabilities, substantial investment in biotechnology, and a high prevalence of cancer and autoimmune diseases. The United States, in particular, is a hub for innovation and clinical trials.
- Dominant Therapeutic Area: Oncology, driven by high incidence rates and significant unmet needs.
- Key Drivers: Novel target identification, improved efficacy of ADCs and BsAbs, supportive regulatory pathways.
- Market Share (Oncology): Estimated XX% in 2025, growing to XX% by 2033.
- Dominant Technology Segment: Antibody-Drug Conjugates (ADCs), offering targeted cytotoxicity.
- Key Drivers: Advancements in linker technology, potent payloads, successful clinical trial outcomes.
- Market Share (ADCs): Estimated XX% in 2025, growing to XX% by 2033.
- Dominant Region: North America, characterized by strong R&D infrastructure and high healthcare spending.
- Key Drivers: Robust clinical trial ecosystem, significant venture capital funding, early adoption of innovative therapies.
- Market Share (North America): Estimated XX% in 2025.
Next-Generation Antibody Therapeutics Market Product Landscape
The Next-Generation Antibody Therapeutics Market is defined by a burgeoning product landscape characterized by innovative antibody designs and sophisticated drug delivery mechanisms. Product innovations are largely centered around enhancing target specificity, increasing potency, and minimizing off-target effects. Key developments include the refinement of Antibody-Drug Conjugates (ADCs) with novel linker technologies and payloads, enabling more precise tumor cell destruction. Bispecific Antibodies (BsAbs) are also gaining prominence, offering the ability to engage multiple biological targets simultaneously, leading to synergistic therapeutic effects and broader applicability in complex diseases. Fc-engineered antibodies are being developed to optimize pharmacokinetic properties and immune effector functions. Biosimilar antibody products are expanding the market by offering cost-effective alternatives to originator biologics, thereby increasing accessibility for patients globally. The performance metrics of these products are continually improving, with higher response rates, prolonged survival, and improved safety profiles being key differentiators.
Key Drivers, Barriers & Challenges in Next-Generation Antibody Therapeutics Market
Key Drivers:
The Next-Generation Antibody Therapeutics Market is propelled by several significant drivers. Technological advancements in protein engineering, monoclonal antibody development, and conjugation technologies are enabling the creation of more precise and potent therapies. The increasing prevalence of chronic diseases, particularly cancer and autoimmune disorders, creates a substantial and growing demand for effective treatment options. Favorable regulatory pathways for innovative biologics and the growing understanding of disease biology further support market expansion. Significant investments in research and development from both pharmaceutical giants and venture capitalists are fueling innovation and pipeline growth.
Key Barriers & Challenges:
Despite the promising outlook, the market faces considerable barriers and challenges. The high cost of research and development and lengthy clinical trial durations pose significant financial and time-related hurdles. Complex manufacturing processes and stringent quality control requirements contribute to high production costs. Regulatory complexities and the need for rigorous clinical validation can lead to extended approval timelines. Intense competition from established players and emerging biotech companies, as well as the threat of biosimilar erosion, necessitate continuous innovation and strategic positioning. Supply chain vulnerabilities, especially for specialized raw materials and manufacturing capacity, can also impact market stability.
Emerging Opportunities in Next-Generation Antibody Therapeutics Market
Emerging opportunities in the Next-Generation Antibody Therapeutics Market are multifaceted, stemming from advancements in scientific understanding and unmet medical needs. The development of novel antibody formats, such as trispecific antibodies and engineered antibody fragments, presents new avenues for therapeutic intervention. Expansion into rare diseases and orphan indications where targeted therapies can make a significant impact is another key opportunity. The growing focus on immuno-oncology continues to drive innovation in bispecific antibodies and ADCs designed to harness the immune system against cancer. Furthermore, the integration of AI and machine learning in drug discovery and development promises to accelerate the identification of novel targets and optimize antibody design. The increasing adoption of personalized medicine approaches will also create demand for tailor-made antibody therapies based on individual patient biomarkers.
Growth Accelerators in the Next-Generation Antibody Therapeutics Market Industry
Several catalysts are accelerating the long-term growth of the Next-Generation Antibody Therapeutics Market. Technological breakthroughs in areas like gene editing, synthetic biology, and high-throughput screening are continuously enhancing the efficiency and scope of antibody discovery and development. Strategic partnerships and collaborations between large pharmaceutical companies and innovative biotechnology firms are crucial for pooling resources, sharing expertise, and accelerating the journey from lab to market. The expanding global reach of these advanced therapies, driven by increasing healthcare expenditure in emerging economies and the growing demand for novel treatments, is a significant growth accelerator. Furthermore, advancements in manufacturing technologies, including continuous bioprocessing and single-use systems, are helping to improve efficiency and reduce production costs, making these therapies more accessible. The increasing application of antibody therapeutics beyond oncology into areas like infectious diseases and neurodegenerative disorders also presents substantial growth potential.
Key Players Shaping the Next-Generation Antibody Therapeutics Market Market
- Kyowa Hakko Kirin Co Ltd
- Bayer AG
- Amgen Inc
- ImmunoGen Inc
- Xencor Inc
- F Hoffmann-La Roche Ltd
- GlaxoSmithKline Plc
- Biogen
- AstraZeneca Plc
- Seagen Inc
- Bristol-Myers Squibb Company
- Pfizer Inc
Notable Milestones in Next-Generation Antibody Therapeutics Market Sector
- December 2022: Sorrento Therapeutics, Inc. received clearance from the U.S. FDA to initiate clinical trials with its next-generation mRNA (STI-1557) vaccine against SARS-CoV-2 Omicron variants.
- July 2022: Byondis received biologics license application acceptance from the U.S. FDA for Vic-Trastuzumab Duocarmazine (SYD985), an antibody-drug conjugate, as a treatment for patients with HER2-positive advanced breast cancer.
In-Depth Next-Generation Antibody Therapeutics Market Market Outlook
The Next-Generation Antibody Therapeutics Market outlook is exceptionally robust, driven by sustained innovation and expanding therapeutic applications. Growth accelerators such as the relentless pursuit of novel antibody formats, including bispecific and trispecific antibodies, and the ongoing refinement of Antibody-Drug Conjugates (ADCs) with improved linker and payload technologies, are key to future market expansion. Strategic collaborations between established pharmaceutical giants and agile biotech firms will continue to be pivotal in de-risking R&D and accelerating the translation of scientific discoveries into viable treatments. The increasing global demand for advanced therapies, fueled by a growing prevalence of chronic diseases and rising healthcare investments in emerging markets, presents significant opportunities for market penetration. Furthermore, the exploration of antibody therapeutics in previously underserved therapeutic areas, such as rare genetic disorders and neurodegenerative diseases, is expected to unlock new market potential. The continuous evolution of manufacturing processes to enhance efficiency and reduce costs will also play a crucial role in increasing accessibility and driving market growth.
Next-Generation Antibody Therapeutics Market Segmentation
-
1. Therapeutic Area
- 1.1. Oncology
- 1.2. Autoimmune/Inflammatory
-
2. Technology
- 2.1. Antibody-Drug Conjugates (ADCs)
- 2.2. Bispecific Antibodies (BsAbs)
- 2.3. Fc-Engineered Antibodies
- 2.4. Antibody
- 2.5. Biosimilar Antibody Products
Next-Generation Antibody Therapeutics Market Segmentation By Geography
-
1. North America
- 1.1. United States
- 1.2. Canada
- 1.3. Mexico
-
2. Europe
- 2.1. Germany
- 2.2. United Kingdom
- 2.3. France
- 2.4. Italy
- 2.5. Spain
- 2.6. Rest of Europe
-
3. Asia Pacific
- 3.1. China
- 3.2. Japan
- 3.3. India
- 3.4. Australia
- 3.5. South Korea
- 3.6. Rest of Asia Pacific
-
4. Middle East and Africa
- 4.1. GCC
- 4.2. South Africa
- 4.3. Rest of Middle East and Africa
-
5. South America
- 5.1. Brazil
- 5.2. Argentina
- 5.3. Rest of South America
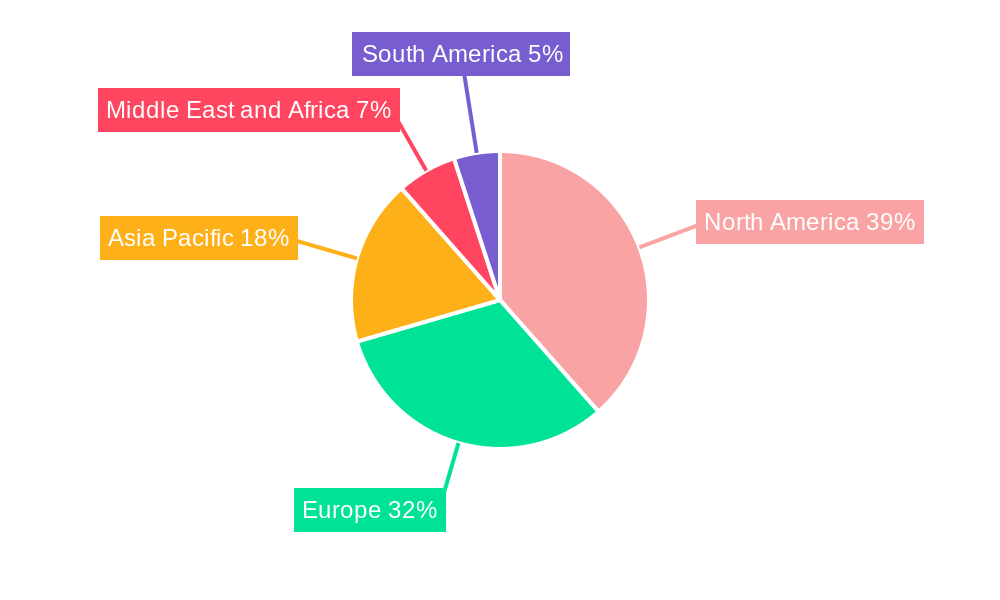
Next-Generation Antibody Therapeutics Market Regional Market Share
Geographic Coverage of Next-Generation Antibody Therapeutics Market
Next-Generation Antibody Therapeutics Market REPORT HIGHLIGHTS
| Aspects | Details |
|---|---|
| Study Period | 2020-2034 |
| Base Year | 2025 |
| Estimated Year | 2026 |
| Forecast Period | 2026-2034 |
| Historical Period | 2020-2025 |
| Growth Rate | CAGR of 10.9% from 2020-2034 |
| Segmentation |
|
Table of Contents
- 1. Introduction
- 1.1. Research Scope
- 1.2. Market Segmentation
- 1.3. Research Objective
- 1.4. Definitions and Assumptions
- 2. Executive Summary
- 2.1. Market Snapshot
- 3. Market Dynamics
- 3.1. Market Drivers
- 3.2. Market Restrains
- 3.3. Market Trends
- 3.4. Market Opportunities
- 4. Market Factor Analysis
- 4.1. Porters Five Forces
- 4.1.1. Bargaining Power of Suppliers
- 4.1.2. Bargaining Power of Buyers
- 4.1.3. Threat of New Entrants
- 4.1.4. Threat of Substitutes
- 4.1.5. Competitive Rivalry
- 4.2. PESTEL analysis
- 4.3. BCG Analysis
- 4.3.1. Stars (High Growth, High Market Share)
- 4.3.2. Cash Cows (Low Growth, High Market Share)
- 4.3.3. Question Mark (High Growth, Low Market Share)
- 4.3.4. Dogs (Low Growth, Low Market Share)
- 4.4. Ansoff Matrix Analysis
- 4.5. Supply Chain Analysis
- 4.6. Regulatory Landscape
- 4.7. Current Market Potential and Opportunity Assessment (TAM–SAM–SOM Framework)
- 4.8. VDR Analyst Note
- 4.1. Porters Five Forces
- 5. Market Analysis, Insights and Forecast 2021-2033
- 5.1. Market Analysis, Insights and Forecast - by Therapeutic Area
- 5.1.1. Oncology
- 5.1.2. Autoimmune/Inflammatory
- 5.2. Market Analysis, Insights and Forecast - by Technology
- 5.2.1. Antibody-Drug Conjugates (ADCs)
- 5.2.2. Bispecific Antibodies (BsAbs)
- 5.2.3. Fc-Engineered Antibodies
- 5.2.4. Antibody
- 5.2.5. Biosimilar Antibody Products
- 5.3. Market Analysis, Insights and Forecast - by Region
- 5.3.1. North America
- 5.3.2. Europe
- 5.3.3. Asia Pacific
- 5.3.4. Middle East and Africa
- 5.3.5. South America
- 5.1. Market Analysis, Insights and Forecast - by Therapeutic Area
- 6. Global Next-Generation Antibody Therapeutics Market Analysis, Insights and Forecast, 2021-2033
- 6.1. Market Analysis, Insights and Forecast - by Therapeutic Area
- 6.1.1. Oncology
- 6.1.2. Autoimmune/Inflammatory
- 6.2. Market Analysis, Insights and Forecast - by Technology
- 6.2.1. Antibody-Drug Conjugates (ADCs)
- 6.2.2. Bispecific Antibodies (BsAbs)
- 6.2.3. Fc-Engineered Antibodies
- 6.2.4. Antibody
- 6.2.5. Biosimilar Antibody Products
- 6.1. Market Analysis, Insights and Forecast - by Therapeutic Area
- 7. North America Next-Generation Antibody Therapeutics Market Analysis, Insights and Forecast, 2021-2033
- 7.1. Market Analysis, Insights and Forecast - by Therapeutic Area
- 7.1.1. Oncology
- 7.1.2. Autoimmune/Inflammatory
- 7.2. Market Analysis, Insights and Forecast - by Technology
- 7.2.1. Antibody-Drug Conjugates (ADCs)
- 7.2.2. Bispecific Antibodies (BsAbs)
- 7.2.3. Fc-Engineered Antibodies
- 7.2.4. Antibody
- 7.2.5. Biosimilar Antibody Products
- 7.1. Market Analysis, Insights and Forecast - by Therapeutic Area
- 8. Europe Next-Generation Antibody Therapeutics Market Analysis, Insights and Forecast, 2021-2033
- 8.1. Market Analysis, Insights and Forecast - by Therapeutic Area
- 8.1.1. Oncology
- 8.1.2. Autoimmune/Inflammatory
- 8.2. Market Analysis, Insights and Forecast - by Technology
- 8.2.1. Antibody-Drug Conjugates (ADCs)
- 8.2.2. Bispecific Antibodies (BsAbs)
- 8.2.3. Fc-Engineered Antibodies
- 8.2.4. Antibody
- 8.2.5. Biosimilar Antibody Products
- 8.1. Market Analysis, Insights and Forecast - by Therapeutic Area
- 9. Asia Pacific Next-Generation Antibody Therapeutics Market Analysis, Insights and Forecast, 2021-2033
- 9.1. Market Analysis, Insights and Forecast - by Therapeutic Area
- 9.1.1. Oncology
- 9.1.2. Autoimmune/Inflammatory
- 9.2. Market Analysis, Insights and Forecast - by Technology
- 9.2.1. Antibody-Drug Conjugates (ADCs)
- 9.2.2. Bispecific Antibodies (BsAbs)
- 9.2.3. Fc-Engineered Antibodies
- 9.2.4. Antibody
- 9.2.5. Biosimilar Antibody Products
- 9.1. Market Analysis, Insights and Forecast - by Therapeutic Area
- 10. Middle East and Africa Next-Generation Antibody Therapeutics Market Analysis, Insights and Forecast, 2021-2033
- 10.1. Market Analysis, Insights and Forecast - by Therapeutic Area
- 10.1.1. Oncology
- 10.1.2. Autoimmune/Inflammatory
- 10.2. Market Analysis, Insights and Forecast - by Technology
- 10.2.1. Antibody-Drug Conjugates (ADCs)
- 10.2.2. Bispecific Antibodies (BsAbs)
- 10.2.3. Fc-Engineered Antibodies
- 10.2.4. Antibody
- 10.2.5. Biosimilar Antibody Products
- 10.1. Market Analysis, Insights and Forecast - by Therapeutic Area
- 11. South America Next-Generation Antibody Therapeutics Market Analysis, Insights and Forecast, 2021-2033
- 11.1. Market Analysis, Insights and Forecast - by Therapeutic Area
- 11.1.1. Oncology
- 11.1.2. Autoimmune/Inflammatory
- 11.2. Market Analysis, Insights and Forecast - by Technology
- 11.2.1. Antibody-Drug Conjugates (ADCs)
- 11.2.2. Bispecific Antibodies (BsAbs)
- 11.2.3. Fc-Engineered Antibodies
- 11.2.4. Antibody
- 11.2.5. Biosimilar Antibody Products
- 11.1. Market Analysis, Insights and Forecast - by Therapeutic Area
- 12. Competitive Analysis
- 12.1. Company Profiles
- 12.1.1 Kyowa Hakko Kirin Co Ltd
- 12.1.1.1. Company Overview
- 12.1.1.2. Products
- 12.1.1.3. Company Financials
- 12.1.1.4. SWOT Analysis
- 12.1.2 Bayer AG
- 12.1.2.1. Company Overview
- 12.1.2.2. Products
- 12.1.2.3. Company Financials
- 12.1.2.4. SWOT Analysis
- 12.1.3 Amgen Inc
- 12.1.3.1. Company Overview
- 12.1.3.2. Products
- 12.1.3.3. Company Financials
- 12.1.3.4. SWOT Analysis
- 12.1.4 ImmunoGen Inc
- 12.1.4.1. Company Overview
- 12.1.4.2. Products
- 12.1.4.3. Company Financials
- 12.1.4.4. SWOT Analysis
- 12.1.5 Xencor Inc
- 12.1.5.1. Company Overview
- 12.1.5.2. Products
- 12.1.5.3. Company Financials
- 12.1.5.4. SWOT Analysis
- 12.1.6 F Hoffmann-La Roche Ltd
- 12.1.6.1. Company Overview
- 12.1.6.2. Products
- 12.1.6.3. Company Financials
- 12.1.6.4. SWOT Analysis
- 12.1.7 GlaxoSmithKline Plc
- 12.1.7.1. Company Overview
- 12.1.7.2. Products
- 12.1.7.3. Company Financials
- 12.1.7.4. SWOT Analysis
- 12.1.8 Biogen
- 12.1.8.1. Company Overview
- 12.1.8.2. Products
- 12.1.8.3. Company Financials
- 12.1.8.4. SWOT Analysis
- 12.1.9 AstraZeneca Plc
- 12.1.9.1. Company Overview
- 12.1.9.2. Products
- 12.1.9.3. Company Financials
- 12.1.9.4. SWOT Analysis
- 12.1.10 Seagen Inc
- 12.1.10.1. Company Overview
- 12.1.10.2. Products
- 12.1.10.3. Company Financials
- 12.1.10.4. SWOT Analysis
- 12.1.11 Bristol-Myers Squibb Company
- 12.1.11.1. Company Overview
- 12.1.11.2. Products
- 12.1.11.3. Company Financials
- 12.1.11.4. SWOT Analysis
- 12.1.12 Pfizer Inc
- 12.1.12.1. Company Overview
- 12.1.12.2. Products
- 12.1.12.3. Company Financials
- 12.1.12.4. SWOT Analysis
- 12.1.1 Kyowa Hakko Kirin Co Ltd
- 12.2. Market Entropy
- 12.2.1 Company's Key Areas Served
- 12.2.2 Recent Developments
- 12.3. Company Market Share Analysis 2025
- 12.3.1 Top 5 Companies Market Share Analysis
- 12.3.2 Top 3 Companies Market Share Analysis
- 12.4. List of Potential Customers
- 13. Research Methodology
List of Figures
- Figure 1: Global Next-Generation Antibody Therapeutics Market Revenue Breakdown (billion, %) by Region 2025 & 2033
- Figure 2: Global Next-Generation Antibody Therapeutics Market Volume Breakdown (K Unit, %) by Region 2025 & 2033
- Figure 3: North America Next-Generation Antibody Therapeutics Market Revenue (billion), by Therapeutic Area 2025 & 2033
- Figure 4: North America Next-Generation Antibody Therapeutics Market Volume (K Unit), by Therapeutic Area 2025 & 2033
- Figure 5: North America Next-Generation Antibody Therapeutics Market Revenue Share (%), by Therapeutic Area 2025 & 2033
- Figure 6: North America Next-Generation Antibody Therapeutics Market Volume Share (%), by Therapeutic Area 2025 & 2033
- Figure 7: North America Next-Generation Antibody Therapeutics Market Revenue (billion), by Technology 2025 & 2033
- Figure 8: North America Next-Generation Antibody Therapeutics Market Volume (K Unit), by Technology 2025 & 2033
- Figure 9: North America Next-Generation Antibody Therapeutics Market Revenue Share (%), by Technology 2025 & 2033
- Figure 10: North America Next-Generation Antibody Therapeutics Market Volume Share (%), by Technology 2025 & 2033
- Figure 11: North America Next-Generation Antibody Therapeutics Market Revenue (billion), by Country 2025 & 2033
- Figure 12: North America Next-Generation Antibody Therapeutics Market Volume (K Unit), by Country 2025 & 2033
- Figure 13: North America Next-Generation Antibody Therapeutics Market Revenue Share (%), by Country 2025 & 2033
- Figure 14: North America Next-Generation Antibody Therapeutics Market Volume Share (%), by Country 2025 & 2033
- Figure 15: Europe Next-Generation Antibody Therapeutics Market Revenue (billion), by Therapeutic Area 2025 & 2033
- Figure 16: Europe Next-Generation Antibody Therapeutics Market Volume (K Unit), by Therapeutic Area 2025 & 2033
- Figure 17: Europe Next-Generation Antibody Therapeutics Market Revenue Share (%), by Therapeutic Area 2025 & 2033
- Figure 18: Europe Next-Generation Antibody Therapeutics Market Volume Share (%), by Therapeutic Area 2025 & 2033
- Figure 19: Europe Next-Generation Antibody Therapeutics Market Revenue (billion), by Technology 2025 & 2033
- Figure 20: Europe Next-Generation Antibody Therapeutics Market Volume (K Unit), by Technology 2025 & 2033
- Figure 21: Europe Next-Generation Antibody Therapeutics Market Revenue Share (%), by Technology 2025 & 2033
- Figure 22: Europe Next-Generation Antibody Therapeutics Market Volume Share (%), by Technology 2025 & 2033
- Figure 23: Europe Next-Generation Antibody Therapeutics Market Revenue (billion), by Country 2025 & 2033
- Figure 24: Europe Next-Generation Antibody Therapeutics Market Volume (K Unit), by Country 2025 & 2033
- Figure 25: Europe Next-Generation Antibody Therapeutics Market Revenue Share (%), by Country 2025 & 2033
- Figure 26: Europe Next-Generation Antibody Therapeutics Market Volume Share (%), by Country 2025 & 2033
- Figure 27: Asia Pacific Next-Generation Antibody Therapeutics Market Revenue (billion), by Therapeutic Area 2025 & 2033
- Figure 28: Asia Pacific Next-Generation Antibody Therapeutics Market Volume (K Unit), by Therapeutic Area 2025 & 2033
- Figure 29: Asia Pacific Next-Generation Antibody Therapeutics Market Revenue Share (%), by Therapeutic Area 2025 & 2033
- Figure 30: Asia Pacific Next-Generation Antibody Therapeutics Market Volume Share (%), by Therapeutic Area 2025 & 2033
- Figure 31: Asia Pacific Next-Generation Antibody Therapeutics Market Revenue (billion), by Technology 2025 & 2033
- Figure 32: Asia Pacific Next-Generation Antibody Therapeutics Market Volume (K Unit), by Technology 2025 & 2033
- Figure 33: Asia Pacific Next-Generation Antibody Therapeutics Market Revenue Share (%), by Technology 2025 & 2033
- Figure 34: Asia Pacific Next-Generation Antibody Therapeutics Market Volume Share (%), by Technology 2025 & 2033
- Figure 35: Asia Pacific Next-Generation Antibody Therapeutics Market Revenue (billion), by Country 2025 & 2033
- Figure 36: Asia Pacific Next-Generation Antibody Therapeutics Market Volume (K Unit), by Country 2025 & 2033
- Figure 37: Asia Pacific Next-Generation Antibody Therapeutics Market Revenue Share (%), by Country 2025 & 2033
- Figure 38: Asia Pacific Next-Generation Antibody Therapeutics Market Volume Share (%), by Country 2025 & 2033
- Figure 39: Middle East and Africa Next-Generation Antibody Therapeutics Market Revenue (billion), by Therapeutic Area 2025 & 2033
- Figure 40: Middle East and Africa Next-Generation Antibody Therapeutics Market Volume (K Unit), by Therapeutic Area 2025 & 2033
- Figure 41: Middle East and Africa Next-Generation Antibody Therapeutics Market Revenue Share (%), by Therapeutic Area 2025 & 2033
- Figure 42: Middle East and Africa Next-Generation Antibody Therapeutics Market Volume Share (%), by Therapeutic Area 2025 & 2033
- Figure 43: Middle East and Africa Next-Generation Antibody Therapeutics Market Revenue (billion), by Technology 2025 & 2033
- Figure 44: Middle East and Africa Next-Generation Antibody Therapeutics Market Volume (K Unit), by Technology 2025 & 2033
- Figure 45: Middle East and Africa Next-Generation Antibody Therapeutics Market Revenue Share (%), by Technology 2025 & 2033
- Figure 46: Middle East and Africa Next-Generation Antibody Therapeutics Market Volume Share (%), by Technology 2025 & 2033
- Figure 47: Middle East and Africa Next-Generation Antibody Therapeutics Market Revenue (billion), by Country 2025 & 2033
- Figure 48: Middle East and Africa Next-Generation Antibody Therapeutics Market Volume (K Unit), by Country 2025 & 2033
- Figure 49: Middle East and Africa Next-Generation Antibody Therapeutics Market Revenue Share (%), by Country 2025 & 2033
- Figure 50: Middle East and Africa Next-Generation Antibody Therapeutics Market Volume Share (%), by Country 2025 & 2033
- Figure 51: South America Next-Generation Antibody Therapeutics Market Revenue (billion), by Therapeutic Area 2025 & 2033
- Figure 52: South America Next-Generation Antibody Therapeutics Market Volume (K Unit), by Therapeutic Area 2025 & 2033
- Figure 53: South America Next-Generation Antibody Therapeutics Market Revenue Share (%), by Therapeutic Area 2025 & 2033
- Figure 54: South America Next-Generation Antibody Therapeutics Market Volume Share (%), by Therapeutic Area 2025 & 2033
- Figure 55: South America Next-Generation Antibody Therapeutics Market Revenue (billion), by Technology 2025 & 2033
- Figure 56: South America Next-Generation Antibody Therapeutics Market Volume (K Unit), by Technology 2025 & 2033
- Figure 57: South America Next-Generation Antibody Therapeutics Market Revenue Share (%), by Technology 2025 & 2033
- Figure 58: South America Next-Generation Antibody Therapeutics Market Volume Share (%), by Technology 2025 & 2033
- Figure 59: South America Next-Generation Antibody Therapeutics Market Revenue (billion), by Country 2025 & 2033
- Figure 60: South America Next-Generation Antibody Therapeutics Market Volume (K Unit), by Country 2025 & 2033
- Figure 61: South America Next-Generation Antibody Therapeutics Market Revenue Share (%), by Country 2025 & 2033
- Figure 62: South America Next-Generation Antibody Therapeutics Market Volume Share (%), by Country 2025 & 2033
List of Tables
- Table 1: Global Next-Generation Antibody Therapeutics Market Revenue billion Forecast, by Therapeutic Area 2020 & 2033
- Table 2: Global Next-Generation Antibody Therapeutics Market Volume K Unit Forecast, by Therapeutic Area 2020 & 2033
- Table 3: Global Next-Generation Antibody Therapeutics Market Revenue billion Forecast, by Technology 2020 & 2033
- Table 4: Global Next-Generation Antibody Therapeutics Market Volume K Unit Forecast, by Technology 2020 & 2033
- Table 5: Global Next-Generation Antibody Therapeutics Market Revenue billion Forecast, by Region 2020 & 2033
- Table 6: Global Next-Generation Antibody Therapeutics Market Volume K Unit Forecast, by Region 2020 & 2033
- Table 7: Global Next-Generation Antibody Therapeutics Market Revenue billion Forecast, by Therapeutic Area 2020 & 2033
- Table 8: Global Next-Generation Antibody Therapeutics Market Volume K Unit Forecast, by Therapeutic Area 2020 & 2033
- Table 9: Global Next-Generation Antibody Therapeutics Market Revenue billion Forecast, by Technology 2020 & 2033
- Table 10: Global Next-Generation Antibody Therapeutics Market Volume K Unit Forecast, by Technology 2020 & 2033
- Table 11: Global Next-Generation Antibody Therapeutics Market Revenue billion Forecast, by Country 2020 & 2033
- Table 12: Global Next-Generation Antibody Therapeutics Market Volume K Unit Forecast, by Country 2020 & 2033
- Table 13: United States Next-Generation Antibody Therapeutics Market Revenue (billion) Forecast, by Application 2020 & 2033
- Table 14: United States Next-Generation Antibody Therapeutics Market Volume (K Unit) Forecast, by Application 2020 & 2033
- Table 15: Canada Next-Generation Antibody Therapeutics Market Revenue (billion) Forecast, by Application 2020 & 2033
- Table 16: Canada Next-Generation Antibody Therapeutics Market Volume (K Unit) Forecast, by Application 2020 & 2033
- Table 17: Mexico Next-Generation Antibody Therapeutics Market Revenue (billion) Forecast, by Application 2020 & 2033
- Table 18: Mexico Next-Generation Antibody Therapeutics Market Volume (K Unit) Forecast, by Application 2020 & 2033
- Table 19: Global Next-Generation Antibody Therapeutics Market Revenue billion Forecast, by Therapeutic Area 2020 & 2033
- Table 20: Global Next-Generation Antibody Therapeutics Market Volume K Unit Forecast, by Therapeutic Area 2020 & 2033
- Table 21: Global Next-Generation Antibody Therapeutics Market Revenue billion Forecast, by Technology 2020 & 2033
- Table 22: Global Next-Generation Antibody Therapeutics Market Volume K Unit Forecast, by Technology 2020 & 2033
- Table 23: Global Next-Generation Antibody Therapeutics Market Revenue billion Forecast, by Country 2020 & 2033
- Table 24: Global Next-Generation Antibody Therapeutics Market Volume K Unit Forecast, by Country 2020 & 2033
- Table 25: Germany Next-Generation Antibody Therapeutics Market Revenue (billion) Forecast, by Application 2020 & 2033
- Table 26: Germany Next-Generation Antibody Therapeutics Market Volume (K Unit) Forecast, by Application 2020 & 2033
- Table 27: United Kingdom Next-Generation Antibody Therapeutics Market Revenue (billion) Forecast, by Application 2020 & 2033
- Table 28: United Kingdom Next-Generation Antibody Therapeutics Market Volume (K Unit) Forecast, by Application 2020 & 2033
- Table 29: France Next-Generation Antibody Therapeutics Market Revenue (billion) Forecast, by Application 2020 & 2033
- Table 30: France Next-Generation Antibody Therapeutics Market Volume (K Unit) Forecast, by Application 2020 & 2033
- Table 31: Italy Next-Generation Antibody Therapeutics Market Revenue (billion) Forecast, by Application 2020 & 2033
- Table 32: Italy Next-Generation Antibody Therapeutics Market Volume (K Unit) Forecast, by Application 2020 & 2033
- Table 33: Spain Next-Generation Antibody Therapeutics Market Revenue (billion) Forecast, by Application 2020 & 2033
- Table 34: Spain Next-Generation Antibody Therapeutics Market Volume (K Unit) Forecast, by Application 2020 & 2033
- Table 35: Rest of Europe Next-Generation Antibody Therapeutics Market Revenue (billion) Forecast, by Application 2020 & 2033
- Table 36: Rest of Europe Next-Generation Antibody Therapeutics Market Volume (K Unit) Forecast, by Application 2020 & 2033
- Table 37: Global Next-Generation Antibody Therapeutics Market Revenue billion Forecast, by Therapeutic Area 2020 & 2033
- Table 38: Global Next-Generation Antibody Therapeutics Market Volume K Unit Forecast, by Therapeutic Area 2020 & 2033
- Table 39: Global Next-Generation Antibody Therapeutics Market Revenue billion Forecast, by Technology 2020 & 2033
- Table 40: Global Next-Generation Antibody Therapeutics Market Volume K Unit Forecast, by Technology 2020 & 2033
- Table 41: Global Next-Generation Antibody Therapeutics Market Revenue billion Forecast, by Country 2020 & 2033
- Table 42: Global Next-Generation Antibody Therapeutics Market Volume K Unit Forecast, by Country 2020 & 2033
- Table 43: China Next-Generation Antibody Therapeutics Market Revenue (billion) Forecast, by Application 2020 & 2033
- Table 44: China Next-Generation Antibody Therapeutics Market Volume (K Unit) Forecast, by Application 2020 & 2033
- Table 45: Japan Next-Generation Antibody Therapeutics Market Revenue (billion) Forecast, by Application 2020 & 2033
- Table 46: Japan Next-Generation Antibody Therapeutics Market Volume (K Unit) Forecast, by Application 2020 & 2033
- Table 47: India Next-Generation Antibody Therapeutics Market Revenue (billion) Forecast, by Application 2020 & 2033
- Table 48: India Next-Generation Antibody Therapeutics Market Volume (K Unit) Forecast, by Application 2020 & 2033
- Table 49: Australia Next-Generation Antibody Therapeutics Market Revenue (billion) Forecast, by Application 2020 & 2033
- Table 50: Australia Next-Generation Antibody Therapeutics Market Volume (K Unit) Forecast, by Application 2020 & 2033
- Table 51: South Korea Next-Generation Antibody Therapeutics Market Revenue (billion) Forecast, by Application 2020 & 2033
- Table 52: South Korea Next-Generation Antibody Therapeutics Market Volume (K Unit) Forecast, by Application 2020 & 2033
- Table 53: Rest of Asia Pacific Next-Generation Antibody Therapeutics Market Revenue (billion) Forecast, by Application 2020 & 2033
- Table 54: Rest of Asia Pacific Next-Generation Antibody Therapeutics Market Volume (K Unit) Forecast, by Application 2020 & 2033
- Table 55: Global Next-Generation Antibody Therapeutics Market Revenue billion Forecast, by Therapeutic Area 2020 & 2033
- Table 56: Global Next-Generation Antibody Therapeutics Market Volume K Unit Forecast, by Therapeutic Area 2020 & 2033
- Table 57: Global Next-Generation Antibody Therapeutics Market Revenue billion Forecast, by Technology 2020 & 2033
- Table 58: Global Next-Generation Antibody Therapeutics Market Volume K Unit Forecast, by Technology 2020 & 2033
- Table 59: Global Next-Generation Antibody Therapeutics Market Revenue billion Forecast, by Country 2020 & 2033
- Table 60: Global Next-Generation Antibody Therapeutics Market Volume K Unit Forecast, by Country 2020 & 2033
- Table 61: GCC Next-Generation Antibody Therapeutics Market Revenue (billion) Forecast, by Application 2020 & 2033
- Table 62: GCC Next-Generation Antibody Therapeutics Market Volume (K Unit) Forecast, by Application 2020 & 2033
- Table 63: South Africa Next-Generation Antibody Therapeutics Market Revenue (billion) Forecast, by Application 2020 & 2033
- Table 64: South Africa Next-Generation Antibody Therapeutics Market Volume (K Unit) Forecast, by Application 2020 & 2033
- Table 65: Rest of Middle East and Africa Next-Generation Antibody Therapeutics Market Revenue (billion) Forecast, by Application 2020 & 2033
- Table 66: Rest of Middle East and Africa Next-Generation Antibody Therapeutics Market Volume (K Unit) Forecast, by Application 2020 & 2033
- Table 67: Global Next-Generation Antibody Therapeutics Market Revenue billion Forecast, by Therapeutic Area 2020 & 2033
- Table 68: Global Next-Generation Antibody Therapeutics Market Volume K Unit Forecast, by Therapeutic Area 2020 & 2033
- Table 69: Global Next-Generation Antibody Therapeutics Market Revenue billion Forecast, by Technology 2020 & 2033
- Table 70: Global Next-Generation Antibody Therapeutics Market Volume K Unit Forecast, by Technology 2020 & 2033
- Table 71: Global Next-Generation Antibody Therapeutics Market Revenue billion Forecast, by Country 2020 & 2033
- Table 72: Global Next-Generation Antibody Therapeutics Market Volume K Unit Forecast, by Country 2020 & 2033
- Table 73: Brazil Next-Generation Antibody Therapeutics Market Revenue (billion) Forecast, by Application 2020 & 2033
- Table 74: Brazil Next-Generation Antibody Therapeutics Market Volume (K Unit) Forecast, by Application 2020 & 2033
- Table 75: Argentina Next-Generation Antibody Therapeutics Market Revenue (billion) Forecast, by Application 2020 & 2033
- Table 76: Argentina Next-Generation Antibody Therapeutics Market Volume (K Unit) Forecast, by Application 2020 & 2033
- Table 77: Rest of South America Next-Generation Antibody Therapeutics Market Revenue (billion) Forecast, by Application 2020 & 2033
- Table 78: Rest of South America Next-Generation Antibody Therapeutics Market Volume (K Unit) Forecast, by Application 2020 & 2033
Frequently Asked Questions
1. What is the projected Compound Annual Growth Rate (CAGR) of the Next-Generation Antibody Therapeutics Market?
The projected CAGR is approximately 10.9%.
2. Which companies are prominent players in the Next-Generation Antibody Therapeutics Market?
Key companies in the market include Kyowa Hakko Kirin Co Ltd, Bayer AG, Amgen Inc, ImmunoGen Inc, Xencor Inc, F Hoffmann-La Roche Ltd, GlaxoSmithKline Plc, Biogen, AstraZeneca Plc, Seagen Inc, Bristol-Myers Squibb Company, Pfizer Inc.
3. What are the main segments of the Next-Generation Antibody Therapeutics Market?
The market segments include Therapeutic Area, Technology.
4. Can you provide details about the market size?
The market size is estimated to be USD 7.63 billion as of 2022.
5. What are some drivers contributing to market growth?
Increasing Incidence of Cancer; Rising Prevalence of Autoimmune Diseases; Technological Progressions in Antibody Therapeutics.
6. What are the notable trends driving market growth?
Antibody-Drug Conjugates Segment is Expected to Hold the Largest Market Share in the Next-Generation Antibody Therapeutics Market.
7. Are there any restraints impacting market growth?
Stringent Regulatory Framework; High costs of Next-Generation Antibody Therapeutics.
8. Can you provide examples of recent developments in the market?
December 2022: Sorrento Therapeutics, Inc. received clearance from the U.S. FDA to initiate clinical trials with its next-generation mRNA (STI-1557) vaccine against SARS-CoV-2 Omicron variants.
9. What pricing options are available for accessing the report?
Pricing options include single-user, multi-user, and enterprise licenses priced at USD 4750, USD 5250, and USD 8750 respectively.
10. Is the market size provided in terms of value or volume?
The market size is provided in terms of value, measured in billion and volume, measured in K Unit.
11. Are there any specific market keywords associated with the report?
Yes, the market keyword associated with the report is "Next-Generation Antibody Therapeutics Market," which aids in identifying and referencing the specific market segment covered.
12. How do I determine which pricing option suits my needs best?
The pricing options vary based on user requirements and access needs. Individual users may opt for single-user licenses, while businesses requiring broader access may choose multi-user or enterprise licenses for cost-effective access to the report.
13. Are there any additional resources or data provided in the Next-Generation Antibody Therapeutics Market report?
While the report offers comprehensive insights, it's advisable to review the specific contents or supplementary materials provided to ascertain if additional resources or data are available.
14. How can I stay updated on further developments or reports in the Next-Generation Antibody Therapeutics Market?
To stay informed about further developments, trends, and reports in the Next-Generation Antibody Therapeutics Market, consider subscribing to industry newsletters, following relevant companies and organizations, or regularly checking reputable industry news sources and publications.
Methodology
Step 1 - Identification of Relevant Samples Size from Population Database


Step 2 - Approaches for Defining Global Market Size (Value, Volume* & Price*)

Note*: In applicable scenarios
Step 3 - Data Sources
Primary Research
- Web Analytics
- Survey Reports
- Research Institute
- Latest Research Reports
- Opinion Leaders
Secondary Research
- Annual Reports
- White Paper
- Latest Press Release
- Industry Association
- Paid Database
- Investor Presentations

Step 4 - Data Triangulation
Involves using different sources of information in order to increase the validity of a study
These sources are likely to be stakeholders in a program - participants, other researchers, program staff, other community members, and so on.
Then we put all data in single framework & apply various statistical tools to find out the dynamic on the market.
During the analysis stage, feedback from the stakeholder groups would be compared to determine areas of agreement as well as areas of divergence