
Key Insights
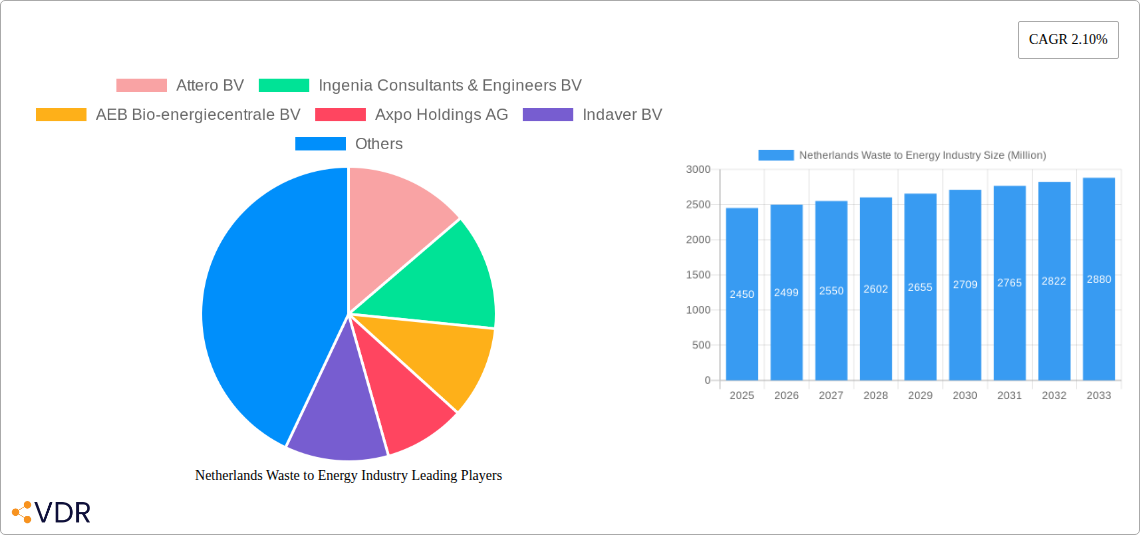
The Netherlands Waste-to-Energy (WtE) market, valued at €2.45 billion in 2025, is projected to experience steady growth, driven by stringent environmental regulations aimed at reducing landfill waste and increasing renewable energy production. The country's commitment to circular economy principles and ambitious sustainability targets fuels the demand for efficient WtE solutions. Key technologies like incineration, anaerobic digestion, and gasification are witnessing increased adoption, catering to diverse waste streams, including municipal solid waste (MSW), industrial waste, and agricultural waste. The industrial sector is a major end-user, followed by the commercial and residential sectors. While challenges exist, such as the high capital costs associated with WtE infrastructure and public perception concerns surrounding certain technologies, government incentives and public-private partnerships are mitigating these restraints. The market is characterized by a mix of established players like Attero BV and Indaver BV, and emerging companies focusing on innovative WtE technologies. The consistent CAGR of 2.10% reflects a stable and predictable growth trajectory, although innovation and technological advancements could accelerate this rate in the coming years. Regional variations within the Netherlands might exist, with higher concentrations of WtE facilities in densely populated urban areas.
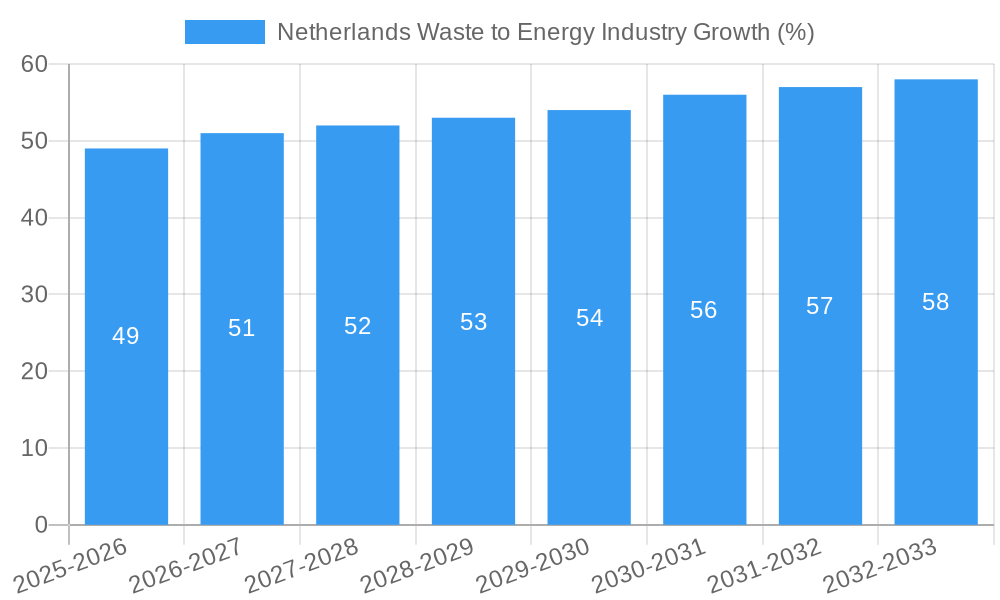
The forecast period from 2025 to 2033 indicates continued growth in the Netherlands WtE market. The consistent adoption of advanced technologies, coupled with increasing awareness of sustainable waste management practices among businesses and consumers, is expected to drive market expansion. Government policies supporting renewable energy and waste reduction are crucial factors in sustaining this growth. Future growth could see a shift towards more sustainable and efficient WtE technologies, such as advanced pyrolysis and gasification, which offer higher energy recovery rates and reduced environmental impact. The competitive landscape is likely to remain dynamic, with both established players and new entrants vying for market share. The focus on optimizing energy efficiency and minimizing greenhouse gas emissions will continue to shape technological advancements and market trends within the Netherlands WtE sector.
Netherlands Waste to Energy Industry Market Report: 2019-2033
This comprehensive report provides an in-depth analysis of the Netherlands Waste-to-Energy (WtE) industry, covering market dynamics, growth trends, key players, and future outlook. The report utilizes data from the historical period (2019-2024), base year (2025), and forecast period (2025-2033), offering a complete picture for investors, industry professionals, and policymakers. The market is segmented by technology (Incineration, Gasification, Pyrolysis, Anaerobic Digestion, Refuse-Derived Fuel), waste type (Municipal Solid Waste, Industrial Waste, Hazardous Waste, Agricultural Waste), and end-user (Industrial, Commercial, Residential).
Netherlands Waste to Energy Industry Market Dynamics & Structure
The Netherlands WtE market is characterized by a moderately concentrated structure, with several key players dominating specific segments. Technological innovation, driven primarily by stricter environmental regulations and the need for sustainable energy solutions, is a key market driver. The regulatory framework, including EU directives on waste management and renewable energy targets, heavily influences industry practices. Competition from alternative waste management methods (e.g., landfill) and the fluctuating prices of fossil fuels also impact market dynamics. The market has witnessed several M&A activities in recent years, driven by the pursuit of economies of scale and technological expertise.
- Market Concentration: Moderately concentrated, with a few major players holding significant market share (xx%).
- Technological Innovation: Focus on improving efficiency, reducing emissions, and exploring advanced technologies like gasification and pyrolysis.
- Regulatory Framework: Stringent environmental regulations and EU directives shape industry practices.
- Competitive Substitutes: Landfill and other waste management methods pose competition.
- End-User Demographics: Growing urban population and increasing industrial activity drive demand.
- M&A Trends: A moderate number of mergers and acquisitions (xx deals) observed in the past 5 years, primarily focused on consolidation and technological expansion.
Netherlands Waste to Energy Industry Growth Trends & Insights
The Netherlands WtE market experienced a steady growth during the historical period (2019-2024) driven by increasing waste generation and stringent environmental regulations. This trend is projected to continue with a Compound Annual Growth Rate (CAGR) of xx% during the forecast period (2025-2033). Market penetration of WtE technologies, particularly incineration, is high in urban areas, with ongoing efforts to expand capacity in less-developed regions. Technological disruptions, such as advancements in carbon capture and utilization, are further driving market growth. Consumer behavior shifts toward environmental sustainability also play a pivotal role in fueling industry growth. The market size is projected to reach xx million EUR by 2033.
Dominant Regions, Countries, or Segments in Netherlands Waste to Energy Industry
The market is concentrated in densely populated urban areas, where waste generation is highest. Incineration remains the dominant technology, owing to its maturity and proven effectiveness. Municipal Solid Waste (MSW) is the largest waste stream, contributing xx% to the total market. Industrial end-users represent a significant portion of the market due to their high waste generation and energy requirements.
- Leading Region: Randstad (Amsterdam, Rotterdam, The Hague) region due to high population density and established infrastructure.
- Dominant Technology: Incineration due to maturity, efficiency, and existing infrastructure.
- Largest Waste Stream: Municipal Solid Waste (MSW).
- Key Growth Drivers: Stringent waste management policies, rising energy prices, and increasing awareness of environmental sustainability.
Netherlands Waste to Energy Industry Product Landscape
The Netherlands WtE industry offers a range of technologies, from traditional incineration to advanced gasification and pyrolysis plants. Recent product innovations focus on enhancing energy efficiency, reducing emissions, and recovering valuable materials from waste. Key performance metrics include energy recovery rates, greenhouse gas emissions, and ash residue management. Unique selling propositions include innovative carbon capture and utilization technologies and improved waste sorting systems.
Key Drivers, Barriers & Challenges in Netherlands Waste to Energy Industry
Key Drivers: Stricter environmental regulations, increasing energy prices, growing environmental awareness among consumers, and the need for sustainable waste management solutions.
Challenges: High capital investment costs for new facilities, obtaining permits and approvals for new projects, the availability of suitable waste streams, and public perception concerning WtE plants. The need for efficient waste sorting and pre-treatment processes to optimize the incineration process is critical. These challenges limit the rate of market expansion.
Emerging Opportunities in Netherlands Waste to Energy Industry
Opportunities exist in expanding WtE capacity in less-developed regions, implementing advanced technologies (e.g., gasification, pyrolysis), and developing integrated waste management systems. Exploring the potential for waste-to-biofuels and integrating WtE plants with other energy systems present significant growth possibilities. Further, the market can explore options for carbon capture and utilization to add value to the overall waste management chain.
Growth Accelerators in the Netherlands Waste to Energy Industry Industry
Technological breakthroughs in carbon capture, utilization, and storage (CCUS) technologies will greatly enhance the market. Strategic partnerships between WtE operators, technology providers, and waste management companies are crucial for accelerating growth. Government incentives and policies promoting sustainable energy solutions will continue to drive market expansion.
Key Players Shaping the Netherlands Waste to Energy Industry Market
- Attero BV
- Ingenia Consultants & Engineers BV
- AEB Bio-energiecentrale BV
- Axpo Holdings AG
- Indaver BV
- Dutch Incinerators BV
- AEB Amsterdam
- Mitsubishi Heavy Industries Ltd
Notable Milestones in Netherlands Waste to Energy Industry Sector
- May 2022: Aker Carbon Capture began building its Just Catch modular carbon capture plant at Twence's waste-to-energy plant in Hengelo, aiming to reduce CO2 emissions associated with waste incineration.
- January 2023: RWE received USD 117 million from the European Union's Innovation Fund to support the construction of a waste-to-hydrogen project.
In-Depth Netherlands Waste to Energy Industry Market Outlook
The Netherlands WtE industry is poised for continued growth driven by increasing waste generation, stringent environmental regulations, and technological advancements. Strategic opportunities lie in exploring advanced technologies, integrating WtE with other energy systems, and developing innovative business models. The focus on circular economy principles and carbon neutrality will shape the future development of the market, creating a substantial market potential in the coming years.
Netherlands Waste to Energy Industry Segmentation
-
1. Technology
- 1.1. Incineration
- 1.2. Gasification
- 1.3. Pyrolysis
- 1.4. Anaerobic Digestion
- 1.5. Refuse-Derived Fuel
-
2. Waste Type
- 2.1. Municipal Solid Waste
- 2.2. Industrial Waste
- 2.3. Hazardous Waste
- 2.4. Agricultural Waste
-
3. End-User
- 3.1. Industrial
- 3.2. Commercial
- 3.3. Residential
Netherlands Waste to Energy Industry Segmentation By Geography
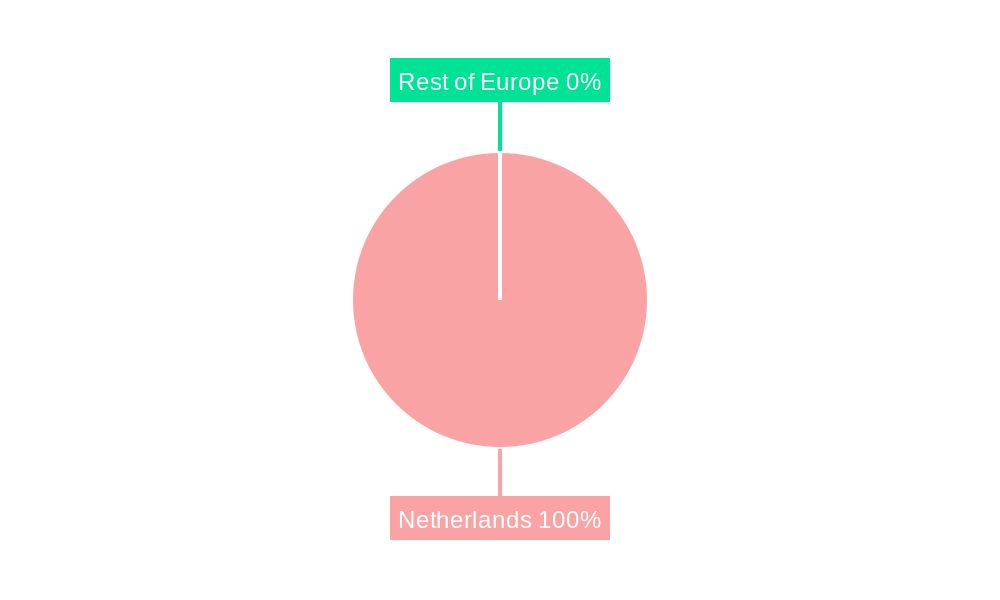
- 1. Netherlands
Netherlands Waste to Energy Industry REPORT HIGHLIGHTS
| Aspects | Details |
|---|---|
| Study Period | 2019-2033 |
| Base Year | 2024 |
| Estimated Year | 2025 |
| Forecast Period | 2025-2033 |
| Historical Period | 2019-2024 |
| Growth Rate | CAGR of 2.10% from 2019-2033 |
| Segmentation |
|
Table of Contents
- 1. Introduction
- 1.1. Research Scope
- 1.2. Market Segmentation
- 1.3. Research Methodology
- 1.4. Definitions and Assumptions
- 2. Executive Summary
- 2.1. Introduction
- 3. Market Dynamics
- 3.1. Introduction
- 3.2. Market Drivers
- 3.2.1. Supportive Government Policies for Waste-to-Energy Plants4.; Increasing Investments in Waste-to-Energy Industries
- 3.3. Market Restrains
- 3.3.1. The Strict Regulation Imposed Against the Release of Harmful Gases When Trash is Burned
- 3.4. Market Trends
- 3.4.1. Thermal Technologies Segment to Dominate the Market
- 4. Market Factor Analysis
- 4.1. Porters Five Forces
- 4.2. Supply/Value Chain
- 4.3. PESTEL analysis
- 4.4. Market Entropy
- 4.5. Patent/Trademark Analysis
- 5. Netherlands Waste to Energy Industry Analysis, Insights and Forecast, 2019-2031
- 5.1. Market Analysis, Insights and Forecast - by Technology
- 5.1.1. Incineration
- 5.1.2. Gasification
- 5.1.3. Pyrolysis
- 5.1.4. Anaerobic Digestion
- 5.1.5. Refuse-Derived Fuel
- 5.2. Market Analysis, Insights and Forecast - by Waste Type
- 5.2.1. Municipal Solid Waste
- 5.2.2. Industrial Waste
- 5.2.3. Hazardous Waste
- 5.2.4. Agricultural Waste
- 5.3. Market Analysis, Insights and Forecast - by End-User
- 5.3.1. Industrial
- 5.3.2. Commercial
- 5.3.3. Residential
- 5.4. Market Analysis, Insights and Forecast - by Region
- 5.4.1. Netherlands
- 5.1. Market Analysis, Insights and Forecast - by Technology
- 6. Germany Netherlands Waste to Energy Industry Analysis, Insights and Forecast, 2019-2031
- 7. France Netherlands Waste to Energy Industry Analysis, Insights and Forecast, 2019-2031
- 8. Italy Netherlands Waste to Energy Industry Analysis, Insights and Forecast, 2019-2031
- 9. United Kingdom Netherlands Waste to Energy Industry Analysis, Insights and Forecast, 2019-2031
- 10. Netherlands Netherlands Waste to Energy Industry Analysis, Insights and Forecast, 2019-2031
- 11. Rest of Europe Netherlands Waste to Energy Industry Analysis, Insights and Forecast, 2019-2031
- 12. Competitive Analysis
- 12.1. Market Share Analysis 2024
- 12.2. Company Profiles
- 12.2.1 Attero BV
- 12.2.1.1. Overview
- 12.2.1.2. Products
- 12.2.1.3. SWOT Analysis
- 12.2.1.4. Recent Developments
- 12.2.1.5. Financials (Based on Availability)
- 12.2.2 Ingenia Consultants & Engineers BV
- 12.2.2.1. Overview
- 12.2.2.2. Products
- 12.2.2.3. SWOT Analysis
- 12.2.2.4. Recent Developments
- 12.2.2.5. Financials (Based on Availability)
- 12.2.3 AEB Bio-energiecentrale BV
- 12.2.3.1. Overview
- 12.2.3.2. Products
- 12.2.3.3. SWOT Analysis
- 12.2.3.4. Recent Developments
- 12.2.3.5. Financials (Based on Availability)
- 12.2.4 Axpo Holdings AG
- 12.2.4.1. Overview
- 12.2.4.2. Products
- 12.2.4.3. SWOT Analysis
- 12.2.4.4. Recent Developments
- 12.2.4.5. Financials (Based on Availability)
- 12.2.5 Indaver BV
- 12.2.5.1. Overview
- 12.2.5.2. Products
- 12.2.5.3. SWOT Analysis
- 12.2.5.4. Recent Developments
- 12.2.5.5. Financials (Based on Availability)
- 12.2.6 Dutch Incinerators BV
- 12.2.6.1. Overview
- 12.2.6.2. Products
- 12.2.6.3. SWOT Analysis
- 12.2.6.4. Recent Developments
- 12.2.6.5. Financials (Based on Availability)
- 12.2.7 AEB Amsterdam
- 12.2.7.1. Overview
- 12.2.7.2. Products
- 12.2.7.3. SWOT Analysis
- 12.2.7.4. Recent Developments
- 12.2.7.5. Financials (Based on Availability)
- 12.2.8 Mitsubishi Heavy Industries Ltd *List Not Exhaustive
- 12.2.8.1. Overview
- 12.2.8.2. Products
- 12.2.8.3. SWOT Analysis
- 12.2.8.4. Recent Developments
- 12.2.8.5. Financials (Based on Availability)
- 12.2.1 Attero BV
List of Figures
- Figure 1: Netherlands Waste to Energy Industry Revenue Breakdown (Million, %) by Product 2024 & 2032
- Figure 2: Netherlands Waste to Energy Industry Share (%) by Company 2024
List of Tables
- Table 1: Netherlands Waste to Energy Industry Revenue Million Forecast, by Region 2019 & 2032
- Table 2: Netherlands Waste to Energy Industry Revenue Million Forecast, by Technology 2019 & 2032
- Table 3: Netherlands Waste to Energy Industry Revenue Million Forecast, by Waste Type 2019 & 2032
- Table 4: Netherlands Waste to Energy Industry Revenue Million Forecast, by End-User 2019 & 2032
- Table 5: Netherlands Waste to Energy Industry Revenue Million Forecast, by Region 2019 & 2032
- Table 6: Netherlands Waste to Energy Industry Revenue Million Forecast, by Country 2019 & 2032
- Table 7: Germany Netherlands Waste to Energy Industry Revenue (Million) Forecast, by Application 2019 & 2032
- Table 8: France Netherlands Waste to Energy Industry Revenue (Million) Forecast, by Application 2019 & 2032
- Table 9: Italy Netherlands Waste to Energy Industry Revenue (Million) Forecast, by Application 2019 & 2032
- Table 10: United Kingdom Netherlands Waste to Energy Industry Revenue (Million) Forecast, by Application 2019 & 2032
- Table 11: Netherlands Netherlands Waste to Energy Industry Revenue (Million) Forecast, by Application 2019 & 2032
- Table 12: Rest of Europe Netherlands Waste to Energy Industry Revenue (Million) Forecast, by Application 2019 & 2032
- Table 13: Netherlands Waste to Energy Industry Revenue Million Forecast, by Technology 2019 & 2032
- Table 14: Netherlands Waste to Energy Industry Revenue Million Forecast, by Waste Type 2019 & 2032
- Table 15: Netherlands Waste to Energy Industry Revenue Million Forecast, by End-User 2019 & 2032
- Table 16: Netherlands Waste to Energy Industry Revenue Million Forecast, by Country 2019 & 2032
Frequently Asked Questions
1. What is the projected Compound Annual Growth Rate (CAGR) of the Netherlands Waste to Energy Industry?
The projected CAGR is approximately 2.10%.
2. Which companies are prominent players in the Netherlands Waste to Energy Industry?
Key companies in the market include Attero BV, Ingenia Consultants & Engineers BV, AEB Bio-energiecentrale BV, Axpo Holdings AG, Indaver BV, Dutch Incinerators BV, AEB Amsterdam, Mitsubishi Heavy Industries Ltd *List Not Exhaustive.
3. What are the main segments of the Netherlands Waste to Energy Industry?
The market segments include Technology, Waste Type, End-User.
4. Can you provide details about the market size?
The market size is estimated to be USD 2.45 Million as of 2022.
5. What are some drivers contributing to market growth?
Supportive Government Policies for Waste-to-Energy Plants4.; Increasing Investments in Waste-to-Energy Industries.
6. What are the notable trends driving market growth?
Thermal Technologies Segment to Dominate the Market.
7. Are there any restraints impacting market growth?
The Strict Regulation Imposed Against the Release of Harmful Gases When Trash is Burned.
8. Can you provide examples of recent developments in the market?
January 2023: RWE received USD 117 million from the European Union's Innovation Fund to help build a waste-to-hydrogen project in an industrial cluster in the Netherlands.
9. What pricing options are available for accessing the report?
Pricing options include single-user, multi-user, and enterprise licenses priced at USD 3800, USD 4500, and USD 5800 respectively.
10. Is the market size provided in terms of value or volume?
The market size is provided in terms of value, measured in Million.
11. Are there any specific market keywords associated with the report?
Yes, the market keyword associated with the report is "Netherlands Waste to Energy Industry," which aids in identifying and referencing the specific market segment covered.
12. How do I determine which pricing option suits my needs best?
The pricing options vary based on user requirements and access needs. Individual users may opt for single-user licenses, while businesses requiring broader access may choose multi-user or enterprise licenses for cost-effective access to the report.
13. Are there any additional resources or data provided in the Netherlands Waste to Energy Industry report?
While the report offers comprehensive insights, it's advisable to review the specific contents or supplementary materials provided to ascertain if additional resources or data are available.
14. How can I stay updated on further developments or reports in the Netherlands Waste to Energy Industry?
To stay informed about further developments, trends, and reports in the Netherlands Waste to Energy Industry, consider subscribing to industry newsletters, following relevant companies and organizations, or regularly checking reputable industry news sources and publications.
Methodology
Step 1 - Identification of Relevant Samples Size from Population Database


Step 2 - Approaches for Defining Global Market Size (Value, Volume* & Price*)

Note*: In applicable scenarios
Step 3 - Data Sources
Primary Research
- Web Analytics
- Survey Reports
- Research Institute
- Latest Research Reports
- Opinion Leaders
Secondary Research
- Annual Reports
- White Paper
- Latest Press Release
- Industry Association
- Paid Database
- Investor Presentations

Step 4 - Data Triangulation
Involves using different sources of information in order to increase the validity of a study
These sources are likely to be stakeholders in a program - participants, other researchers, program staff, other community members, and so on.
Then we put all data in single framework & apply various statistical tools to find out the dynamic on the market.
During the analysis stage, feedback from the stakeholder groups would be compared to determine areas of agreement as well as areas of divergence


