
Key Insights
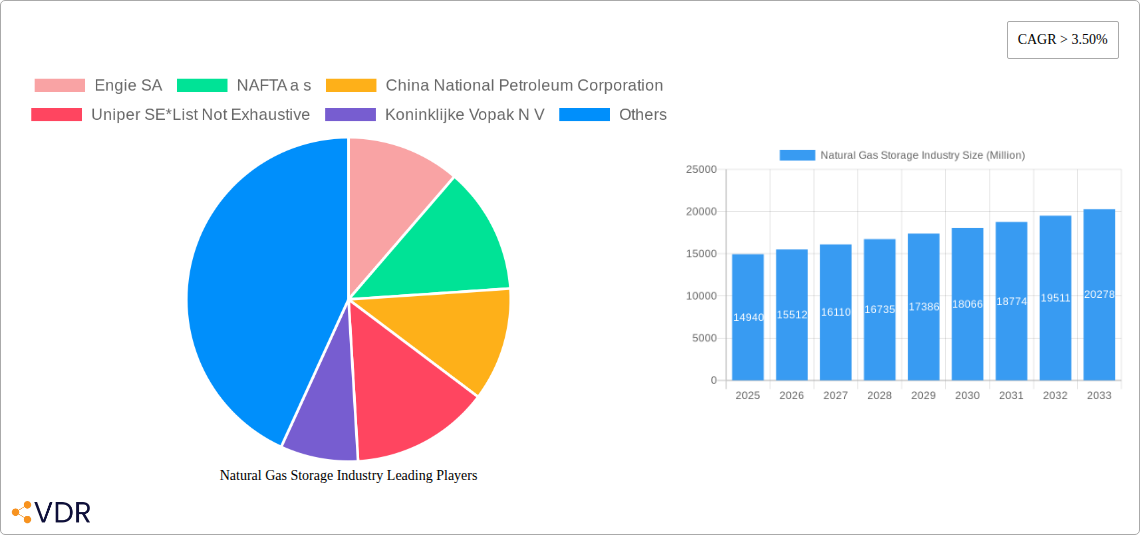
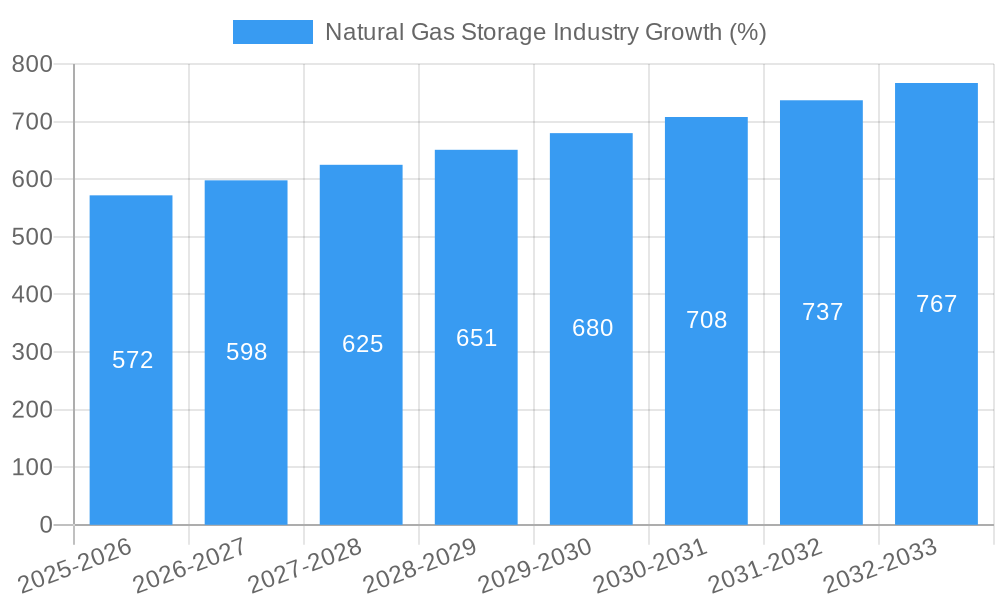
The global natural gas storage market, valued at $14,940 million in 2025, is poised for significant growth, exhibiting a Compound Annual Growth Rate (CAGR) exceeding 3.50% from 2025 to 2033. This expansion is fueled by several key factors. Increasing demand for natural gas as a cleaner-burning fossil fuel, coupled with the intermittent nature of renewable energy sources, necessitates robust storage infrastructure to ensure energy security and grid stability. Government regulations promoting energy diversification and the transition towards cleaner energy sources are further bolstering market growth. Technological advancements in storage solutions, such as the development of more efficient and safer underground storage facilities and improved above-ground storage technologies, are also contributing to market expansion. The increasing adoption of liquefied natural gas (LNG) further drives the need for efficient storage capabilities. However, the market faces challenges such as high initial investment costs associated with building new storage facilities, stringent safety regulations and environmental concerns related to potential methane leaks, and the geographical limitations of suitable storage sites.
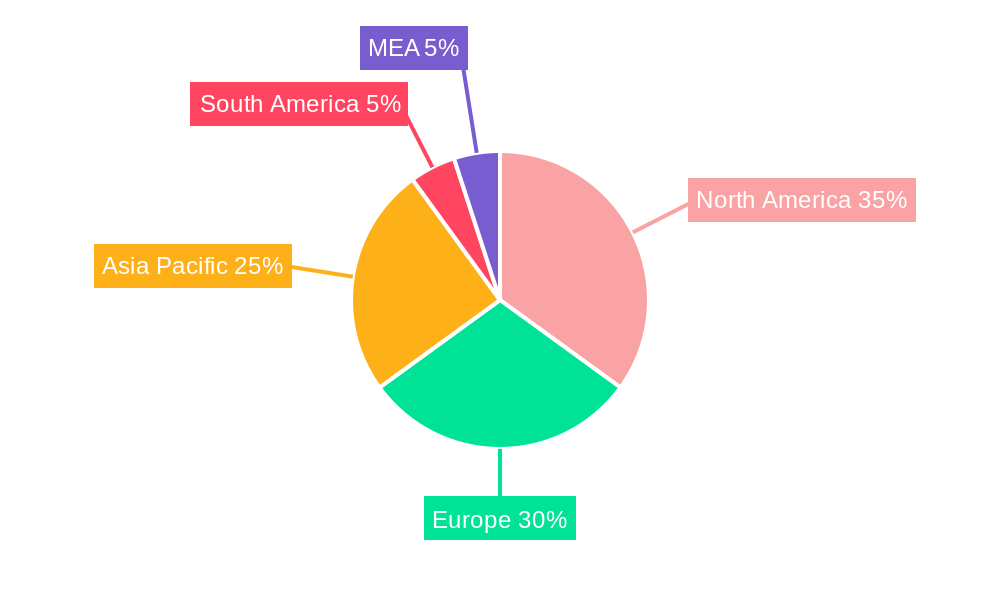
The market is segmented by storage type, with underground and above-ground storage dominating. Geographically, North America, Europe, and Asia Pacific represent the largest market shares, driven by robust energy consumption and established infrastructure. Key players such as Engie SA, Uniper SE, and China National Petroleum Corporation are actively shaping the market through strategic investments, expansions, and technological innovations. While North America currently holds a substantial market share, Asia Pacific is projected to witness substantial growth due to rising energy demand and infrastructure development in rapidly developing economies like China and India. The forecast period (2025-2033) will see intense competition among existing players and the emergence of new entrants seeking to capitalize on the market's growth potential. The continued focus on sustainability and reduced carbon emissions will likely drive innovation in storage technologies, leading to more environmentally friendly and cost-effective solutions.
This in-depth report provides a comprehensive analysis of the Natural Gas Storage Industry, encompassing market dynamics, growth trends, regional insights, and key player strategies. With a study period spanning 2019-2033, a base year of 2025, and a forecast period of 2025-2033, this report offers invaluable insights for industry professionals, investors, and stakeholders seeking to navigate this evolving landscape. The report covers both parent (Energy Storage) and child (Natural Gas Storage) markets for enhanced relevance.
Natural Gas Storage Industry Market Dynamics & Structure
This section analyzes the market concentration, technological innovation, regulatory frameworks, competitive landscape, end-user demographics, and mergers & acquisitions (M&A) activities within the natural gas storage industry. The global market size in 2024 was estimated at xx Million, with a projected value of xx Million by 2033.
- Market Concentration: The industry exhibits a moderately concentrated structure, with a few major players holding significant market share. Market share fragmentation is expected to increase slightly by 2033 due to increased competition.
- Technological Innovation: Technological advancements, such as improved underground storage techniques and advanced monitoring systems, are driving market growth. However, high initial investment costs pose a barrier to entry for smaller players.
- Regulatory Frameworks: Government regulations concerning safety, environmental protection, and security are shaping industry practices. Variability in regulatory frameworks across different regions impacts investment decisions.
- Competitive Landscape: Key players compete based on storage capacity, geographical reach, technological expertise, and service offerings. Competition is intensifying with the emergence of new technologies and players.
- M&A Activity: The industry has witnessed a moderate level of M&A activity in recent years, driven by the need to expand capacity, access new technologies, and gain market share. xx M&A deals were recorded between 2019 and 2024, with an estimated xx Million in total deal value. The average deal size increased from xx Million in 2019 to xx Million in 2024.
- End-User Demographics: The primary end-users are power generation companies, industrial consumers, and natural gas distribution companies. Demand is closely tied to energy consumption patterns and government policies.
Natural Gas Storage Industry Growth Trends & Insights
This section leverages a robust methodology (XXX) to analyze the evolution of the natural gas storage market size, adoption rates, technological disruptions, and shifts in consumer behavior. The market is projected to exhibit a CAGR of xx% during the forecast period (2025-2033).
(600 words of detailed analysis using the provided methodology, incorporating specific metrics like CAGR, market penetration rates, and detailed explanations of identified growth trends and market shifts. This section should clearly address technological disruption and its impact on the industry dynamics and consumer behavior.)
Dominant Regions, Countries, or Segments in Natural Gas Storage Industry
This section identifies the leading regions, countries, and segments (Underground Storage and Above-Ground Storage) driving market growth.
- Dominant Region: [Insert Dominant Region - e.g., North America] holds the largest market share due to [Reasons - e.g., existing infrastructure, supportive government policies, high natural gas consumption].
- Dominant Country: [Insert Dominant Country - e.g., United States] within [Dominant Region] is a key contributor to overall market growth, driven by [Factors - e.g., extensive pipeline network, high industrial demand].
- Dominant Segment: [Insert Dominant Segment - e.g., Underground Storage] is the dominant segment, accounting for xx% of the total market in 2024, mainly due to its higher storage capacity and lower cost compared to above-ground storage.
(600 words of detailed analysis. Include bullet points outlining key drivers for each dominant region, country, and segment, and expand on the dominance factors including market share and growth potential with specific data and supporting explanations.)
Natural Gas Storage Industry Product Landscape
The natural gas storage industry offers a range of solutions, including underground storage (salt caverns, depleted gas fields, aquifers) and above-ground storage (LNG tanks, compressed natural gas (CNG) storage). Recent innovations focus on enhancing storage capacity, safety, and efficiency. Advanced monitoring systems and predictive analytics are improving operational efficiency and reducing risks. The key selling propositions center on safety, reliability, and cost-effectiveness, along with environmental considerations like methane leakage reduction.
Key Drivers, Barriers & Challenges in Natural Gas Storage Industry
Key Drivers:
- Growing demand for natural gas driven by power generation and industrial applications.
- Government initiatives promoting natural gas as a transition fuel.
- Technological advancements enhancing storage capacity and efficiency.
- Strategic partnerships and collaborations within the industry.
Challenges:
- High capital expenditure required for building new storage facilities.
- Stringent environmental regulations regarding methane emissions.
- Supply chain disruptions affecting the availability of specialized equipment and materials.
- Geopolitical factors impacting natural gas prices and availability. These factors can cause price volatility and negatively impact investment decisions. For example, a 10% increase in steel prices can potentially increase construction costs for underground facilities by xx Million.
Emerging Opportunities in Natural Gas Storage Industry
Emerging opportunities lie in:
- Expanding storage capacity in developing economies with growing energy demands.
- Development of innovative storage technologies, such as hydrogen storage in depleted gas fields.
- Integration of renewable energy sources with natural gas storage facilities to enhance grid stability.
- Utilizing advanced analytics and machine learning for better storage optimization.
Growth Accelerators in the Natural Gas Storage Industry
Long-term growth is driven by technological breakthroughs, such as the development of more efficient and safer storage systems. Strategic partnerships between storage operators, gas producers, and energy companies are creating synergies and optimizing resource allocation. Furthermore, expansion into new markets with significant natural gas consumption is contributing to the industry's growth trajectory.
Key Players Shaping the Natural Gas Storage Industry Market
- Engie SA
- NAFTA a s
- China National Petroleum Corporation
- Uniper SE
- Koninklijke Vopak N V
- Enbridge Inc
- Chiyoda Corporation
- John Wood Group PLC
- Gazprom PAO
- Costain Group PLC
Notable Milestones in Natural Gas Storage Industry Sector
- 2020: [Specific example of technological innovation in storage systems].
- 2021: [Specific example of expansion of storage capacity in a key region].
- 2022: [Specific example of a government initiative to promote natural gas storage].
- 2023: [Specific example of a partnership to enhance storage efficiency]. (Include further examples as available)
In-Depth Natural Gas Storage Industry Market Outlook
The future of the natural gas storage industry appears robust, driven by sustained demand for natural gas, ongoing technological advancements, and strategic collaborations. The focus on efficiency, safety, and environmental sustainability will shape future developments. Companies that embrace innovation, strategic partnerships, and a focus on operational excellence are poised to capture significant market share in this growing sector. The market is expected to reach xx Million by 2033, presenting substantial opportunities for investors and industry players.
Natural Gas Storage Industry Segmentation
-
1. Type
- 1.1. Underground Storage
- 1.2. Above-Ground Storage
Natural Gas Storage Industry Segmentation By Geography
- 1. North America
- 2. Europe
- 3. Asia Pacific
- 4. South America
- 5. Middle East and Africa
Natural Gas Storage Industry REPORT HIGHLIGHTS
| Aspects | Details |
|---|---|
| Study Period | 2019-2033 |
| Base Year | 2024 |
| Estimated Year | 2025 |
| Forecast Period | 2025-2033 |
| Historical Period | 2019-2024 |
| Growth Rate | CAGR of > 3.50% from 2019-2033 |
| Segmentation |
|
Table of Contents
- 1. Introduction
- 1.1. Research Scope
- 1.2. Market Segmentation
- 1.3. Research Methodology
- 1.4. Definitions and Assumptions
- 2. Executive Summary
- 2.1. Introduction
- 3. Market Dynamics
- 3.1. Introduction
- 3.2. Market Drivers
- 3.2.1. 4.; Increasing Electricity Demand4.; Rsing Investments in the Coal Industry
- 3.3. Market Restrains
- 3.3.1. 4.; Increasing Installation of Renewable Energy Sources
- 3.4. Market Trends
- 3.4.1. Underground Storage to Dominate the Market
- 4. Market Factor Analysis
- 4.1. Porters Five Forces
- 4.2. Supply/Value Chain
- 4.3. PESTEL analysis
- 4.4. Market Entropy
- 4.5. Patent/Trademark Analysis
- 5. Global Natural Gas Storage Industry Analysis, Insights and Forecast, 2019-2031
- 5.1. Market Analysis, Insights and Forecast - by Type
- 5.1.1. Underground Storage
- 5.1.2. Above-Ground Storage
- 5.2. Market Analysis, Insights and Forecast - by Region
- 5.2.1. North America
- 5.2.2. Europe
- 5.2.3. Asia Pacific
- 5.2.4. South America
- 5.2.5. Middle East and Africa
- 5.1. Market Analysis, Insights and Forecast - by Type
- 6. North America Natural Gas Storage Industry Analysis, Insights and Forecast, 2019-2031
- 6.1. Market Analysis, Insights and Forecast - by Type
- 6.1.1. Underground Storage
- 6.1.2. Above-Ground Storage
- 6.1. Market Analysis, Insights and Forecast - by Type
- 7. Europe Natural Gas Storage Industry Analysis, Insights and Forecast, 2019-2031
- 7.1. Market Analysis, Insights and Forecast - by Type
- 7.1.1. Underground Storage
- 7.1.2. Above-Ground Storage
- 7.1. Market Analysis, Insights and Forecast - by Type
- 8. Asia Pacific Natural Gas Storage Industry Analysis, Insights and Forecast, 2019-2031
- 8.1. Market Analysis, Insights and Forecast - by Type
- 8.1.1. Underground Storage
- 8.1.2. Above-Ground Storage
- 8.1. Market Analysis, Insights and Forecast - by Type
- 9. South America Natural Gas Storage Industry Analysis, Insights and Forecast, 2019-2031
- 9.1. Market Analysis, Insights and Forecast - by Type
- 9.1.1. Underground Storage
- 9.1.2. Above-Ground Storage
- 9.1. Market Analysis, Insights and Forecast - by Type
- 10. Middle East and Africa Natural Gas Storage Industry Analysis, Insights and Forecast, 2019-2031
- 10.1. Market Analysis, Insights and Forecast - by Type
- 10.1.1. Underground Storage
- 10.1.2. Above-Ground Storage
- 10.1. Market Analysis, Insights and Forecast - by Type
- 11. North America Natural Gas Storage Industry Analysis, Insights and Forecast, 2019-2031
- 11.1. Market Analysis, Insights and Forecast - By Country/Sub-region
- 11.1.1 United States
- 11.1.2 Canada
- 11.1.3 Mexico
- 12. Europe Natural Gas Storage Industry Analysis, Insights and Forecast, 2019-2031
- 12.1. Market Analysis, Insights and Forecast - By Country/Sub-region
- 12.1.1 Germany
- 12.1.2 United Kingdom
- 12.1.3 France
- 12.1.4 Spain
- 12.1.5 Italy
- 12.1.6 Spain
- 12.1.7 Belgium
- 12.1.8 Netherland
- 12.1.9 Nordics
- 12.1.10 Rest of Europe
- 13. Asia Pacific Natural Gas Storage Industry Analysis, Insights and Forecast, 2019-2031
- 13.1. Market Analysis, Insights and Forecast - By Country/Sub-region
- 13.1.1 China
- 13.1.2 Japan
- 13.1.3 India
- 13.1.4 South Korea
- 13.1.5 Southeast Asia
- 13.1.6 Australia
- 13.1.7 Indonesia
- 13.1.8 Phillipes
- 13.1.9 Singapore
- 13.1.10 Thailandc
- 13.1.11 Rest of Asia Pacific
- 14. South America Natural Gas Storage Industry Analysis, Insights and Forecast, 2019-2031
- 14.1. Market Analysis, Insights and Forecast - By Country/Sub-region
- 14.1.1 Brazil
- 14.1.2 Argentina
- 14.1.3 Peru
- 14.1.4 Chile
- 14.1.5 Colombia
- 14.1.6 Ecuador
- 14.1.7 Venezuela
- 14.1.8 Rest of South America
- 15. North America Natural Gas Storage Industry Analysis, Insights and Forecast, 2019-2031
- 15.1. Market Analysis, Insights and Forecast - By Country/Sub-region
- 15.1.1 United States
- 15.1.2 Canada
- 15.1.3 Mexico
- 16. MEA Natural Gas Storage Industry Analysis, Insights and Forecast, 2019-2031
- 16.1. Market Analysis, Insights and Forecast - By Country/Sub-region
- 16.1.1 United Arab Emirates
- 16.1.2 Saudi Arabia
- 16.1.3 South Africa
- 16.1.4 Rest of Middle East and Africa
- 17. Competitive Analysis
- 17.1. Global Market Share Analysis 2024
- 17.2. Company Profiles
- 17.2.1 Engie SA
- 17.2.1.1. Overview
- 17.2.1.2. Products
- 17.2.1.3. SWOT Analysis
- 17.2.1.4. Recent Developments
- 17.2.1.5. Financials (Based on Availability)
- 17.2.2 NAFTA a s
- 17.2.2.1. Overview
- 17.2.2.2. Products
- 17.2.2.3. SWOT Analysis
- 17.2.2.4. Recent Developments
- 17.2.2.5. Financials (Based on Availability)
- 17.2.3 China National Petroleum Corporation
- 17.2.3.1. Overview
- 17.2.3.2. Products
- 17.2.3.3. SWOT Analysis
- 17.2.3.4. Recent Developments
- 17.2.3.5. Financials (Based on Availability)
- 17.2.4 Uniper SE*List Not Exhaustive
- 17.2.4.1. Overview
- 17.2.4.2. Products
- 17.2.4.3. SWOT Analysis
- 17.2.4.4. Recent Developments
- 17.2.4.5. Financials (Based on Availability)
- 17.2.5 Koninklijke Vopak N V
- 17.2.5.1. Overview
- 17.2.5.2. Products
- 17.2.5.3. SWOT Analysis
- 17.2.5.4. Recent Developments
- 17.2.5.5. Financials (Based on Availability)
- 17.2.6 Enbridge Inc
- 17.2.6.1. Overview
- 17.2.6.2. Products
- 17.2.6.3. SWOT Analysis
- 17.2.6.4. Recent Developments
- 17.2.6.5. Financials (Based on Availability)
- 17.2.7 Chiyoda Corporation
- 17.2.7.1. Overview
- 17.2.7.2. Products
- 17.2.7.3. SWOT Analysis
- 17.2.7.4. Recent Developments
- 17.2.7.5. Financials (Based on Availability)
- 17.2.8 John Wood Group PLC
- 17.2.8.1. Overview
- 17.2.8.2. Products
- 17.2.8.3. SWOT Analysis
- 17.2.8.4. Recent Developments
- 17.2.8.5. Financials (Based on Availability)
- 17.2.9 Gazprom PAO
- 17.2.9.1. Overview
- 17.2.9.2. Products
- 17.2.9.3. SWOT Analysis
- 17.2.9.4. Recent Developments
- 17.2.9.5. Financials (Based on Availability)
- 17.2.10 Costain Group PLC
- 17.2.10.1. Overview
- 17.2.10.2. Products
- 17.2.10.3. SWOT Analysis
- 17.2.10.4. Recent Developments
- 17.2.10.5. Financials (Based on Availability)
- 17.2.1 Engie SA
List of Figures
- Figure 1: Global Natural Gas Storage Industry Revenue Breakdown (Million, %) by Region 2024 & 2032
- Figure 2: Global Natural Gas Storage Industry Volume Breakdown (K Tons, %) by Region 2024 & 2032
- Figure 3: North America Natural Gas Storage Industry Revenue (Million), by Country 2024 & 2032
- Figure 4: North America Natural Gas Storage Industry Volume (K Tons), by Country 2024 & 2032
- Figure 5: North America Natural Gas Storage Industry Revenue Share (%), by Country 2024 & 2032
- Figure 6: North America Natural Gas Storage Industry Volume Share (%), by Country 2024 & 2032
- Figure 7: Europe Natural Gas Storage Industry Revenue (Million), by Country 2024 & 2032
- Figure 8: Europe Natural Gas Storage Industry Volume (K Tons), by Country 2024 & 2032
- Figure 9: Europe Natural Gas Storage Industry Revenue Share (%), by Country 2024 & 2032
- Figure 10: Europe Natural Gas Storage Industry Volume Share (%), by Country 2024 & 2032
- Figure 11: Asia Pacific Natural Gas Storage Industry Revenue (Million), by Country 2024 & 2032
- Figure 12: Asia Pacific Natural Gas Storage Industry Volume (K Tons), by Country 2024 & 2032
- Figure 13: Asia Pacific Natural Gas Storage Industry Revenue Share (%), by Country 2024 & 2032
- Figure 14: Asia Pacific Natural Gas Storage Industry Volume Share (%), by Country 2024 & 2032
- Figure 15: South America Natural Gas Storage Industry Revenue (Million), by Country 2024 & 2032
- Figure 16: South America Natural Gas Storage Industry Volume (K Tons), by Country 2024 & 2032
- Figure 17: South America Natural Gas Storage Industry Revenue Share (%), by Country 2024 & 2032
- Figure 18: South America Natural Gas Storage Industry Volume Share (%), by Country 2024 & 2032
- Figure 19: North America Natural Gas Storage Industry Revenue (Million), by Country 2024 & 2032
- Figure 20: North America Natural Gas Storage Industry Volume (K Tons), by Country 2024 & 2032
- Figure 21: North America Natural Gas Storage Industry Revenue Share (%), by Country 2024 & 2032
- Figure 22: North America Natural Gas Storage Industry Volume Share (%), by Country 2024 & 2032
- Figure 23: MEA Natural Gas Storage Industry Revenue (Million), by Country 2024 & 2032
- Figure 24: MEA Natural Gas Storage Industry Volume (K Tons), by Country 2024 & 2032
- Figure 25: MEA Natural Gas Storage Industry Revenue Share (%), by Country 2024 & 2032
- Figure 26: MEA Natural Gas Storage Industry Volume Share (%), by Country 2024 & 2032
- Figure 27: North America Natural Gas Storage Industry Revenue (Million), by Type 2024 & 2032
- Figure 28: North America Natural Gas Storage Industry Volume (K Tons), by Type 2024 & 2032
- Figure 29: North America Natural Gas Storage Industry Revenue Share (%), by Type 2024 & 2032
- Figure 30: North America Natural Gas Storage Industry Volume Share (%), by Type 2024 & 2032
- Figure 31: North America Natural Gas Storage Industry Revenue (Million), by Country 2024 & 2032
- Figure 32: North America Natural Gas Storage Industry Volume (K Tons), by Country 2024 & 2032
- Figure 33: North America Natural Gas Storage Industry Revenue Share (%), by Country 2024 & 2032
- Figure 34: North America Natural Gas Storage Industry Volume Share (%), by Country 2024 & 2032
- Figure 35: Europe Natural Gas Storage Industry Revenue (Million), by Type 2024 & 2032
- Figure 36: Europe Natural Gas Storage Industry Volume (K Tons), by Type 2024 & 2032
- Figure 37: Europe Natural Gas Storage Industry Revenue Share (%), by Type 2024 & 2032
- Figure 38: Europe Natural Gas Storage Industry Volume Share (%), by Type 2024 & 2032
- Figure 39: Europe Natural Gas Storage Industry Revenue (Million), by Country 2024 & 2032
- Figure 40: Europe Natural Gas Storage Industry Volume (K Tons), by Country 2024 & 2032
- Figure 41: Europe Natural Gas Storage Industry Revenue Share (%), by Country 2024 & 2032
- Figure 42: Europe Natural Gas Storage Industry Volume Share (%), by Country 2024 & 2032
- Figure 43: Asia Pacific Natural Gas Storage Industry Revenue (Million), by Type 2024 & 2032
- Figure 44: Asia Pacific Natural Gas Storage Industry Volume (K Tons), by Type 2024 & 2032
- Figure 45: Asia Pacific Natural Gas Storage Industry Revenue Share (%), by Type 2024 & 2032
- Figure 46: Asia Pacific Natural Gas Storage Industry Volume Share (%), by Type 2024 & 2032
- Figure 47: Asia Pacific Natural Gas Storage Industry Revenue (Million), by Country 2024 & 2032
- Figure 48: Asia Pacific Natural Gas Storage Industry Volume (K Tons), by Country 2024 & 2032
- Figure 49: Asia Pacific Natural Gas Storage Industry Revenue Share (%), by Country 2024 & 2032
- Figure 50: Asia Pacific Natural Gas Storage Industry Volume Share (%), by Country 2024 & 2032
- Figure 51: South America Natural Gas Storage Industry Revenue (Million), by Type 2024 & 2032
- Figure 52: South America Natural Gas Storage Industry Volume (K Tons), by Type 2024 & 2032
- Figure 53: South America Natural Gas Storage Industry Revenue Share (%), by Type 2024 & 2032
- Figure 54: South America Natural Gas Storage Industry Volume Share (%), by Type 2024 & 2032
- Figure 55: South America Natural Gas Storage Industry Revenue (Million), by Country 2024 & 2032
- Figure 56: South America Natural Gas Storage Industry Volume (K Tons), by Country 2024 & 2032
- Figure 57: South America Natural Gas Storage Industry Revenue Share (%), by Country 2024 & 2032
- Figure 58: South America Natural Gas Storage Industry Volume Share (%), by Country 2024 & 2032
- Figure 59: Middle East and Africa Natural Gas Storage Industry Revenue (Million), by Type 2024 & 2032
- Figure 60: Middle East and Africa Natural Gas Storage Industry Volume (K Tons), by Type 2024 & 2032
- Figure 61: Middle East and Africa Natural Gas Storage Industry Revenue Share (%), by Type 2024 & 2032
- Figure 62: Middle East and Africa Natural Gas Storage Industry Volume Share (%), by Type 2024 & 2032
- Figure 63: Middle East and Africa Natural Gas Storage Industry Revenue (Million), by Country 2024 & 2032
- Figure 64: Middle East and Africa Natural Gas Storage Industry Volume (K Tons), by Country 2024 & 2032
- Figure 65: Middle East and Africa Natural Gas Storage Industry Revenue Share (%), by Country 2024 & 2032
- Figure 66: Middle East and Africa Natural Gas Storage Industry Volume Share (%), by Country 2024 & 2032
List of Tables
- Table 1: Global Natural Gas Storage Industry Revenue Million Forecast, by Region 2019 & 2032
- Table 2: Global Natural Gas Storage Industry Volume K Tons Forecast, by Region 2019 & 2032
- Table 3: Global Natural Gas Storage Industry Revenue Million Forecast, by Type 2019 & 2032
- Table 4: Global Natural Gas Storage Industry Volume K Tons Forecast, by Type 2019 & 2032
- Table 5: Global Natural Gas Storage Industry Revenue Million Forecast, by Region 2019 & 2032
- Table 6: Global Natural Gas Storage Industry Volume K Tons Forecast, by Region 2019 & 2032
- Table 7: Global Natural Gas Storage Industry Revenue Million Forecast, by Country 2019 & 2032
- Table 8: Global Natural Gas Storage Industry Volume K Tons Forecast, by Country 2019 & 2032
- Table 9: United States Natural Gas Storage Industry Revenue (Million) Forecast, by Application 2019 & 2032
- Table 10: United States Natural Gas Storage Industry Volume (K Tons) Forecast, by Application 2019 & 2032
- Table 11: Canada Natural Gas Storage Industry Revenue (Million) Forecast, by Application 2019 & 2032
- Table 12: Canada Natural Gas Storage Industry Volume (K Tons) Forecast, by Application 2019 & 2032
- Table 13: Mexico Natural Gas Storage Industry Revenue (Million) Forecast, by Application 2019 & 2032
- Table 14: Mexico Natural Gas Storage Industry Volume (K Tons) Forecast, by Application 2019 & 2032
- Table 15: Global Natural Gas Storage Industry Revenue Million Forecast, by Country 2019 & 2032
- Table 16: Global Natural Gas Storage Industry Volume K Tons Forecast, by Country 2019 & 2032
- Table 17: Germany Natural Gas Storage Industry Revenue (Million) Forecast, by Application 2019 & 2032
- Table 18: Germany Natural Gas Storage Industry Volume (K Tons) Forecast, by Application 2019 & 2032
- Table 19: United Kingdom Natural Gas Storage Industry Revenue (Million) Forecast, by Application 2019 & 2032
- Table 20: United Kingdom Natural Gas Storage Industry Volume (K Tons) Forecast, by Application 2019 & 2032
- Table 21: France Natural Gas Storage Industry Revenue (Million) Forecast, by Application 2019 & 2032
- Table 22: France Natural Gas Storage Industry Volume (K Tons) Forecast, by Application 2019 & 2032
- Table 23: Spain Natural Gas Storage Industry Revenue (Million) Forecast, by Application 2019 & 2032
- Table 24: Spain Natural Gas Storage Industry Volume (K Tons) Forecast, by Application 2019 & 2032
- Table 25: Italy Natural Gas Storage Industry Revenue (Million) Forecast, by Application 2019 & 2032
- Table 26: Italy Natural Gas Storage Industry Volume (K Tons) Forecast, by Application 2019 & 2032
- Table 27: Spain Natural Gas Storage Industry Revenue (Million) Forecast, by Application 2019 & 2032
- Table 28: Spain Natural Gas Storage Industry Volume (K Tons) Forecast, by Application 2019 & 2032
- Table 29: Belgium Natural Gas Storage Industry Revenue (Million) Forecast, by Application 2019 & 2032
- Table 30: Belgium Natural Gas Storage Industry Volume (K Tons) Forecast, by Application 2019 & 2032
- Table 31: Netherland Natural Gas Storage Industry Revenue (Million) Forecast, by Application 2019 & 2032
- Table 32: Netherland Natural Gas Storage Industry Volume (K Tons) Forecast, by Application 2019 & 2032
- Table 33: Nordics Natural Gas Storage Industry Revenue (Million) Forecast, by Application 2019 & 2032
- Table 34: Nordics Natural Gas Storage Industry Volume (K Tons) Forecast, by Application 2019 & 2032
- Table 35: Rest of Europe Natural Gas Storage Industry Revenue (Million) Forecast, by Application 2019 & 2032
- Table 36: Rest of Europe Natural Gas Storage Industry Volume (K Tons) Forecast, by Application 2019 & 2032
- Table 37: Global Natural Gas Storage Industry Revenue Million Forecast, by Country 2019 & 2032
- Table 38: Global Natural Gas Storage Industry Volume K Tons Forecast, by Country 2019 & 2032
- Table 39: China Natural Gas Storage Industry Revenue (Million) Forecast, by Application 2019 & 2032
- Table 40: China Natural Gas Storage Industry Volume (K Tons) Forecast, by Application 2019 & 2032
- Table 41: Japan Natural Gas Storage Industry Revenue (Million) Forecast, by Application 2019 & 2032
- Table 42: Japan Natural Gas Storage Industry Volume (K Tons) Forecast, by Application 2019 & 2032
- Table 43: India Natural Gas Storage Industry Revenue (Million) Forecast, by Application 2019 & 2032
- Table 44: India Natural Gas Storage Industry Volume (K Tons) Forecast, by Application 2019 & 2032
- Table 45: South Korea Natural Gas Storage Industry Revenue (Million) Forecast, by Application 2019 & 2032
- Table 46: South Korea Natural Gas Storage Industry Volume (K Tons) Forecast, by Application 2019 & 2032
- Table 47: Southeast Asia Natural Gas Storage Industry Revenue (Million) Forecast, by Application 2019 & 2032
- Table 48: Southeast Asia Natural Gas Storage Industry Volume (K Tons) Forecast, by Application 2019 & 2032
- Table 49: Australia Natural Gas Storage Industry Revenue (Million) Forecast, by Application 2019 & 2032
- Table 50: Australia Natural Gas Storage Industry Volume (K Tons) Forecast, by Application 2019 & 2032
- Table 51: Indonesia Natural Gas Storage Industry Revenue (Million) Forecast, by Application 2019 & 2032
- Table 52: Indonesia Natural Gas Storage Industry Volume (K Tons) Forecast, by Application 2019 & 2032
- Table 53: Phillipes Natural Gas Storage Industry Revenue (Million) Forecast, by Application 2019 & 2032
- Table 54: Phillipes Natural Gas Storage Industry Volume (K Tons) Forecast, by Application 2019 & 2032
- Table 55: Singapore Natural Gas Storage Industry Revenue (Million) Forecast, by Application 2019 & 2032
- Table 56: Singapore Natural Gas Storage Industry Volume (K Tons) Forecast, by Application 2019 & 2032
- Table 57: Thailandc Natural Gas Storage Industry Revenue (Million) Forecast, by Application 2019 & 2032
- Table 58: Thailandc Natural Gas Storage Industry Volume (K Tons) Forecast, by Application 2019 & 2032
- Table 59: Rest of Asia Pacific Natural Gas Storage Industry Revenue (Million) Forecast, by Application 2019 & 2032
- Table 60: Rest of Asia Pacific Natural Gas Storage Industry Volume (K Tons) Forecast, by Application 2019 & 2032
- Table 61: Global Natural Gas Storage Industry Revenue Million Forecast, by Country 2019 & 2032
- Table 62: Global Natural Gas Storage Industry Volume K Tons Forecast, by Country 2019 & 2032
- Table 63: Brazil Natural Gas Storage Industry Revenue (Million) Forecast, by Application 2019 & 2032
- Table 64: Brazil Natural Gas Storage Industry Volume (K Tons) Forecast, by Application 2019 & 2032
- Table 65: Argentina Natural Gas Storage Industry Revenue (Million) Forecast, by Application 2019 & 2032
- Table 66: Argentina Natural Gas Storage Industry Volume (K Tons) Forecast, by Application 2019 & 2032
- Table 67: Peru Natural Gas Storage Industry Revenue (Million) Forecast, by Application 2019 & 2032
- Table 68: Peru Natural Gas Storage Industry Volume (K Tons) Forecast, by Application 2019 & 2032
- Table 69: Chile Natural Gas Storage Industry Revenue (Million) Forecast, by Application 2019 & 2032
- Table 70: Chile Natural Gas Storage Industry Volume (K Tons) Forecast, by Application 2019 & 2032
- Table 71: Colombia Natural Gas Storage Industry Revenue (Million) Forecast, by Application 2019 & 2032
- Table 72: Colombia Natural Gas Storage Industry Volume (K Tons) Forecast, by Application 2019 & 2032
- Table 73: Ecuador Natural Gas Storage Industry Revenue (Million) Forecast, by Application 2019 & 2032
- Table 74: Ecuador Natural Gas Storage Industry Volume (K Tons) Forecast, by Application 2019 & 2032
- Table 75: Venezuela Natural Gas Storage Industry Revenue (Million) Forecast, by Application 2019 & 2032
- Table 76: Venezuela Natural Gas Storage Industry Volume (K Tons) Forecast, by Application 2019 & 2032
- Table 77: Rest of South America Natural Gas Storage Industry Revenue (Million) Forecast, by Application 2019 & 2032
- Table 78: Rest of South America Natural Gas Storage Industry Volume (K Tons) Forecast, by Application 2019 & 2032
- Table 79: Global Natural Gas Storage Industry Revenue Million Forecast, by Country 2019 & 2032
- Table 80: Global Natural Gas Storage Industry Volume K Tons Forecast, by Country 2019 & 2032
- Table 81: United States Natural Gas Storage Industry Revenue (Million) Forecast, by Application 2019 & 2032
- Table 82: United States Natural Gas Storage Industry Volume (K Tons) Forecast, by Application 2019 & 2032
- Table 83: Canada Natural Gas Storage Industry Revenue (Million) Forecast, by Application 2019 & 2032
- Table 84: Canada Natural Gas Storage Industry Volume (K Tons) Forecast, by Application 2019 & 2032
- Table 85: Mexico Natural Gas Storage Industry Revenue (Million) Forecast, by Application 2019 & 2032
- Table 86: Mexico Natural Gas Storage Industry Volume (K Tons) Forecast, by Application 2019 & 2032
- Table 87: Global Natural Gas Storage Industry Revenue Million Forecast, by Country 2019 & 2032
- Table 88: Global Natural Gas Storage Industry Volume K Tons Forecast, by Country 2019 & 2032
- Table 89: United Arab Emirates Natural Gas Storage Industry Revenue (Million) Forecast, by Application 2019 & 2032
- Table 90: United Arab Emirates Natural Gas Storage Industry Volume (K Tons) Forecast, by Application 2019 & 2032
- Table 91: Saudi Arabia Natural Gas Storage Industry Revenue (Million) Forecast, by Application 2019 & 2032
- Table 92: Saudi Arabia Natural Gas Storage Industry Volume (K Tons) Forecast, by Application 2019 & 2032
- Table 93: South Africa Natural Gas Storage Industry Revenue (Million) Forecast, by Application 2019 & 2032
- Table 94: South Africa Natural Gas Storage Industry Volume (K Tons) Forecast, by Application 2019 & 2032
- Table 95: Rest of Middle East and Africa Natural Gas Storage Industry Revenue (Million) Forecast, by Application 2019 & 2032
- Table 96: Rest of Middle East and Africa Natural Gas Storage Industry Volume (K Tons) Forecast, by Application 2019 & 2032
- Table 97: Global Natural Gas Storage Industry Revenue Million Forecast, by Type 2019 & 2032
- Table 98: Global Natural Gas Storage Industry Volume K Tons Forecast, by Type 2019 & 2032
- Table 99: Global Natural Gas Storage Industry Revenue Million Forecast, by Country 2019 & 2032
- Table 100: Global Natural Gas Storage Industry Volume K Tons Forecast, by Country 2019 & 2032
- Table 101: Global Natural Gas Storage Industry Revenue Million Forecast, by Type 2019 & 2032
- Table 102: Global Natural Gas Storage Industry Volume K Tons Forecast, by Type 2019 & 2032
- Table 103: Global Natural Gas Storage Industry Revenue Million Forecast, by Country 2019 & 2032
- Table 104: Global Natural Gas Storage Industry Volume K Tons Forecast, by Country 2019 & 2032
- Table 105: Global Natural Gas Storage Industry Revenue Million Forecast, by Type 2019 & 2032
- Table 106: Global Natural Gas Storage Industry Volume K Tons Forecast, by Type 2019 & 2032
- Table 107: Global Natural Gas Storage Industry Revenue Million Forecast, by Country 2019 & 2032
- Table 108: Global Natural Gas Storage Industry Volume K Tons Forecast, by Country 2019 & 2032
- Table 109: Global Natural Gas Storage Industry Revenue Million Forecast, by Type 2019 & 2032
- Table 110: Global Natural Gas Storage Industry Volume K Tons Forecast, by Type 2019 & 2032
- Table 111: Global Natural Gas Storage Industry Revenue Million Forecast, by Country 2019 & 2032
- Table 112: Global Natural Gas Storage Industry Volume K Tons Forecast, by Country 2019 & 2032
- Table 113: Global Natural Gas Storage Industry Revenue Million Forecast, by Type 2019 & 2032
- Table 114: Global Natural Gas Storage Industry Volume K Tons Forecast, by Type 2019 & 2032
- Table 115: Global Natural Gas Storage Industry Revenue Million Forecast, by Country 2019 & 2032
- Table 116: Global Natural Gas Storage Industry Volume K Tons Forecast, by Country 2019 & 2032
Frequently Asked Questions
1. What is the projected Compound Annual Growth Rate (CAGR) of the Natural Gas Storage Industry?
The projected CAGR is approximately > 3.50%.
2. Which companies are prominent players in the Natural Gas Storage Industry?
Key companies in the market include Engie SA, NAFTA a s, China National Petroleum Corporation, Uniper SE*List Not Exhaustive, Koninklijke Vopak N V, Enbridge Inc, Chiyoda Corporation, John Wood Group PLC, Gazprom PAO, Costain Group PLC.
3. What are the main segments of the Natural Gas Storage Industry?
The market segments include Type.
4. Can you provide details about the market size?
The market size is estimated to be USD 14940 Million as of 2022.
5. What are some drivers contributing to market growth?
4.; Increasing Electricity Demand4.; Rsing Investments in the Coal Industry.
6. What are the notable trends driving market growth?
Underground Storage to Dominate the Market.
7. Are there any restraints impacting market growth?
4.; Increasing Installation of Renewable Energy Sources.
8. Can you provide examples of recent developments in the market?
Technological innovations in storage systems
9. What pricing options are available for accessing the report?
Pricing options include single-user, multi-user, and enterprise licenses priced at USD 4750, USD 5250, and USD 8750 respectively.
10. Is the market size provided in terms of value or volume?
The market size is provided in terms of value, measured in Million and volume, measured in K Tons.
11. Are there any specific market keywords associated with the report?
Yes, the market keyword associated with the report is "Natural Gas Storage Industry," which aids in identifying and referencing the specific market segment covered.
12. How do I determine which pricing option suits my needs best?
The pricing options vary based on user requirements and access needs. Individual users may opt for single-user licenses, while businesses requiring broader access may choose multi-user or enterprise licenses for cost-effective access to the report.
13. Are there any additional resources or data provided in the Natural Gas Storage Industry report?
While the report offers comprehensive insights, it's advisable to review the specific contents or supplementary materials provided to ascertain if additional resources or data are available.
14. How can I stay updated on further developments or reports in the Natural Gas Storage Industry?
To stay informed about further developments, trends, and reports in the Natural Gas Storage Industry, consider subscribing to industry newsletters, following relevant companies and organizations, or regularly checking reputable industry news sources and publications.
Methodology
Step 1 - Identification of Relevant Samples Size from Population Database


Step 2 - Approaches for Defining Global Market Size (Value, Volume* & Price*)

Note*: In applicable scenarios
Step 3 - Data Sources
Primary Research
- Web Analytics
- Survey Reports
- Research Institute
- Latest Research Reports
- Opinion Leaders
Secondary Research
- Annual Reports
- White Paper
- Latest Press Release
- Industry Association
- Paid Database
- Investor Presentations

Step 4 - Data Triangulation
Involves using different sources of information in order to increase the validity of a study
These sources are likely to be stakeholders in a program - participants, other researchers, program staff, other community members, and so on.
Then we put all data in single framework & apply various statistical tools to find out the dynamic on the market.
During the analysis stage, feedback from the stakeholder groups would be compared to determine areas of agreement as well as areas of divergence


