

Key Insights
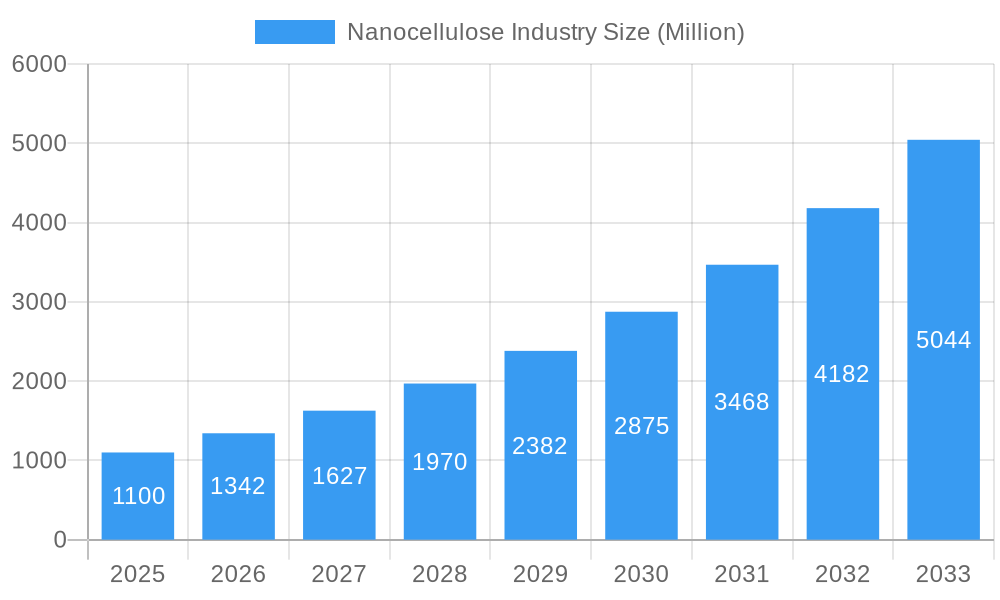
The nanocellulose market, valued at $1.10 billion in 2025, is experiencing robust growth, projected to expand at a compound annual growth rate (CAGR) exceeding 20% from 2025 to 2033. This significant expansion is driven by the material's unique properties – high strength, lightweight nature, biodegradability, and renewability – making it a compelling alternative to traditional materials in diverse applications. Key drivers include the increasing demand for sustainable and eco-friendly materials across various industries, particularly in packaging, construction, and automotive. Growing awareness of environmental concerns and stringent regulations on plastic waste are further accelerating market adoption. Trends such as advancements in nanocellulose production technologies, leading to cost reduction and improved performance, are also contributing to the market's growth trajectory. While challenges remain, such as scaling up production to meet the rising demand and addressing potential supply chain limitations, the overall market outlook remains highly positive.
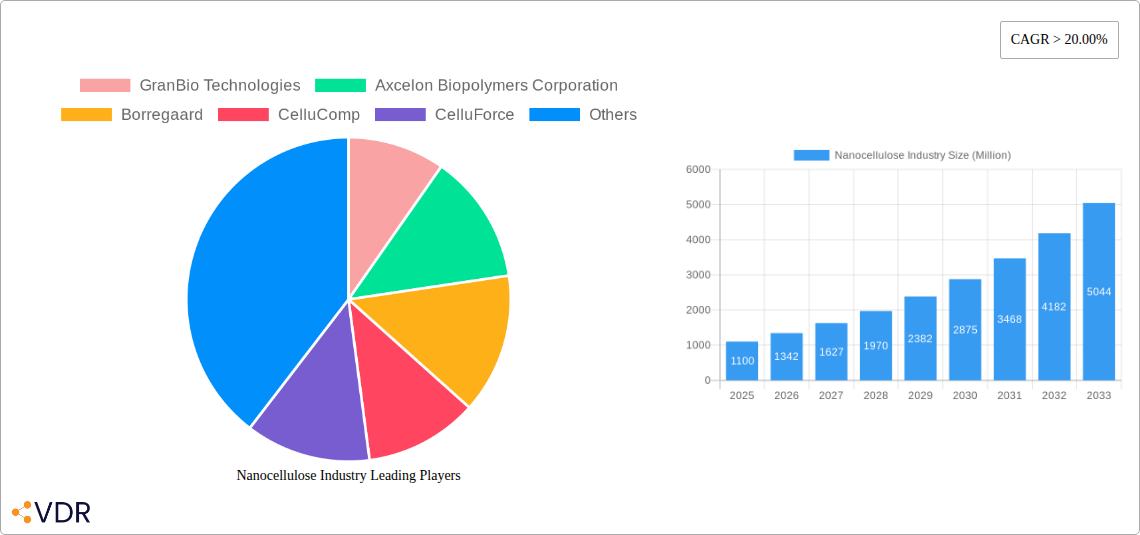
Nanocellulose Industry Market Size (In Billion)
The competitive landscape is marked by a mix of established players and emerging companies. Major players like Borregaard, Daicel Finechem, and Nippon Paper Industries are leveraging their expertise in pulp and paper production to expand their nanocellulose offerings. Smaller, more specialized companies like Melodea and CelluForce are focusing on innovation and niche applications. The market is witnessing increased strategic partnerships and collaborations, aimed at accelerating research and development, enhancing production capabilities, and expanding market reach. Geographical expansion, particularly in developing economies with a growing demand for sustainable materials, presents significant opportunities for market participants. The forecast period of 2025-2033 promises substantial growth potential, driven by ongoing technological advancements, increasing applications, and a global shift toward environmentally responsible materials.
Nanocellulose Industry Company Market Share
Nanocellulose Industry Market Report: 2019-2033
This comprehensive report provides an in-depth analysis of the nanocellulose industry, encompassing market dynamics, growth trends, regional segmentation, product landscape, key players, and future outlook. The study period covers 2019-2033, with 2025 as the base and estimated year. This report is crucial for industry professionals, investors, and researchers seeking to understand and capitalize on the burgeoning opportunities within this sustainable materials sector. The total market size is projected to reach xx Million by 2033.
Nanocellulose Industry Market Dynamics & Structure
The nanocellulose market is characterized by moderate concentration, with several key players vying for market share. Technological innovation, driven by advancements in nanocellulose production and application, is a significant driver. Stringent environmental regulations are further pushing adoption, particularly within the packaging and construction sectors. While biodegradable plastics and other bio-based materials present competitive substitutes, nanocellulose's unique properties, including high strength and biodegradability, offer a distinct advantage. End-user demographics span diverse industries, including packaging, construction, automotive, and biomedical. M&A activity has been relatively modest (xx deals in the historical period), indicating a consolidating market with strategic partnerships becoming increasingly common.
- Market Concentration: Moderately concentrated, with top 5 players holding approximately xx% market share (2024).
- Technological Innovation: Key drivers include advancements in production methods (e.g., TEMPO-mediated oxidation) and application-specific functionalization.
- Regulatory Landscape: Favorable regulations promoting sustainable materials are boosting growth, particularly in Europe and North America.
- Competitive Substitutes: Biodegradable plastics, other bio-based materials pose some competition but nanocellulose's unique properties maintain a competitive edge.
- End-User Demographics: Packaging (xx%), Construction (xx%), Automotive (xx%), Biomedical (xx%), others (xx%).
- M&A Activity: xx deals between 2019-2024, indicating strategic consolidation and partnership formation.
Nanocellulose Industry Growth Trends & Insights
The nanocellulose market has witnessed significant growth throughout the historical period (2019-2024), with a CAGR of xx%. This growth is projected to continue at a CAGR of xx% during the forecast period (2025-2033), driven by increasing demand for sustainable and high-performance materials across various industries. Adoption rates are rising steadily, particularly in packaging applications where the demand for eco-friendly alternatives to traditional plastics is strong. Technological disruptions, such as the development of novel nanocellulose production methods and functionalization techniques, are further fueling market expansion. Shifting consumer preferences towards sustainable products are creating significant opportunities.
Dominant Regions, Countries, or Segments in Nanocellulose Industry
North America currently holds the largest market share in the nanocellulose industry, driven by robust research and development, stringent environmental regulations, and strong demand from key end-use sectors. Europe follows closely, benefiting from similar factors, while Asia-Pacific is experiencing rapid growth due to increasing industrialization and a rising focus on sustainability. Specific countries like the USA, Canada, Germany, Sweden, and Japan are at the forefront.
- Key Drivers:
- North America: Strong R&D, stringent environmental regulations, high demand from packaging and construction sectors.
- Europe: Similar to North America, with additional focus on government incentives for sustainable materials.
- Asia-Pacific: Rapid industrialization, growing awareness of sustainability, expanding manufacturing base.
- Dominance Factors: Strong government support for sustainable technologies, established manufacturing infrastructure, and high demand from diverse end-use sectors.
- Growth Potential: Asia-Pacific demonstrates significant growth potential due to its large and rapidly expanding market.
Nanocellulose Industry Product Landscape
Nanocellulose products are diverse, ranging from cellulose nanofibrils (CNF) and cellulose nanocrystals (CNC) to aerogels and films. These materials exhibit unique properties, such as high strength-to-weight ratio, biodegradability, and biocompatibility. Continuous innovations focus on enhancing functionalities, including improved barrier properties, hydrophobicity, and thermal conductivity. This is leading to new applications in advanced composites, flexible electronics, and drug delivery systems.
Key Drivers, Barriers & Challenges in Nanocellulose Industry
Key Drivers:
- Growing demand for sustainable materials.
- Stringent environmental regulations.
- Advancements in nanocellulose production and functionalization technologies.
- Increasing demand from various end-use industries (packaging, construction, automotive).
Challenges and Restraints:
- High production costs compared to conventional materials.
- Scalability issues in nanocellulose manufacturing.
- Lack of standardization and quality control.
- Potential regulatory hurdles in certain applications.
Emerging Opportunities in Nanocellulose Industry
Emerging opportunities lie in exploring untapped markets such as biomedical applications (tissue engineering, drug delivery), advanced composites for aerospace and automotive industries, and sustainable packaging solutions. Innovative applications like water purification and energy storage are also gaining traction. Further research into functionalization techniques will unlock even greater potential.
Growth Accelerators in the Nanocellulose Industry
Technological breakthroughs in production methods and functionalization techniques, coupled with strategic partnerships between nanocellulose producers and end-use manufacturers, are vital growth accelerators. Expansion into new markets, particularly in developing economies with rising demand for sustainable materials, will further propel market growth.
Key Players Shaping the Nanocellulose Industry Market
- GranBio Technologies
- Axcelon Biopolymers Corporation
- Borregaard
- CelluComp
- CelluForce
- Chuetsu Pulp and Paper Co Ltd
- Daicel Finechem Ltd
- Fiberlean Technologies
- Melodea Ltd
- Nippon Paper Industries Co Ltd
- Norske Skog ASA
- Oji Holdings Corporation
- Sappi Ltd
- University of Maine *List Not Exhaustive
Notable Milestones in Nanocellulose Industry Sector
- September 2023: Researchers from Nanjing Forestry University developed a nanocellulosic aerogel film for building cooling applications, highlighting the potential for energy-efficient building materials.
- May 2022: Norske Skog ASA opened a new biocomposite plant, commercializing its nanocellulose product CEBINA and expanding its product portfolio.
In-Depth Nanocellulose Industry Market Outlook
The nanocellulose market is poised for sustained growth, driven by the increasing demand for sustainable materials and continuous technological advancements. Strategic partnerships, market expansion into new applications, and the development of cost-effective production methods will shape the future of this dynamic industry. The market's potential lies in its ability to offer high-performance, eco-friendly solutions across a broad range of sectors.
Nanocellulose Industry Segmentation
-
1. End-user Industry
- 1.1. Paper Processing
- 1.2. Paints and Coatings
- 1.3. Oil and Gas
- 1.4. Food and Beverage
- 1.5. Composites
- 1.6. Pharmaceuticals and Cosmetics
- 1.7. Other End-user Industries
-
2. Product Type
- 2.1. Nanofibrillated Cellulose (NFC)
- 2.2. Nanocrystalline Cellulose (NCC)
- 2.3. Bacterial Cellulose
- 2.4. Microfibrillated Cellulose (MFC)
- 2.5. Other Product Types
Nanocellulose Industry Segmentation By Geography
-
1. Asia Pacific
- 1.1. China
- 1.2. India
- 1.3. Japan
- 1.4. South Korea
- 1.5. Malaysia
- 1.6. Thailand
- 1.7. Indonesia
- 1.8. Vietnam
- 1.9. Rest of Asia Pacific
-
2. North America
- 2.1. United States
- 2.2. Canada
- 2.3. Mexico
-
3. Europe
- 3.1. Germany
- 3.2. United Kingdom
- 3.3. France
- 3.4. Italy
- 3.5. Spain
- 3.6. NORDIC Countries
- 3.7. Turkey
- 3.8. Russia
- 3.9. Rest of Europe
-
4. South America
- 4.1. Brazil
- 4.2. Argentina
- 4.3. Colombia
- 4.4. Rest of South America
-
5. Middle East and Africa
- 5.1. Saudi Arabia
- 5.2. South Africa
- 5.3. Nigeria
- 5.4. Qatar
- 5.5. Egypt
- 5.6. United Arab Emirates
- 5.7. Rest of Middle East and Africa
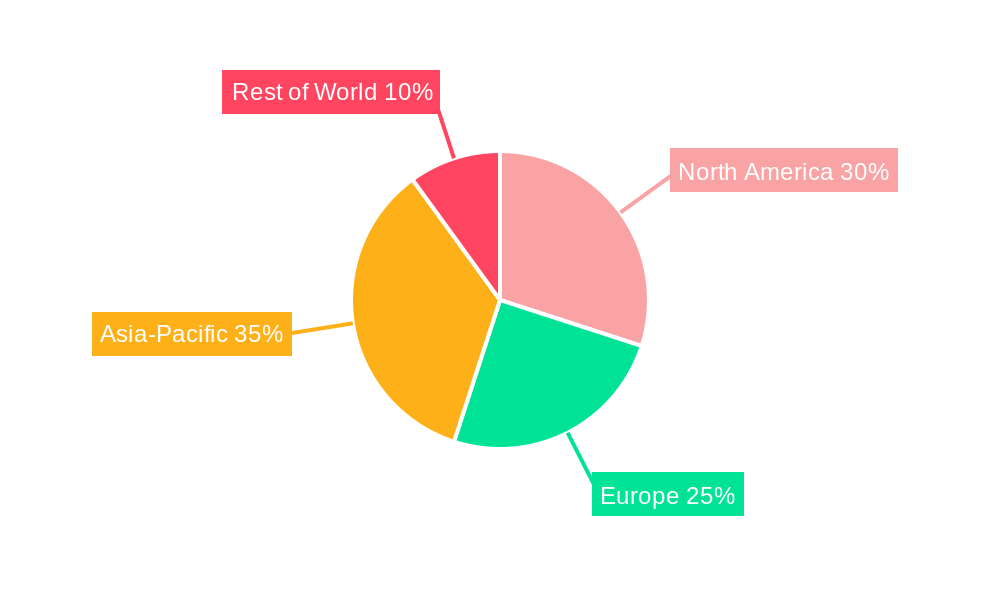
Nanocellulose Industry Regional Market Share
Geographic Coverage of Nanocellulose Industry
Nanocellulose Industry REPORT HIGHLIGHTS
| Aspects | Details |
|---|---|
| Study Period | 2020-2034 |
| Base Year | 2025 |
| Estimated Year | 2026 |
| Forecast Period | 2026-2034 |
| Historical Period | 2020-2025 |
| Growth Rate | CAGR of > 20.00% from 2020-2034 |
| Segmentation |
|
Table of Contents
- 1. Introduction
- 1.1. Research Scope
- 1.2. Market Segmentation
- 1.3. Research Objective
- 1.4. Definitions and Assumptions
- 2. Executive Summary
- 2.1. Market Snapshot
- 3. Market Dynamics
- 3.1. Market Drivers
- 3.2. Market Restrains
- 3.3. Market Trends
- 3.4. Market Opportunities
- 4. Market Factor Analysis
- 4.1. Porters Five Forces
- 4.1.1. Bargaining Power of Suppliers
- 4.1.2. Bargaining Power of Buyers
- 4.1.3. Threat of New Entrants
- 4.1.4. Threat of Substitutes
- 4.1.5. Competitive Rivalry
- 4.2. PESTEL analysis
- 4.3. BCG Analysis
- 4.3.1. Stars (High Growth, High Market Share)
- 4.3.2. Cash Cows (Low Growth, High Market Share)
- 4.3.3. Question Mark (High Growth, Low Market Share)
- 4.3.4. Dogs (Low Growth, Low Market Share)
- 4.4. Ansoff Matrix Analysis
- 4.5. Supply Chain Analysis
- 4.6. Regulatory Landscape
- 4.7. Current Market Potential and Opportunity Assessment (TAM–SAM–SOM Framework)
- 4.8. VDR Analyst Note
- 4.1. Porters Five Forces
- 5. Market Analysis, Insights and Forecast 2021-2033
- 5.1. Market Analysis, Insights and Forecast - by End-user Industry
- 5.1.1. Paper Processing
- 5.1.2. Paints and Coatings
- 5.1.3. Oil and Gas
- 5.1.4. Food and Beverage
- 5.1.5. Composites
- 5.1.6. Pharmaceuticals and Cosmetics
- 5.1.7. Other End-user Industries
- 5.2. Market Analysis, Insights and Forecast - by Product Type
- 5.2.1. Nanofibrillated Cellulose (NFC)
- 5.2.2. Nanocrystalline Cellulose (NCC)
- 5.2.3. Bacterial Cellulose
- 5.2.4. Microfibrillated Cellulose (MFC)
- 5.2.5. Other Product Types
- 5.3. Market Analysis, Insights and Forecast - by Region
- 5.3.1. Asia Pacific
- 5.3.2. North America
- 5.3.3. Europe
- 5.3.4. South America
- 5.3.5. Middle East and Africa
- 5.1. Market Analysis, Insights and Forecast - by End-user Industry
- 6. Global Nanocellulose Industry Analysis, Insights and Forecast, 2021-2033
- 6.1. Market Analysis, Insights and Forecast - by End-user Industry
- 6.1.1. Paper Processing
- 6.1.2. Paints and Coatings
- 6.1.3. Oil and Gas
- 6.1.4. Food and Beverage
- 6.1.5. Composites
- 6.1.6. Pharmaceuticals and Cosmetics
- 6.1.7. Other End-user Industries
- 6.2. Market Analysis, Insights and Forecast - by Product Type
- 6.2.1. Nanofibrillated Cellulose (NFC)
- 6.2.2. Nanocrystalline Cellulose (NCC)
- 6.2.3. Bacterial Cellulose
- 6.2.4. Microfibrillated Cellulose (MFC)
- 6.2.5. Other Product Types
- 6.1. Market Analysis, Insights and Forecast - by End-user Industry
- 7. Asia Pacific Nanocellulose Industry Analysis, Insights and Forecast, 2021-2033
- 7.1. Market Analysis, Insights and Forecast - by End-user Industry
- 7.1.1. Paper Processing
- 7.1.2. Paints and Coatings
- 7.1.3. Oil and Gas
- 7.1.4. Food and Beverage
- 7.1.5. Composites
- 7.1.6. Pharmaceuticals and Cosmetics
- 7.1.7. Other End-user Industries
- 7.2. Market Analysis, Insights and Forecast - by Product Type
- 7.2.1. Nanofibrillated Cellulose (NFC)
- 7.2.2. Nanocrystalline Cellulose (NCC)
- 7.2.3. Bacterial Cellulose
- 7.2.4. Microfibrillated Cellulose (MFC)
- 7.2.5. Other Product Types
- 7.1. Market Analysis, Insights and Forecast - by End-user Industry
- 8. North America Nanocellulose Industry Analysis, Insights and Forecast, 2021-2033
- 8.1. Market Analysis, Insights and Forecast - by End-user Industry
- 8.1.1. Paper Processing
- 8.1.2. Paints and Coatings
- 8.1.3. Oil and Gas
- 8.1.4. Food and Beverage
- 8.1.5. Composites
- 8.1.6. Pharmaceuticals and Cosmetics
- 8.1.7. Other End-user Industries
- 8.2. Market Analysis, Insights and Forecast - by Product Type
- 8.2.1. Nanofibrillated Cellulose (NFC)
- 8.2.2. Nanocrystalline Cellulose (NCC)
- 8.2.3. Bacterial Cellulose
- 8.2.4. Microfibrillated Cellulose (MFC)
- 8.2.5. Other Product Types
- 8.1. Market Analysis, Insights and Forecast - by End-user Industry
- 9. Europe Nanocellulose Industry Analysis, Insights and Forecast, 2021-2033
- 9.1. Market Analysis, Insights and Forecast - by End-user Industry
- 9.1.1. Paper Processing
- 9.1.2. Paints and Coatings
- 9.1.3. Oil and Gas
- 9.1.4. Food and Beverage
- 9.1.5. Composites
- 9.1.6. Pharmaceuticals and Cosmetics
- 9.1.7. Other End-user Industries
- 9.2. Market Analysis, Insights and Forecast - by Product Type
- 9.2.1. Nanofibrillated Cellulose (NFC)
- 9.2.2. Nanocrystalline Cellulose (NCC)
- 9.2.3. Bacterial Cellulose
- 9.2.4. Microfibrillated Cellulose (MFC)
- 9.2.5. Other Product Types
- 9.1. Market Analysis, Insights and Forecast - by End-user Industry
- 10. South America Nanocellulose Industry Analysis, Insights and Forecast, 2021-2033
- 10.1. Market Analysis, Insights and Forecast - by End-user Industry
- 10.1.1. Paper Processing
- 10.1.2. Paints and Coatings
- 10.1.3. Oil and Gas
- 10.1.4. Food and Beverage
- 10.1.5. Composites
- 10.1.6. Pharmaceuticals and Cosmetics
- 10.1.7. Other End-user Industries
- 10.2. Market Analysis, Insights and Forecast - by Product Type
- 10.2.1. Nanofibrillated Cellulose (NFC)
- 10.2.2. Nanocrystalline Cellulose (NCC)
- 10.2.3. Bacterial Cellulose
- 10.2.4. Microfibrillated Cellulose (MFC)
- 10.2.5. Other Product Types
- 10.1. Market Analysis, Insights and Forecast - by End-user Industry
- 11. Middle East and Africa Nanocellulose Industry Analysis, Insights and Forecast, 2021-2033
- 11.1. Market Analysis, Insights and Forecast - by End-user Industry
- 11.1.1. Paper Processing
- 11.1.2. Paints and Coatings
- 11.1.3. Oil and Gas
- 11.1.4. Food and Beverage
- 11.1.5. Composites
- 11.1.6. Pharmaceuticals and Cosmetics
- 11.1.7. Other End-user Industries
- 11.2. Market Analysis, Insights and Forecast - by Product Type
- 11.2.1. Nanofibrillated Cellulose (NFC)
- 11.2.2. Nanocrystalline Cellulose (NCC)
- 11.2.3. Bacterial Cellulose
- 11.2.4. Microfibrillated Cellulose (MFC)
- 11.2.5. Other Product Types
- 11.1. Market Analysis, Insights and Forecast - by End-user Industry
- 12. Competitive Analysis
- 12.1. Company Profiles
- 12.1.1 GranBio Technologies
- 12.1.1.1. Company Overview
- 12.1.1.2. Products
- 12.1.1.3. Company Financials
- 12.1.1.4. SWOT Analysis
- 12.1.2 Axcelon Biopolymers Corporation
- 12.1.2.1. Company Overview
- 12.1.2.2. Products
- 12.1.2.3. Company Financials
- 12.1.2.4. SWOT Analysis
- 12.1.3 Borregaard
- 12.1.3.1. Company Overview
- 12.1.3.2. Products
- 12.1.3.3. Company Financials
- 12.1.3.4. SWOT Analysis
- 12.1.4 CelluComp
- 12.1.4.1. Company Overview
- 12.1.4.2. Products
- 12.1.4.3. Company Financials
- 12.1.4.4. SWOT Analysis
- 12.1.5 CelluForce
- 12.1.5.1. Company Overview
- 12.1.5.2. Products
- 12.1.5.3. Company Financials
- 12.1.5.4. SWOT Analysis
- 12.1.6 Chuetsu Pulp and Paper Co Ltd
- 12.1.6.1. Company Overview
- 12.1.6.2. Products
- 12.1.6.3. Company Financials
- 12.1.6.4. SWOT Analysis
- 12.1.7 Daicel Finechem Ltd
- 12.1.7.1. Company Overview
- 12.1.7.2. Products
- 12.1.7.3. Company Financials
- 12.1.7.4. SWOT Analysis
- 12.1.8 Fiberlean Technologies
- 12.1.8.1. Company Overview
- 12.1.8.2. Products
- 12.1.8.3. Company Financials
- 12.1.8.4. SWOT Analysis
- 12.1.9 Melodea Ltd
- 12.1.9.1. Company Overview
- 12.1.9.2. Products
- 12.1.9.3. Company Financials
- 12.1.9.4. SWOT Analysis
- 12.1.10 Nippon Paper Industries Co Ltd
- 12.1.10.1. Company Overview
- 12.1.10.2. Products
- 12.1.10.3. Company Financials
- 12.1.10.4. SWOT Analysis
- 12.1.11 Norske Skog ASA
- 12.1.11.1. Company Overview
- 12.1.11.2. Products
- 12.1.11.3. Company Financials
- 12.1.11.4. SWOT Analysis
- 12.1.12 Oji Holdings Corporation
- 12.1.12.1. Company Overview
- 12.1.12.2. Products
- 12.1.12.3. Company Financials
- 12.1.12.4. SWOT Analysis
- 12.1.13 Sappi Ltd
- 12.1.13.1. Company Overview
- 12.1.13.2. Products
- 12.1.13.3. Company Financials
- 12.1.13.4. SWOT Analysis
- 12.1.14 University of Maine*List Not Exhaustive
- 12.1.14.1. Company Overview
- 12.1.14.2. Products
- 12.1.14.3. Company Financials
- 12.1.14.4. SWOT Analysis
- 12.1.1 GranBio Technologies
- 12.2. Market Entropy
- 12.2.1 Company's Key Areas Served
- 12.2.2 Recent Developments
- 12.3. Company Market Share Analysis 2025
- 12.3.1 Top 5 Companies Market Share Analysis
- 12.3.2 Top 3 Companies Market Share Analysis
- 12.4. List of Potential Customers
- 13. Research Methodology
List of Figures
- Figure 1: Global Nanocellulose Industry Revenue Breakdown (Million, %) by Region 2025 & 2033
- Figure 2: Global Nanocellulose Industry Volume Breakdown (Billion, %) by Region 2025 & 2033
- Figure 3: Asia Pacific Nanocellulose Industry Revenue (Million), by End-user Industry 2025 & 2033
- Figure 4: Asia Pacific Nanocellulose Industry Volume (Billion), by End-user Industry 2025 & 2033
- Figure 5: Asia Pacific Nanocellulose Industry Revenue Share (%), by End-user Industry 2025 & 2033
- Figure 6: Asia Pacific Nanocellulose Industry Volume Share (%), by End-user Industry 2025 & 2033
- Figure 7: Asia Pacific Nanocellulose Industry Revenue (Million), by Product Type 2025 & 2033
- Figure 8: Asia Pacific Nanocellulose Industry Volume (Billion), by Product Type 2025 & 2033
- Figure 9: Asia Pacific Nanocellulose Industry Revenue Share (%), by Product Type 2025 & 2033
- Figure 10: Asia Pacific Nanocellulose Industry Volume Share (%), by Product Type 2025 & 2033
- Figure 11: Asia Pacific Nanocellulose Industry Revenue (Million), by Country 2025 & 2033
- Figure 12: Asia Pacific Nanocellulose Industry Volume (Billion), by Country 2025 & 2033
- Figure 13: Asia Pacific Nanocellulose Industry Revenue Share (%), by Country 2025 & 2033
- Figure 14: Asia Pacific Nanocellulose Industry Volume Share (%), by Country 2025 & 2033
- Figure 15: North America Nanocellulose Industry Revenue (Million), by End-user Industry 2025 & 2033
- Figure 16: North America Nanocellulose Industry Volume (Billion), by End-user Industry 2025 & 2033
- Figure 17: North America Nanocellulose Industry Revenue Share (%), by End-user Industry 2025 & 2033
- Figure 18: North America Nanocellulose Industry Volume Share (%), by End-user Industry 2025 & 2033
- Figure 19: North America Nanocellulose Industry Revenue (Million), by Product Type 2025 & 2033
- Figure 20: North America Nanocellulose Industry Volume (Billion), by Product Type 2025 & 2033
- Figure 21: North America Nanocellulose Industry Revenue Share (%), by Product Type 2025 & 2033
- Figure 22: North America Nanocellulose Industry Volume Share (%), by Product Type 2025 & 2033
- Figure 23: North America Nanocellulose Industry Revenue (Million), by Country 2025 & 2033
- Figure 24: North America Nanocellulose Industry Volume (Billion), by Country 2025 & 2033
- Figure 25: North America Nanocellulose Industry Revenue Share (%), by Country 2025 & 2033
- Figure 26: North America Nanocellulose Industry Volume Share (%), by Country 2025 & 2033
- Figure 27: Europe Nanocellulose Industry Revenue (Million), by End-user Industry 2025 & 2033
- Figure 28: Europe Nanocellulose Industry Volume (Billion), by End-user Industry 2025 & 2033
- Figure 29: Europe Nanocellulose Industry Revenue Share (%), by End-user Industry 2025 & 2033
- Figure 30: Europe Nanocellulose Industry Volume Share (%), by End-user Industry 2025 & 2033
- Figure 31: Europe Nanocellulose Industry Revenue (Million), by Product Type 2025 & 2033
- Figure 32: Europe Nanocellulose Industry Volume (Billion), by Product Type 2025 & 2033
- Figure 33: Europe Nanocellulose Industry Revenue Share (%), by Product Type 2025 & 2033
- Figure 34: Europe Nanocellulose Industry Volume Share (%), by Product Type 2025 & 2033
- Figure 35: Europe Nanocellulose Industry Revenue (Million), by Country 2025 & 2033
- Figure 36: Europe Nanocellulose Industry Volume (Billion), by Country 2025 & 2033
- Figure 37: Europe Nanocellulose Industry Revenue Share (%), by Country 2025 & 2033
- Figure 38: Europe Nanocellulose Industry Volume Share (%), by Country 2025 & 2033
- Figure 39: South America Nanocellulose Industry Revenue (Million), by End-user Industry 2025 & 2033
- Figure 40: South America Nanocellulose Industry Volume (Billion), by End-user Industry 2025 & 2033
- Figure 41: South America Nanocellulose Industry Revenue Share (%), by End-user Industry 2025 & 2033
- Figure 42: South America Nanocellulose Industry Volume Share (%), by End-user Industry 2025 & 2033
- Figure 43: South America Nanocellulose Industry Revenue (Million), by Product Type 2025 & 2033
- Figure 44: South America Nanocellulose Industry Volume (Billion), by Product Type 2025 & 2033
- Figure 45: South America Nanocellulose Industry Revenue Share (%), by Product Type 2025 & 2033
- Figure 46: South America Nanocellulose Industry Volume Share (%), by Product Type 2025 & 2033
- Figure 47: South America Nanocellulose Industry Revenue (Million), by Country 2025 & 2033
- Figure 48: South America Nanocellulose Industry Volume (Billion), by Country 2025 & 2033
- Figure 49: South America Nanocellulose Industry Revenue Share (%), by Country 2025 & 2033
- Figure 50: South America Nanocellulose Industry Volume Share (%), by Country 2025 & 2033
- Figure 51: Middle East and Africa Nanocellulose Industry Revenue (Million), by End-user Industry 2025 & 2033
- Figure 52: Middle East and Africa Nanocellulose Industry Volume (Billion), by End-user Industry 2025 & 2033
- Figure 53: Middle East and Africa Nanocellulose Industry Revenue Share (%), by End-user Industry 2025 & 2033
- Figure 54: Middle East and Africa Nanocellulose Industry Volume Share (%), by End-user Industry 2025 & 2033
- Figure 55: Middle East and Africa Nanocellulose Industry Revenue (Million), by Product Type 2025 & 2033
- Figure 56: Middle East and Africa Nanocellulose Industry Volume (Billion), by Product Type 2025 & 2033
- Figure 57: Middle East and Africa Nanocellulose Industry Revenue Share (%), by Product Type 2025 & 2033
- Figure 58: Middle East and Africa Nanocellulose Industry Volume Share (%), by Product Type 2025 & 2033
- Figure 59: Middle East and Africa Nanocellulose Industry Revenue (Million), by Country 2025 & 2033
- Figure 60: Middle East and Africa Nanocellulose Industry Volume (Billion), by Country 2025 & 2033
- Figure 61: Middle East and Africa Nanocellulose Industry Revenue Share (%), by Country 2025 & 2033
- Figure 62: Middle East and Africa Nanocellulose Industry Volume Share (%), by Country 2025 & 2033
List of Tables
- Table 1: Global Nanocellulose Industry Revenue Million Forecast, by End-user Industry 2020 & 2033
- Table 2: Global Nanocellulose Industry Volume Billion Forecast, by End-user Industry 2020 & 2033
- Table 3: Global Nanocellulose Industry Revenue Million Forecast, by Product Type 2020 & 2033
- Table 4: Global Nanocellulose Industry Volume Billion Forecast, by Product Type 2020 & 2033
- Table 5: Global Nanocellulose Industry Revenue Million Forecast, by Region 2020 & 2033
- Table 6: Global Nanocellulose Industry Volume Billion Forecast, by Region 2020 & 2033
- Table 7: Global Nanocellulose Industry Revenue Million Forecast, by End-user Industry 2020 & 2033
- Table 8: Global Nanocellulose Industry Volume Billion Forecast, by End-user Industry 2020 & 2033
- Table 9: Global Nanocellulose Industry Revenue Million Forecast, by Product Type 2020 & 2033
- Table 10: Global Nanocellulose Industry Volume Billion Forecast, by Product Type 2020 & 2033
- Table 11: Global Nanocellulose Industry Revenue Million Forecast, by Country 2020 & 2033
- Table 12: Global Nanocellulose Industry Volume Billion Forecast, by Country 2020 & 2033
- Table 13: China Nanocellulose Industry Revenue (Million) Forecast, by Application 2020 & 2033
- Table 14: China Nanocellulose Industry Volume (Billion) Forecast, by Application 2020 & 2033
- Table 15: India Nanocellulose Industry Revenue (Million) Forecast, by Application 2020 & 2033
- Table 16: India Nanocellulose Industry Volume (Billion) Forecast, by Application 2020 & 2033
- Table 17: Japan Nanocellulose Industry Revenue (Million) Forecast, by Application 2020 & 2033
- Table 18: Japan Nanocellulose Industry Volume (Billion) Forecast, by Application 2020 & 2033
- Table 19: South Korea Nanocellulose Industry Revenue (Million) Forecast, by Application 2020 & 2033
- Table 20: South Korea Nanocellulose Industry Volume (Billion) Forecast, by Application 2020 & 2033
- Table 21: Malaysia Nanocellulose Industry Revenue (Million) Forecast, by Application 2020 & 2033
- Table 22: Malaysia Nanocellulose Industry Volume (Billion) Forecast, by Application 2020 & 2033
- Table 23: Thailand Nanocellulose Industry Revenue (Million) Forecast, by Application 2020 & 2033
- Table 24: Thailand Nanocellulose Industry Volume (Billion) Forecast, by Application 2020 & 2033
- Table 25: Indonesia Nanocellulose Industry Revenue (Million) Forecast, by Application 2020 & 2033
- Table 26: Indonesia Nanocellulose Industry Volume (Billion) Forecast, by Application 2020 & 2033
- Table 27: Vietnam Nanocellulose Industry Revenue (Million) Forecast, by Application 2020 & 2033
- Table 28: Vietnam Nanocellulose Industry Volume (Billion) Forecast, by Application 2020 & 2033
- Table 29: Rest of Asia Pacific Nanocellulose Industry Revenue (Million) Forecast, by Application 2020 & 2033
- Table 30: Rest of Asia Pacific Nanocellulose Industry Volume (Billion) Forecast, by Application 2020 & 2033
- Table 31: Global Nanocellulose Industry Revenue Million Forecast, by End-user Industry 2020 & 2033
- Table 32: Global Nanocellulose Industry Volume Billion Forecast, by End-user Industry 2020 & 2033
- Table 33: Global Nanocellulose Industry Revenue Million Forecast, by Product Type 2020 & 2033
- Table 34: Global Nanocellulose Industry Volume Billion Forecast, by Product Type 2020 & 2033
- Table 35: Global Nanocellulose Industry Revenue Million Forecast, by Country 2020 & 2033
- Table 36: Global Nanocellulose Industry Volume Billion Forecast, by Country 2020 & 2033
- Table 37: United States Nanocellulose Industry Revenue (Million) Forecast, by Application 2020 & 2033
- Table 38: United States Nanocellulose Industry Volume (Billion) Forecast, by Application 2020 & 2033
- Table 39: Canada Nanocellulose Industry Revenue (Million) Forecast, by Application 2020 & 2033
- Table 40: Canada Nanocellulose Industry Volume (Billion) Forecast, by Application 2020 & 2033
- Table 41: Mexico Nanocellulose Industry Revenue (Million) Forecast, by Application 2020 & 2033
- Table 42: Mexico Nanocellulose Industry Volume (Billion) Forecast, by Application 2020 & 2033
- Table 43: Global Nanocellulose Industry Revenue Million Forecast, by End-user Industry 2020 & 2033
- Table 44: Global Nanocellulose Industry Volume Billion Forecast, by End-user Industry 2020 & 2033
- Table 45: Global Nanocellulose Industry Revenue Million Forecast, by Product Type 2020 & 2033
- Table 46: Global Nanocellulose Industry Volume Billion Forecast, by Product Type 2020 & 2033
- Table 47: Global Nanocellulose Industry Revenue Million Forecast, by Country 2020 & 2033
- Table 48: Global Nanocellulose Industry Volume Billion Forecast, by Country 2020 & 2033
- Table 49: Germany Nanocellulose Industry Revenue (Million) Forecast, by Application 2020 & 2033
- Table 50: Germany Nanocellulose Industry Volume (Billion) Forecast, by Application 2020 & 2033
- Table 51: United Kingdom Nanocellulose Industry Revenue (Million) Forecast, by Application 2020 & 2033
- Table 52: United Kingdom Nanocellulose Industry Volume (Billion) Forecast, by Application 2020 & 2033
- Table 53: France Nanocellulose Industry Revenue (Million) Forecast, by Application 2020 & 2033
- Table 54: France Nanocellulose Industry Volume (Billion) Forecast, by Application 2020 & 2033
- Table 55: Italy Nanocellulose Industry Revenue (Million) Forecast, by Application 2020 & 2033
- Table 56: Italy Nanocellulose Industry Volume (Billion) Forecast, by Application 2020 & 2033
- Table 57: Spain Nanocellulose Industry Revenue (Million) Forecast, by Application 2020 & 2033
- Table 58: Spain Nanocellulose Industry Volume (Billion) Forecast, by Application 2020 & 2033
- Table 59: NORDIC Countries Nanocellulose Industry Revenue (Million) Forecast, by Application 2020 & 2033
- Table 60: NORDIC Countries Nanocellulose Industry Volume (Billion) Forecast, by Application 2020 & 2033
- Table 61: Turkey Nanocellulose Industry Revenue (Million) Forecast, by Application 2020 & 2033
- Table 62: Turkey Nanocellulose Industry Volume (Billion) Forecast, by Application 2020 & 2033
- Table 63: Russia Nanocellulose Industry Revenue (Million) Forecast, by Application 2020 & 2033
- Table 64: Russia Nanocellulose Industry Volume (Billion) Forecast, by Application 2020 & 2033
- Table 65: Rest of Europe Nanocellulose Industry Revenue (Million) Forecast, by Application 2020 & 2033
- Table 66: Rest of Europe Nanocellulose Industry Volume (Billion) Forecast, by Application 2020 & 2033
- Table 67: Global Nanocellulose Industry Revenue Million Forecast, by End-user Industry 2020 & 2033
- Table 68: Global Nanocellulose Industry Volume Billion Forecast, by End-user Industry 2020 & 2033
- Table 69: Global Nanocellulose Industry Revenue Million Forecast, by Product Type 2020 & 2033
- Table 70: Global Nanocellulose Industry Volume Billion Forecast, by Product Type 2020 & 2033
- Table 71: Global Nanocellulose Industry Revenue Million Forecast, by Country 2020 & 2033
- Table 72: Global Nanocellulose Industry Volume Billion Forecast, by Country 2020 & 2033
- Table 73: Brazil Nanocellulose Industry Revenue (Million) Forecast, by Application 2020 & 2033
- Table 74: Brazil Nanocellulose Industry Volume (Billion) Forecast, by Application 2020 & 2033
- Table 75: Argentina Nanocellulose Industry Revenue (Million) Forecast, by Application 2020 & 2033
- Table 76: Argentina Nanocellulose Industry Volume (Billion) Forecast, by Application 2020 & 2033
- Table 77: Colombia Nanocellulose Industry Revenue (Million) Forecast, by Application 2020 & 2033
- Table 78: Colombia Nanocellulose Industry Volume (Billion) Forecast, by Application 2020 & 2033
- Table 79: Rest of South America Nanocellulose Industry Revenue (Million) Forecast, by Application 2020 & 2033
- Table 80: Rest of South America Nanocellulose Industry Volume (Billion) Forecast, by Application 2020 & 2033
- Table 81: Global Nanocellulose Industry Revenue Million Forecast, by End-user Industry 2020 & 2033
- Table 82: Global Nanocellulose Industry Volume Billion Forecast, by End-user Industry 2020 & 2033
- Table 83: Global Nanocellulose Industry Revenue Million Forecast, by Product Type 2020 & 2033
- Table 84: Global Nanocellulose Industry Volume Billion Forecast, by Product Type 2020 & 2033
- Table 85: Global Nanocellulose Industry Revenue Million Forecast, by Country 2020 & 2033
- Table 86: Global Nanocellulose Industry Volume Billion Forecast, by Country 2020 & 2033
- Table 87: Saudi Arabia Nanocellulose Industry Revenue (Million) Forecast, by Application 2020 & 2033
- Table 88: Saudi Arabia Nanocellulose Industry Volume (Billion) Forecast, by Application 2020 & 2033
- Table 89: South Africa Nanocellulose Industry Revenue (Million) Forecast, by Application 2020 & 2033
- Table 90: South Africa Nanocellulose Industry Volume (Billion) Forecast, by Application 2020 & 2033
- Table 91: Nigeria Nanocellulose Industry Revenue (Million) Forecast, by Application 2020 & 2033
- Table 92: Nigeria Nanocellulose Industry Volume (Billion) Forecast, by Application 2020 & 2033
- Table 93: Qatar Nanocellulose Industry Revenue (Million) Forecast, by Application 2020 & 2033
- Table 94: Qatar Nanocellulose Industry Volume (Billion) Forecast, by Application 2020 & 2033
- Table 95: Egypt Nanocellulose Industry Revenue (Million) Forecast, by Application 2020 & 2033
- Table 96: Egypt Nanocellulose Industry Volume (Billion) Forecast, by Application 2020 & 2033
- Table 97: United Arab Emirates Nanocellulose Industry Revenue (Million) Forecast, by Application 2020 & 2033
- Table 98: United Arab Emirates Nanocellulose Industry Volume (Billion) Forecast, by Application 2020 & 2033
- Table 99: Rest of Middle East and Africa Nanocellulose Industry Revenue (Million) Forecast, by Application 2020 & 2033
- Table 100: Rest of Middle East and Africa Nanocellulose Industry Volume (Billion) Forecast, by Application 2020 & 2033
Frequently Asked Questions
1. What is the projected Compound Annual Growth Rate (CAGR) of the Nanocellulose Industry?
The projected CAGR is approximately > 20.00%.
2. Which companies are prominent players in the Nanocellulose Industry?
Key companies in the market include GranBio Technologies, Axcelon Biopolymers Corporation, Borregaard, CelluComp, CelluForce, Chuetsu Pulp and Paper Co Ltd, Daicel Finechem Ltd, Fiberlean Technologies, Melodea Ltd, Nippon Paper Industries Co Ltd, Norske Skog ASA, Oji Holdings Corporation, Sappi Ltd, University of Maine*List Not Exhaustive.
3. What are the main segments of the Nanocellulose Industry?
The market segments include End-user Industry, Product Type.
4. Can you provide details about the market size?
The market size is estimated to be USD 1.10 Million as of 2022.
5. What are some drivers contributing to market growth?
Superior Properties of Nanocellulose; Increasing Adoption of Flexible Packaging Aids; Other Drivers.
6. What are the notable trends driving market growth?
The Composites Segment is Expected to Dominate the Market.
7. Are there any restraints impacting market growth?
Superior Properties of Nanocellulose; Increasing Adoption of Flexible Packaging Aids; Other Drivers.
8. Can you provide examples of recent developments in the market?
September 2023: The world’s demand for cooling increased significantly. In particular, ACs and electric fans consume almost 20% of a building's electricity consumption. As a result, research into eco-friendly, sustainable cooling technologies offers promising opportunities to combat global warming and reduce energy consumption. In line with this, a group of researchers from the Nanjing Forestry University in China have developed the nanocellulosic aerogel film to keep buildings cooler.
9. What pricing options are available for accessing the report?
Pricing options include single-user, multi-user, and enterprise licenses priced at USD 4750, USD 5250, and USD 8750 respectively.
10. Is the market size provided in terms of value or volume?
The market size is provided in terms of value, measured in Million and volume, measured in Billion.
11. Are there any specific market keywords associated with the report?
Yes, the market keyword associated with the report is "Nanocellulose Industry," which aids in identifying and referencing the specific market segment covered.
12. How do I determine which pricing option suits my needs best?
The pricing options vary based on user requirements and access needs. Individual users may opt for single-user licenses, while businesses requiring broader access may choose multi-user or enterprise licenses for cost-effective access to the report.
13. Are there any additional resources or data provided in the Nanocellulose Industry report?
While the report offers comprehensive insights, it's advisable to review the specific contents or supplementary materials provided to ascertain if additional resources or data are available.
14. How can I stay updated on further developments or reports in the Nanocellulose Industry?
To stay informed about further developments, trends, and reports in the Nanocellulose Industry, consider subscribing to industry newsletters, following relevant companies and organizations, or regularly checking reputable industry news sources and publications.
Methodology
Step 1 - Identification of Relevant Samples Size from Population Database


Step 2 - Approaches for Defining Global Market Size (Value, Volume* & Price*)

Note*: In applicable scenarios
Step 3 - Data Sources
Primary Research
- Web Analytics
- Survey Reports
- Research Institute
- Latest Research Reports
- Opinion Leaders
Secondary Research
- Annual Reports
- White Paper
- Latest Press Release
- Industry Association
- Paid Database
- Investor Presentations

Step 4 - Data Triangulation
Involves using different sources of information in order to increase the validity of a study
These sources are likely to be stakeholders in a program - participants, other researchers, program staff, other community members, and so on.
Then we put all data in single framework & apply various statistical tools to find out the dynamic on the market.
During the analysis stage, feedback from the stakeholder groups would be compared to determine areas of agreement as well as areas of divergence