

Key Insights
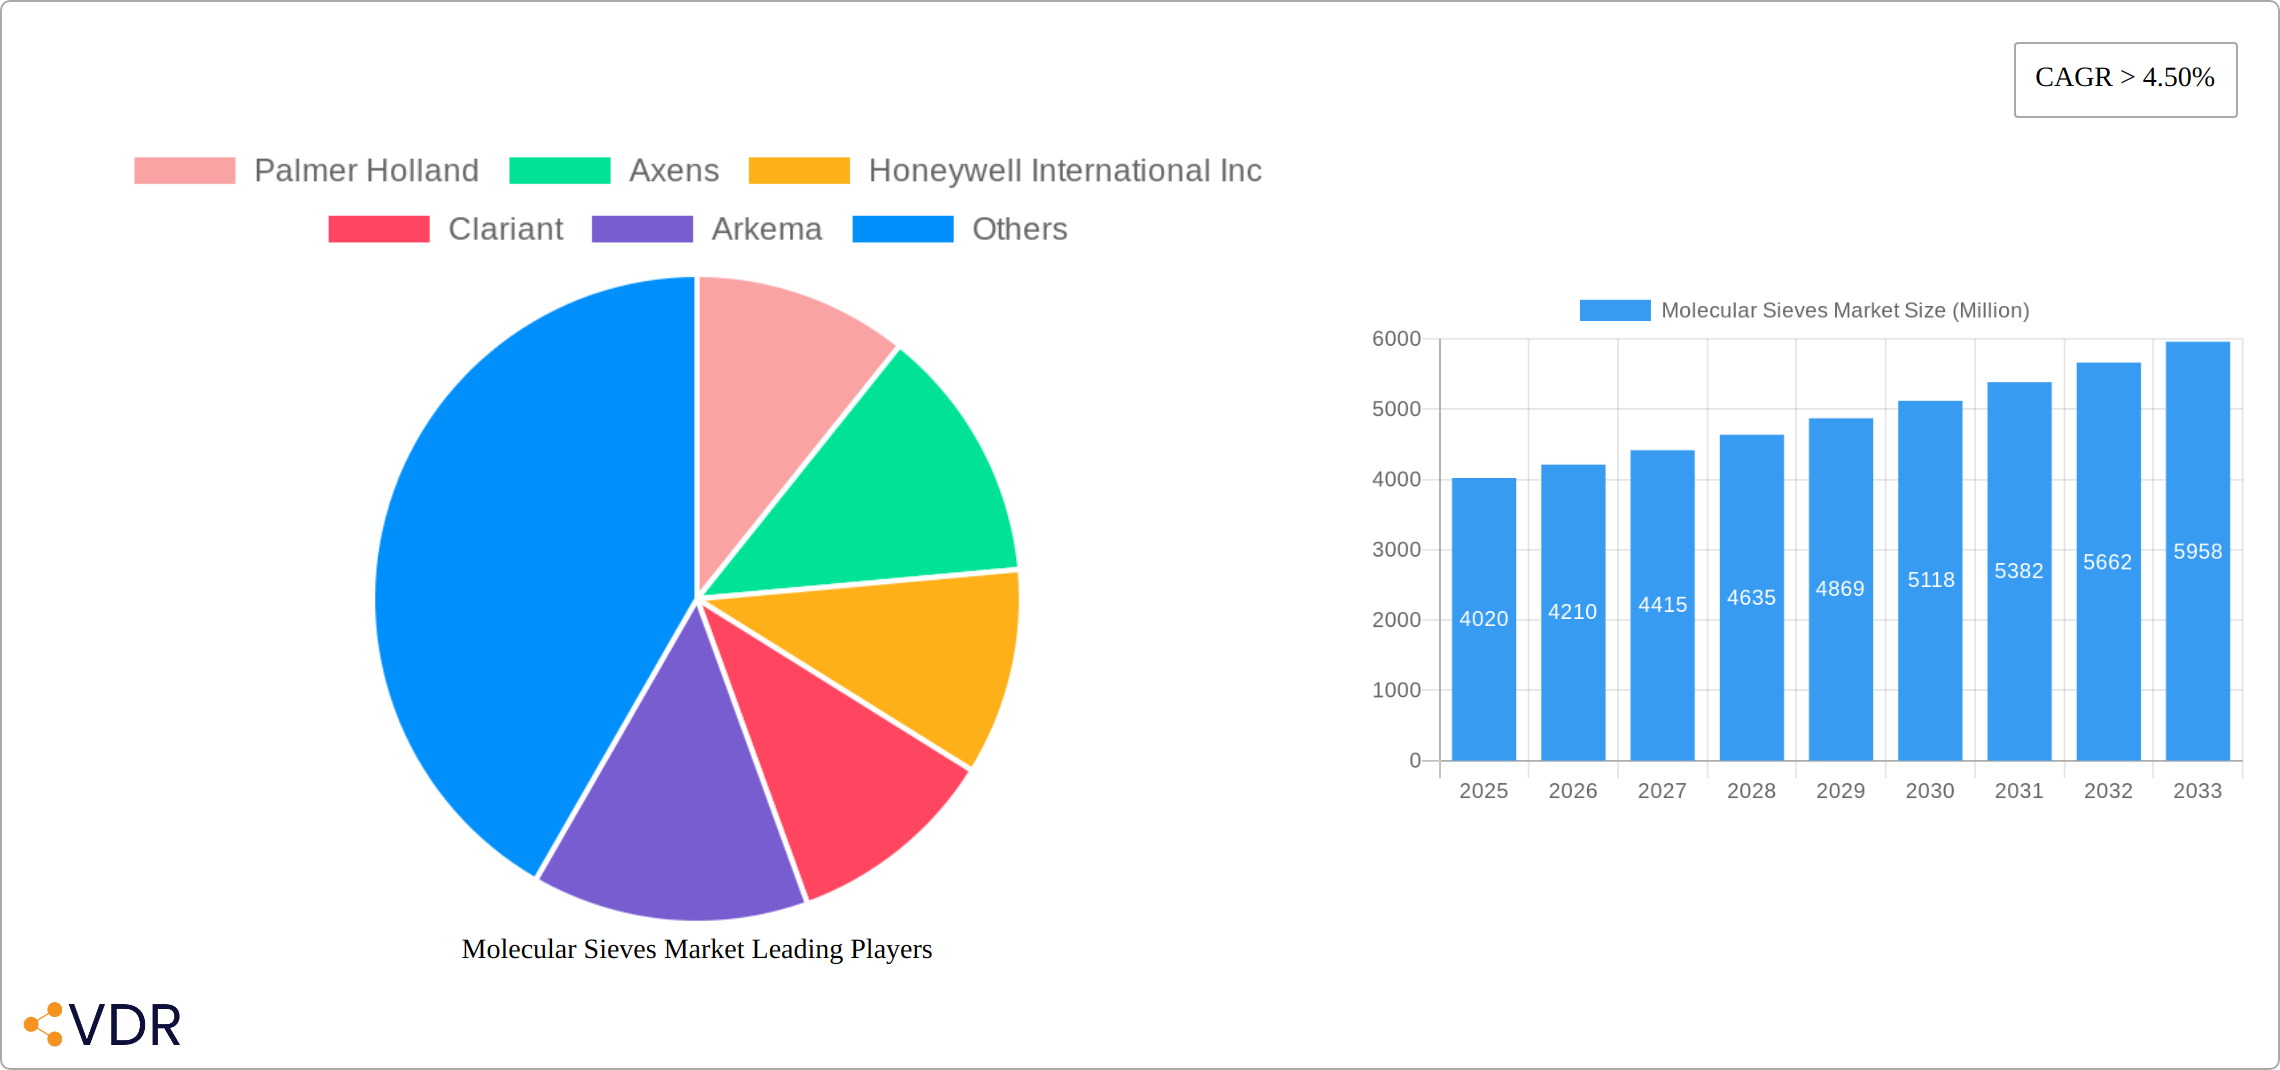
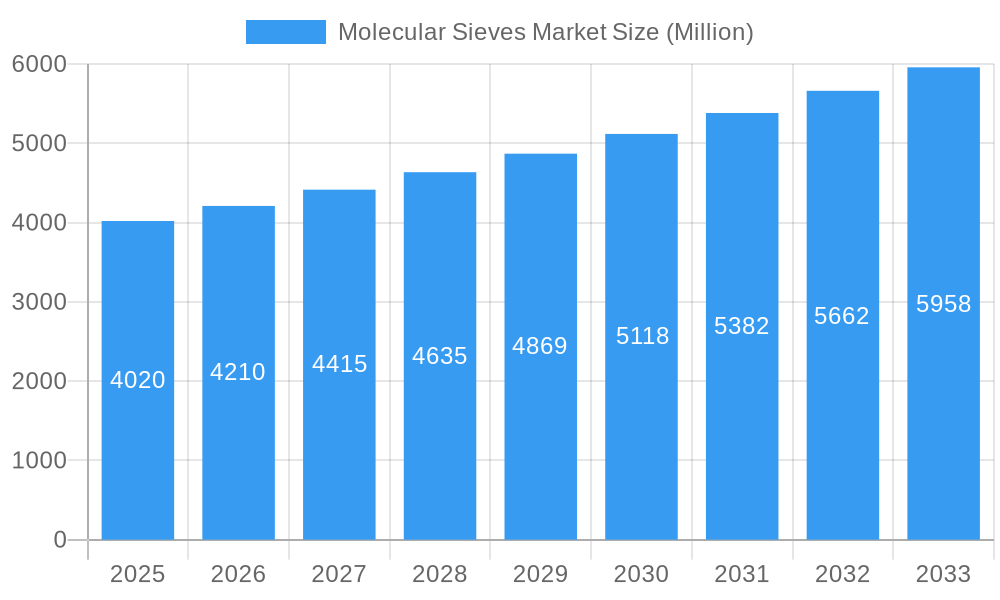
The global molecular sieves market, valued at $4.02 billion in 2025, is projected to experience robust growth, exhibiting a compound annual growth rate (CAGR) exceeding 4.50% from 2025 to 2033. This expansion is driven by several key factors. The increasing demand for efficient purification and separation technologies across diverse industries, particularly in the oil and gas sector for natural gas processing and petrochemical refining, significantly fuels market growth. Furthermore, the rising adoption of molecular sieves in the pharmaceutical industry for drug purification and in the environmental sector for water and wastewater treatment contributes to market expansion. The automotive industry’s increasing reliance on advanced materials and catalysts also bolsters demand. Technological advancements leading to the development of more efficient and specialized molecular sieves, along with the growing focus on sustainability and environmental protection, further propel market growth. Specific growth drivers within segments include the increasing use of pelleted and beaded forms for ease of handling and the preference for mesoporous and macroporous structures for improved performance in various applications.
Molecular Sieves Market Market Size (In Billion)
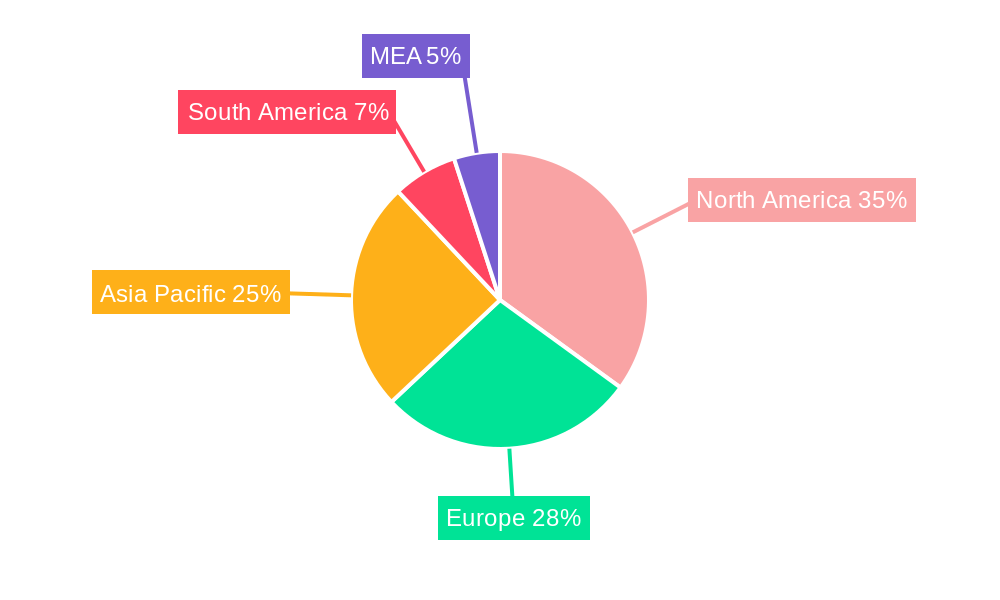
Significant regional variations exist within the market. North America and Europe are currently leading the market, driven by established industries and technological advancements. However, the Asia-Pacific region is anticipated to witness substantial growth in the coming years due to rapid industrialization and increasing investments in infrastructure projects. This region's growth is largely fueled by the expanding chemical, pharmaceutical, and automotive sectors in countries like China, India, and Japan. Competition within the market is intense, with a diverse range of established players and emerging companies vying for market share. The leading companies are continuously investing in research and development to enhance product offerings and expand their market presence. The market is characterized by both technological innovation and intense competition, creating a dynamic environment for growth and innovation in the coming years. This forecast considers various factors, including economic trends, regulatory changes, and technological advancements, to provide a comprehensive market outlook.
Molecular Sieves Market Company Market Share
Molecular Sieves Market: A Comprehensive Report (2019-2033)
This comprehensive report provides an in-depth analysis of the global Molecular Sieves Market, encompassing market dynamics, growth trends, regional dominance, product landscape, and key players. With a focus on the parent market of industrial filtration and the child market of molecular sieves, this report offers valuable insights for industry professionals, investors, and strategic decision-makers. The study period covers 2019-2033, with 2025 as the base year and a forecast period of 2025-2033. The market value is presented in million units.
Molecular Sieves Market Dynamics & Structure
The Molecular Sieves market is characterized by a moderately concentrated landscape, with key players like Honeywell International Inc, BASF SE, and Zeolyst International holding significant market share. Technological innovation, particularly in materials science and manufacturing processes, is a crucial driver, leading to the development of higher-performance sieves with enhanced selectivity and efficiency. Stringent environmental regulations concerning emissions and water treatment are also boosting demand. Competitive substitutes, such as activated carbon, exist, but molecular sieves maintain an edge due to their superior adsorption capacity and versatility. The end-user demographics are diverse, spanning automotive, pharmaceuticals, oil & gas, and water treatment. M&A activity has been relatively moderate in recent years, with approximately xx deals recorded between 2019 and 2024, primarily focused on expanding distribution networks and acquiring specialized technologies.
- Market Concentration: Moderately concentrated, with top 5 players holding xx% market share in 2024.
- Technological Innovation: Focus on improving selectivity, efficiency, and durability of molecular sieves.
- Regulatory Framework: Stringent environmental regulations drive demand, particularly in water treatment.
- Competitive Substitutes: Activated carbon, but molecular sieves offer superior performance in many applications.
- M&A Activity: Approximately xx deals between 2019 and 2024, mainly focused on distribution and technology acquisition.
- Innovation Barriers: High R&D costs and complexity in materials synthesis.
Molecular Sieves Market Growth Trends & Insights
The global Molecular Sieves Market witnessed a Compound Annual Growth Rate (CAGR) of xx% during the historical period (2019-2024), reaching a market size of xx million units in 2024. This growth is attributed to the increasing demand across various end-use industries, particularly in water purification and gas separation. Technological advancements leading to improved sieve efficiency and selectivity have further fueled market expansion. The market penetration of molecular sieves in emerging economies is expected to increase significantly over the forecast period, driven by rising industrialization and infrastructure development. Shifting consumer preferences towards sustainable and environmentally friendly technologies also contribute to the market's positive outlook. The adoption rate is projected to reach xx% by 2033, with a forecasted CAGR of xx% during 2025-2033.
Dominant Regions, Countries, or Segments in Molecular Sieves Market
The Molecular Sieves market is currently dominated by North America and Europe, collectively holding a significant share of the global market in 2024. While these regions maintain a strong presence, the Asia-Pacific region is poised for the most rapid expansion throughout the forecast period. This accelerated growth is fueled by the region's rapid industrialization, burgeoning infrastructure development, and a rising demand for advanced separation and purification technologies. Analyzing market segments, Zeolites constitute the largest product type segment, owing to their versatility across numerous applications. Similarly, the microporous size segment commands a leading market share due to its superior surface area and exceptional adsorption capabilities. The Oil and Gas sector remains a cornerstone end-user industry, followed by substantial contributions from the Pharmaceutical, and Waste and Water Treatment sectors. The increasing adoption of molecular sieves in emerging applications, such as carbon capture and natural gas processing, is further bolstering market growth.
- Leading Region(s): North America and Europe (holding a combined xx% market share in 2024).
- Fastest-Growing Region: Asia-Pacific (projected CAGR of xx% during 2025-2033, driven by industrialization and infrastructure investments).
- Dominant Product Type: Zeolite (due to its diverse applications).
- Dominant Size: Microporous (owing to high surface area and adsorption capacity).
- Key End-User Industries: Oil & Gas, Pharmaceuticals, Waste & Water Treatment, and emerging applications in carbon capture and natural gas processing.
- Key Drivers: Government regulations promoting environmental sustainability and industrial development, alongside rising demand for efficient separation and purification technologies.
Molecular Sieves Market Product Landscape
Recent innovations focus on enhancing the selectivity, thermal stability, and mechanical strength of molecular sieves. This includes the development of novel materials with tailored pore sizes and surface functionalities. New applications are emerging in areas such as carbon capture, gas purification, and drug delivery. Key performance metrics include adsorption capacity, selectivity, regeneration efficiency, and cost-effectiveness. Unique selling propositions often focus on specific applications or superior performance characteristics compared to existing alternatives.
Key Drivers, Barriers & Challenges in Molecular Sieves Market
Key Drivers:
- Robust demand from water treatment and oil & gas industries, driven by stringent environmental regulations and the need for efficient resource management.
- Stringent environmental regulations globally are mandating the adoption of advanced filtration and purification technologies, creating significant growth opportunities for molecular sieves.
- Continuous technological advancements resulting in improved sieve performance, efficiency, and cost-effectiveness are expanding market applications.
- The increasing focus on sustainable practices across various industries is driving the adoption of environmentally friendly separation technologies, such as molecular sieves.
Key Challenges & Restraints:
- High production costs associated with specialized materials and complex manufacturing processes can limit market accessibility.
- Potential supply chain disruptions, particularly regarding raw material availability and geopolitical factors, can impact production and pricing.
- Intense competition from substitute materials and established players requires continuous innovation and strategic market positioning.
- Fluctuations in raw material prices and energy costs can influence the overall cost-competitiveness of molecular sieves.
Emerging Opportunities in Molecular Sieves Market
Untapped markets exist in developing economies, particularly in sectors like construction and agriculture. Innovative applications in areas like carbon capture and gas separation are presenting significant growth opportunities. Evolving consumer preferences are driving demand for more sustainable and environmentally friendly solutions. The development of novel molecular sieve materials with enhanced properties will unlock new market segments.
Growth Accelerators in the Molecular Sieves Market Industry
The Molecular Sieves market is experiencing robust growth driven by several key accelerators. Significant technological advancements in materials science are continuously enhancing the performance and expanding the applications of molecular sieves. Strategic collaborations between manufacturers and end-users are leading to the development of customized solutions tailored to specific industry needs. Expansion into new and emerging geographic markets, particularly in developing economies with rapidly growing industrial sectors, presents substantial untapped potential. The escalating adoption of advanced technologies across various sectors, including environmental remediation, energy production, and chemical processing, is fueling market demand.
Key Players Shaping the Molecular Sieves Market Market
- Palmer Holland
- Axens
- Honeywell International Inc
- Clariant
- Arkema
- Kuraray Co Ltd
- Merck KGaA
- Zeochem AG
- Sorbead India
- KNT Group
- BASF SE
- Tosoh Corporation
- Zeolyst International
- OMRON Healthcare Inc
- Hengye Inc
- Resonac Holdings Corporation
- CarboTech
- W R Grace & Co -Conn
- JIUZHOU CHEMICALS
- Desicca Chemical Pvt Ltd
Notable Milestones in Molecular Sieves Market Sector
- Oct 2022: Palmer Holland announces a new distribution agreement with Zeochem for Purmol molecular sieves in the US and Canada, expanding market access for high-performance moisture scavengers.
- Jul 2022: Omron Healthcare launches a portable medical molecular sieve-based oxygen concentrator, expanding the applications of molecular sieves in healthcare.
- Mar 2022: A breakthrough in 2D silicon dioxide sieve technology by universities opens doors to new applications in desalination and fuel cells, potentially disrupting the market landscape.
In-Depth Molecular Sieves Market Market Outlook
The Molecular Sieves market is poised for robust growth in the coming years, driven by technological advancements, expanding applications, and increasing environmental concerns. Strategic partnerships and investments in R&D will be crucial for maintaining competitiveness. The market offers significant opportunities for innovation and market expansion, particularly in developing regions and emerging applications. Companies focusing on sustainability and developing advanced materials will be best positioned for long-term success.
Molecular Sieves Market Segmentation
-
1. Shape
- 1.1. Pelleted
- 1.2. Beaded
- 1.3. Powdered
-
2. Size
- 2.1. Microporous
- 2.2. Mesoporous
- 2.3. Macroporous
-
3. Product Type
- 3.1. Carbon
- 3.2. Clay
- 3.3. Porous Glass
- 3.4. Silica Gel
- 3.5. Zeolite
-
4. End-user Industry
- 4.1. Automotive
- 4.2. Cosmetics and Detergent
- 4.3. Oil and Gas
- 4.4. Pharmaceutical
- 4.5. Waste and Water Treatment
- 4.6. Other En
Molecular Sieves Market Segmentation By Geography
-
1. Asia Pacific
- 1.1. China
- 1.2. India
- 1.3. Japan
- 1.4. South Korea
- 1.5. Australia
-
2. Malaysia
- 2.1. Thailand
- 2.2. Indonesia
- 2.3. Vietnam
- 2.4. Rest of Asia Pacific
-
3. North America
- 3.1. United States
- 3.2. Canada
- 3.3. Mexico
- 3.4. Rest of North America
-
4. Europe
- 4.1. Germany
- 4.2. United Kingdom
- 4.3. Italy
- 4.4. France
- 4.5. Russia
- 4.6. Spain
- 4.7. NORDIC
- 4.8. Turkey
- 4.9. Russia
- 4.10. Rest of Europe
-
5. South America
- 5.1. Brazil
- 5.2. Argentina
- 5.3. Colombia
- 5.4. Rest of South America
-
6. Middle East and Africa
- 6.1. Saudi Arabia
- 6.2. South Africa
- 6.3. Nigeria
- 6.4. Qatar
- 6.5. Egypt
- 6.6. UAE
- 6.7. Rest of Middle East and Africa
Molecular Sieves Market Regional Market Share
Geographic Coverage of Molecular Sieves Market
Molecular Sieves Market REPORT HIGHLIGHTS
| Aspects | Details |
|---|---|
| Study Period | 2020-2034 |
| Base Year | 2025 |
| Estimated Year | 2026 |
| Forecast Period | 2026-2034 |
| Historical Period | 2020-2025 |
| Growth Rate | CAGR of > 4.50% from 2020-2034 |
| Segmentation |
|
Table of Contents
- 1. Introduction
- 1.1. Research Scope
- 1.2. Market Segmentation
- 1.3. Research Objective
- 1.4. Definitions and Assumptions
- 2. Executive Summary
- 2.1. Market Snapshot
- 3. Market Dynamics
- 3.1. Market Drivers
- 3.2. Market Restrains
- 3.3. Market Trends
- 3.4. Market Opportunities
- 4. Market Factor Analysis
- 4.1. Porters Five Forces
- 4.1.1. Bargaining Power of Suppliers
- 4.1.2. Bargaining Power of Buyers
- 4.1.3. Threat of New Entrants
- 4.1.4. Threat of Substitutes
- 4.1.5. Competitive Rivalry
- 4.2. PESTEL analysis
- 4.3. BCG Analysis
- 4.3.1. Stars (High Growth, High Market Share)
- 4.3.2. Cash Cows (Low Growth, High Market Share)
- 4.3.3. Question Mark (High Growth, Low Market Share)
- 4.3.4. Dogs (Low Growth, Low Market Share)
- 4.4. Ansoff Matrix Analysis
- 4.5. Supply Chain Analysis
- 4.6. Regulatory Landscape
- 4.7. Current Market Potential and Opportunity Assessment (TAM–SAM–SOM Framework)
- 4.8. VDR Analyst Note
- 4.1. Porters Five Forces
- 5. Market Analysis, Insights and Forecast 2021-2033
- 5.1. Market Analysis, Insights and Forecast - by Shape
- 5.1.1. Pelleted
- 5.1.2. Beaded
- 5.1.3. Powdered
- 5.2. Market Analysis, Insights and Forecast - by Size
- 5.2.1. Microporous
- 5.2.2. Mesoporous
- 5.2.3. Macroporous
- 5.3. Market Analysis, Insights and Forecast - by Product Type
- 5.3.1. Carbon
- 5.3.2. Clay
- 5.3.3. Porous Glass
- 5.3.4. Silica Gel
- 5.3.5. Zeolite
- 5.4. Market Analysis, Insights and Forecast - by End-user Industry
- 5.4.1. Automotive
- 5.4.2. Cosmetics and Detergent
- 5.4.3. Oil and Gas
- 5.4.4. Pharmaceutical
- 5.4.5. Waste and Water Treatment
- 5.4.6. Other En
- 5.5. Market Analysis, Insights and Forecast - by Region
- 5.5.1. Asia Pacific
- 5.5.2. Malaysia
- 5.5.3. North America
- 5.5.4. Europe
- 5.5.5. South America
- 5.5.6. Middle East and Africa
- 5.1. Market Analysis, Insights and Forecast - by Shape
- 6. Global Molecular Sieves Market Analysis, Insights and Forecast, 2021-2033
- 6.1. Market Analysis, Insights and Forecast - by Shape
- 6.1.1. Pelleted
- 6.1.2. Beaded
- 6.1.3. Powdered
- 6.2. Market Analysis, Insights and Forecast - by Size
- 6.2.1. Microporous
- 6.2.2. Mesoporous
- 6.2.3. Macroporous
- 6.3. Market Analysis, Insights and Forecast - by Product Type
- 6.3.1. Carbon
- 6.3.2. Clay
- 6.3.3. Porous Glass
- 6.3.4. Silica Gel
- 6.3.5. Zeolite
- 6.4. Market Analysis, Insights and Forecast - by End-user Industry
- 6.4.1. Automotive
- 6.4.2. Cosmetics and Detergent
- 6.4.3. Oil and Gas
- 6.4.4. Pharmaceutical
- 6.4.5. Waste and Water Treatment
- 6.4.6. Other En
- 6.1. Market Analysis, Insights and Forecast - by Shape
- 7. Asia Pacific Molecular Sieves Market Analysis, Insights and Forecast, 2021-2033
- 7.1. Market Analysis, Insights and Forecast - by Shape
- 7.1.1. Pelleted
- 7.1.2. Beaded
- 7.1.3. Powdered
- 7.2. Market Analysis, Insights and Forecast - by Size
- 7.2.1. Microporous
- 7.2.2. Mesoporous
- 7.2.3. Macroporous
- 7.3. Market Analysis, Insights and Forecast - by Product Type
- 7.3.1. Carbon
- 7.3.2. Clay
- 7.3.3. Porous Glass
- 7.3.4. Silica Gel
- 7.3.5. Zeolite
- 7.4. Market Analysis, Insights and Forecast - by End-user Industry
- 7.4.1. Automotive
- 7.4.2. Cosmetics and Detergent
- 7.4.3. Oil and Gas
- 7.4.4. Pharmaceutical
- 7.4.5. Waste and Water Treatment
- 7.4.6. Other En
- 7.1. Market Analysis, Insights and Forecast - by Shape
- 8. Malaysia Molecular Sieves Market Analysis, Insights and Forecast, 2021-2033
- 8.1. Market Analysis, Insights and Forecast - by Shape
- 8.1.1. Pelleted
- 8.1.2. Beaded
- 8.1.3. Powdered
- 8.2. Market Analysis, Insights and Forecast - by Size
- 8.2.1. Microporous
- 8.2.2. Mesoporous
- 8.2.3. Macroporous
- 8.3. Market Analysis, Insights and Forecast - by Product Type
- 8.3.1. Carbon
- 8.3.2. Clay
- 8.3.3. Porous Glass
- 8.3.4. Silica Gel
- 8.3.5. Zeolite
- 8.4. Market Analysis, Insights and Forecast - by End-user Industry
- 8.4.1. Automotive
- 8.4.2. Cosmetics and Detergent
- 8.4.3. Oil and Gas
- 8.4.4. Pharmaceutical
- 8.4.5. Waste and Water Treatment
- 8.4.6. Other En
- 8.1. Market Analysis, Insights and Forecast - by Shape
- 9. North America Molecular Sieves Market Analysis, Insights and Forecast, 2021-2033
- 9.1. Market Analysis, Insights and Forecast - by Shape
- 9.1.1. Pelleted
- 9.1.2. Beaded
- 9.1.3. Powdered
- 9.2. Market Analysis, Insights and Forecast - by Size
- 9.2.1. Microporous
- 9.2.2. Mesoporous
- 9.2.3. Macroporous
- 9.3. Market Analysis, Insights and Forecast - by Product Type
- 9.3.1. Carbon
- 9.3.2. Clay
- 9.3.3. Porous Glass
- 9.3.4. Silica Gel
- 9.3.5. Zeolite
- 9.4. Market Analysis, Insights and Forecast - by End-user Industry
- 9.4.1. Automotive
- 9.4.2. Cosmetics and Detergent
- 9.4.3. Oil and Gas
- 9.4.4. Pharmaceutical
- 9.4.5. Waste and Water Treatment
- 9.4.6. Other En
- 9.1. Market Analysis, Insights and Forecast - by Shape
- 10. Europe Molecular Sieves Market Analysis, Insights and Forecast, 2021-2033
- 10.1. Market Analysis, Insights and Forecast - by Shape
- 10.1.1. Pelleted
- 10.1.2. Beaded
- 10.1.3. Powdered
- 10.2. Market Analysis, Insights and Forecast - by Size
- 10.2.1. Microporous
- 10.2.2. Mesoporous
- 10.2.3. Macroporous
- 10.3. Market Analysis, Insights and Forecast - by Product Type
- 10.3.1. Carbon
- 10.3.2. Clay
- 10.3.3. Porous Glass
- 10.3.4. Silica Gel
- 10.3.5. Zeolite
- 10.4. Market Analysis, Insights and Forecast - by End-user Industry
- 10.4.1. Automotive
- 10.4.2. Cosmetics and Detergent
- 10.4.3. Oil and Gas
- 10.4.4. Pharmaceutical
- 10.4.5. Waste and Water Treatment
- 10.4.6. Other En
- 10.1. Market Analysis, Insights and Forecast - by Shape
- 11. South America Molecular Sieves Market Analysis, Insights and Forecast, 2021-2033
- 11.1. Market Analysis, Insights and Forecast - by Shape
- 11.1.1. Pelleted
- 11.1.2. Beaded
- 11.1.3. Powdered
- 11.2. Market Analysis, Insights and Forecast - by Size
- 11.2.1. Microporous
- 11.2.2. Mesoporous
- 11.2.3. Macroporous
- 11.3. Market Analysis, Insights and Forecast - by Product Type
- 11.3.1. Carbon
- 11.3.2. Clay
- 11.3.3. Porous Glass
- 11.3.4. Silica Gel
- 11.3.5. Zeolite
- 11.4. Market Analysis, Insights and Forecast - by End-user Industry
- 11.4.1. Automotive
- 11.4.2. Cosmetics and Detergent
- 11.4.3. Oil and Gas
- 11.4.4. Pharmaceutical
- 11.4.5. Waste and Water Treatment
- 11.4.6. Other En
- 11.1. Market Analysis, Insights and Forecast - by Shape
- 12. Middle East and Africa Molecular Sieves Market Analysis, Insights and Forecast, 2021-2033
- 12.1. Market Analysis, Insights and Forecast - by Shape
- 12.1.1. Pelleted
- 12.1.2. Beaded
- 12.1.3. Powdered
- 12.2. Market Analysis, Insights and Forecast - by Size
- 12.2.1. Microporous
- 12.2.2. Mesoporous
- 12.2.3. Macroporous
- 12.3. Market Analysis, Insights and Forecast - by Product Type
- 12.3.1. Carbon
- 12.3.2. Clay
- 12.3.3. Porous Glass
- 12.3.4. Silica Gel
- 12.3.5. Zeolite
- 12.4. Market Analysis, Insights and Forecast - by End-user Industry
- 12.4.1. Automotive
- 12.4.2. Cosmetics and Detergent
- 12.4.3. Oil and Gas
- 12.4.4. Pharmaceutical
- 12.4.5. Waste and Water Treatment
- 12.4.6. Other En
- 12.1. Market Analysis, Insights and Forecast - by Shape
- 13. Competitive Analysis
- 13.1. Company Profiles
- 13.1.1 Palmer Holland
- 13.1.1.1. Company Overview
- 13.1.1.2. Products
- 13.1.1.3. Company Financials
- 13.1.1.4. SWOT Analysis
- 13.1.2 Axens
- 13.1.2.1. Company Overview
- 13.1.2.2. Products
- 13.1.2.3. Company Financials
- 13.1.2.4. SWOT Analysis
- 13.1.3 Honeywell International Inc
- 13.1.3.1. Company Overview
- 13.1.3.2. Products
- 13.1.3.3. Company Financials
- 13.1.3.4. SWOT Analysis
- 13.1.4 Clariant
- 13.1.4.1. Company Overview
- 13.1.4.2. Products
- 13.1.4.3. Company Financials
- 13.1.4.4. SWOT Analysis
- 13.1.5 Arkema
- 13.1.5.1. Company Overview
- 13.1.5.2. Products
- 13.1.5.3. Company Financials
- 13.1.5.4. SWOT Analysis
- 13.1.6 Kuraray Co Ltd
- 13.1.6.1. Company Overview
- 13.1.6.2. Products
- 13.1.6.3. Company Financials
- 13.1.6.4. SWOT Analysis
- 13.1.7 Merck KGaA
- 13.1.7.1. Company Overview
- 13.1.7.2. Products
- 13.1.7.3. Company Financials
- 13.1.7.4. SWOT Analysis
- 13.1.8 Zeochem AG
- 13.1.8.1. Company Overview
- 13.1.8.2. Products
- 13.1.8.3. Company Financials
- 13.1.8.4. SWOT Analysis
- 13.1.9 Sorbead India
- 13.1.9.1. Company Overview
- 13.1.9.2. Products
- 13.1.9.3. Company Financials
- 13.1.9.4. SWOT Analysis
- 13.1.10 KNT Group
- 13.1.10.1. Company Overview
- 13.1.10.2. Products
- 13.1.10.3. Company Financials
- 13.1.10.4. SWOT Analysis
- 13.1.11 BASF SE
- 13.1.11.1. Company Overview
- 13.1.11.2. Products
- 13.1.11.3. Company Financials
- 13.1.11.4. SWOT Analysis
- 13.1.12 Tosoh Corporation
- 13.1.12.1. Company Overview
- 13.1.12.2. Products
- 13.1.12.3. Company Financials
- 13.1.12.4. SWOT Analysis
- 13.1.13 Zeolyst International
- 13.1.13.1. Company Overview
- 13.1.13.2. Products
- 13.1.13.3. Company Financials
- 13.1.13.4. SWOT Analysis
- 13.1.14 OMRON Healthcare Inc
- 13.1.14.1. Company Overview
- 13.1.14.2. Products
- 13.1.14.3. Company Financials
- 13.1.14.4. SWOT Analysis
- 13.1.15 Hengye Inc
- 13.1.15.1. Company Overview
- 13.1.15.2. Products
- 13.1.15.3. Company Financials
- 13.1.15.4. SWOT Analysis
- 13.1.16 Resonac Holdings Corporation
- 13.1.16.1. Company Overview
- 13.1.16.2. Products
- 13.1.16.3. Company Financials
- 13.1.16.4. SWOT Analysis
- 13.1.17 CarboTech
- 13.1.17.1. Company Overview
- 13.1.17.2. Products
- 13.1.17.3. Company Financials
- 13.1.17.4. SWOT Analysis
- 13.1.18 W R Grace & Co -Conn
- 13.1.18.1. Company Overview
- 13.1.18.2. Products
- 13.1.18.3. Company Financials
- 13.1.18.4. SWOT Analysis
- 13.1.19 JIUZHOU CHEMICALS
- 13.1.19.1. Company Overview
- 13.1.19.2. Products
- 13.1.19.3. Company Financials
- 13.1.19.4. SWOT Analysis
- 13.1.20 Desicca Chemical Pvt Ltd
- 13.1.20.1. Company Overview
- 13.1.20.2. Products
- 13.1.20.3. Company Financials
- 13.1.20.4. SWOT Analysis
- 13.1.1 Palmer Holland
- 13.2. Market Entropy
- 13.2.1 Company's Key Areas Served
- 13.2.2 Recent Developments
- 13.3. Company Market Share Analysis 2025
- 13.3.1 Top 5 Companies Market Share Analysis
- 13.3.2 Top 3 Companies Market Share Analysis
- 13.4. List of Potential Customers
- 14. Research Methodology
List of Figures
- Figure 1: Global Molecular Sieves Market Revenue Breakdown (Million, %) by Region 2025 & 2033
- Figure 2: Global Molecular Sieves Market Volume Breakdown (K Tons, %) by Region 2025 & 2033
- Figure 3: Asia Pacific Molecular Sieves Market Revenue (Million), by Shape 2025 & 2033
- Figure 4: Asia Pacific Molecular Sieves Market Volume (K Tons), by Shape 2025 & 2033
- Figure 5: Asia Pacific Molecular Sieves Market Revenue Share (%), by Shape 2025 & 2033
- Figure 6: Asia Pacific Molecular Sieves Market Volume Share (%), by Shape 2025 & 2033
- Figure 7: Asia Pacific Molecular Sieves Market Revenue (Million), by Size 2025 & 2033
- Figure 8: Asia Pacific Molecular Sieves Market Volume (K Tons), by Size 2025 & 2033
- Figure 9: Asia Pacific Molecular Sieves Market Revenue Share (%), by Size 2025 & 2033
- Figure 10: Asia Pacific Molecular Sieves Market Volume Share (%), by Size 2025 & 2033
- Figure 11: Asia Pacific Molecular Sieves Market Revenue (Million), by Product Type 2025 & 2033
- Figure 12: Asia Pacific Molecular Sieves Market Volume (K Tons), by Product Type 2025 & 2033
- Figure 13: Asia Pacific Molecular Sieves Market Revenue Share (%), by Product Type 2025 & 2033
- Figure 14: Asia Pacific Molecular Sieves Market Volume Share (%), by Product Type 2025 & 2033
- Figure 15: Asia Pacific Molecular Sieves Market Revenue (Million), by End-user Industry 2025 & 2033
- Figure 16: Asia Pacific Molecular Sieves Market Volume (K Tons), by End-user Industry 2025 & 2033
- Figure 17: Asia Pacific Molecular Sieves Market Revenue Share (%), by End-user Industry 2025 & 2033
- Figure 18: Asia Pacific Molecular Sieves Market Volume Share (%), by End-user Industry 2025 & 2033
- Figure 19: Asia Pacific Molecular Sieves Market Revenue (Million), by Country 2025 & 2033
- Figure 20: Asia Pacific Molecular Sieves Market Volume (K Tons), by Country 2025 & 2033
- Figure 21: Asia Pacific Molecular Sieves Market Revenue Share (%), by Country 2025 & 2033
- Figure 22: Asia Pacific Molecular Sieves Market Volume Share (%), by Country 2025 & 2033
- Figure 23: Malaysia Molecular Sieves Market Revenue (Million), by Shape 2025 & 2033
- Figure 24: Malaysia Molecular Sieves Market Volume (K Tons), by Shape 2025 & 2033
- Figure 25: Malaysia Molecular Sieves Market Revenue Share (%), by Shape 2025 & 2033
- Figure 26: Malaysia Molecular Sieves Market Volume Share (%), by Shape 2025 & 2033
- Figure 27: Malaysia Molecular Sieves Market Revenue (Million), by Size 2025 & 2033
- Figure 28: Malaysia Molecular Sieves Market Volume (K Tons), by Size 2025 & 2033
- Figure 29: Malaysia Molecular Sieves Market Revenue Share (%), by Size 2025 & 2033
- Figure 30: Malaysia Molecular Sieves Market Volume Share (%), by Size 2025 & 2033
- Figure 31: Malaysia Molecular Sieves Market Revenue (Million), by Product Type 2025 & 2033
- Figure 32: Malaysia Molecular Sieves Market Volume (K Tons), by Product Type 2025 & 2033
- Figure 33: Malaysia Molecular Sieves Market Revenue Share (%), by Product Type 2025 & 2033
- Figure 34: Malaysia Molecular Sieves Market Volume Share (%), by Product Type 2025 & 2033
- Figure 35: Malaysia Molecular Sieves Market Revenue (Million), by End-user Industry 2025 & 2033
- Figure 36: Malaysia Molecular Sieves Market Volume (K Tons), by End-user Industry 2025 & 2033
- Figure 37: Malaysia Molecular Sieves Market Revenue Share (%), by End-user Industry 2025 & 2033
- Figure 38: Malaysia Molecular Sieves Market Volume Share (%), by End-user Industry 2025 & 2033
- Figure 39: Malaysia Molecular Sieves Market Revenue (Million), by Country 2025 & 2033
- Figure 40: Malaysia Molecular Sieves Market Volume (K Tons), by Country 2025 & 2033
- Figure 41: Malaysia Molecular Sieves Market Revenue Share (%), by Country 2025 & 2033
- Figure 42: Malaysia Molecular Sieves Market Volume Share (%), by Country 2025 & 2033
- Figure 43: North America Molecular Sieves Market Revenue (Million), by Shape 2025 & 2033
- Figure 44: North America Molecular Sieves Market Volume (K Tons), by Shape 2025 & 2033
- Figure 45: North America Molecular Sieves Market Revenue Share (%), by Shape 2025 & 2033
- Figure 46: North America Molecular Sieves Market Volume Share (%), by Shape 2025 & 2033
- Figure 47: North America Molecular Sieves Market Revenue (Million), by Size 2025 & 2033
- Figure 48: North America Molecular Sieves Market Volume (K Tons), by Size 2025 & 2033
- Figure 49: North America Molecular Sieves Market Revenue Share (%), by Size 2025 & 2033
- Figure 50: North America Molecular Sieves Market Volume Share (%), by Size 2025 & 2033
- Figure 51: North America Molecular Sieves Market Revenue (Million), by Product Type 2025 & 2033
- Figure 52: North America Molecular Sieves Market Volume (K Tons), by Product Type 2025 & 2033
- Figure 53: North America Molecular Sieves Market Revenue Share (%), by Product Type 2025 & 2033
- Figure 54: North America Molecular Sieves Market Volume Share (%), by Product Type 2025 & 2033
- Figure 55: North America Molecular Sieves Market Revenue (Million), by End-user Industry 2025 & 2033
- Figure 56: North America Molecular Sieves Market Volume (K Tons), by End-user Industry 2025 & 2033
- Figure 57: North America Molecular Sieves Market Revenue Share (%), by End-user Industry 2025 & 2033
- Figure 58: North America Molecular Sieves Market Volume Share (%), by End-user Industry 2025 & 2033
- Figure 59: North America Molecular Sieves Market Revenue (Million), by Country 2025 & 2033
- Figure 60: North America Molecular Sieves Market Volume (K Tons), by Country 2025 & 2033
- Figure 61: North America Molecular Sieves Market Revenue Share (%), by Country 2025 & 2033
- Figure 62: North America Molecular Sieves Market Volume Share (%), by Country 2025 & 2033
- Figure 63: Europe Molecular Sieves Market Revenue (Million), by Shape 2025 & 2033
- Figure 64: Europe Molecular Sieves Market Volume (K Tons), by Shape 2025 & 2033
- Figure 65: Europe Molecular Sieves Market Revenue Share (%), by Shape 2025 & 2033
- Figure 66: Europe Molecular Sieves Market Volume Share (%), by Shape 2025 & 2033
- Figure 67: Europe Molecular Sieves Market Revenue (Million), by Size 2025 & 2033
- Figure 68: Europe Molecular Sieves Market Volume (K Tons), by Size 2025 & 2033
- Figure 69: Europe Molecular Sieves Market Revenue Share (%), by Size 2025 & 2033
- Figure 70: Europe Molecular Sieves Market Volume Share (%), by Size 2025 & 2033
- Figure 71: Europe Molecular Sieves Market Revenue (Million), by Product Type 2025 & 2033
- Figure 72: Europe Molecular Sieves Market Volume (K Tons), by Product Type 2025 & 2033
- Figure 73: Europe Molecular Sieves Market Revenue Share (%), by Product Type 2025 & 2033
- Figure 74: Europe Molecular Sieves Market Volume Share (%), by Product Type 2025 & 2033
- Figure 75: Europe Molecular Sieves Market Revenue (Million), by End-user Industry 2025 & 2033
- Figure 76: Europe Molecular Sieves Market Volume (K Tons), by End-user Industry 2025 & 2033
- Figure 77: Europe Molecular Sieves Market Revenue Share (%), by End-user Industry 2025 & 2033
- Figure 78: Europe Molecular Sieves Market Volume Share (%), by End-user Industry 2025 & 2033
- Figure 79: Europe Molecular Sieves Market Revenue (Million), by Country 2025 & 2033
- Figure 80: Europe Molecular Sieves Market Volume (K Tons), by Country 2025 & 2033
- Figure 81: Europe Molecular Sieves Market Revenue Share (%), by Country 2025 & 2033
- Figure 82: Europe Molecular Sieves Market Volume Share (%), by Country 2025 & 2033
- Figure 83: South America Molecular Sieves Market Revenue (Million), by Shape 2025 & 2033
- Figure 84: South America Molecular Sieves Market Volume (K Tons), by Shape 2025 & 2033
- Figure 85: South America Molecular Sieves Market Revenue Share (%), by Shape 2025 & 2033
- Figure 86: South America Molecular Sieves Market Volume Share (%), by Shape 2025 & 2033
- Figure 87: South America Molecular Sieves Market Revenue (Million), by Size 2025 & 2033
- Figure 88: South America Molecular Sieves Market Volume (K Tons), by Size 2025 & 2033
- Figure 89: South America Molecular Sieves Market Revenue Share (%), by Size 2025 & 2033
- Figure 90: South America Molecular Sieves Market Volume Share (%), by Size 2025 & 2033
- Figure 91: South America Molecular Sieves Market Revenue (Million), by Product Type 2025 & 2033
- Figure 92: South America Molecular Sieves Market Volume (K Tons), by Product Type 2025 & 2033
- Figure 93: South America Molecular Sieves Market Revenue Share (%), by Product Type 2025 & 2033
- Figure 94: South America Molecular Sieves Market Volume Share (%), by Product Type 2025 & 2033
- Figure 95: South America Molecular Sieves Market Revenue (Million), by End-user Industry 2025 & 2033
- Figure 96: South America Molecular Sieves Market Volume (K Tons), by End-user Industry 2025 & 2033
- Figure 97: South America Molecular Sieves Market Revenue Share (%), by End-user Industry 2025 & 2033
- Figure 98: South America Molecular Sieves Market Volume Share (%), by End-user Industry 2025 & 2033
- Figure 99: South America Molecular Sieves Market Revenue (Million), by Country 2025 & 2033
- Figure 100: South America Molecular Sieves Market Volume (K Tons), by Country 2025 & 2033
- Figure 101: South America Molecular Sieves Market Revenue Share (%), by Country 2025 & 2033
- Figure 102: South America Molecular Sieves Market Volume Share (%), by Country 2025 & 2033
- Figure 103: Middle East and Africa Molecular Sieves Market Revenue (Million), by Shape 2025 & 2033
- Figure 104: Middle East and Africa Molecular Sieves Market Volume (K Tons), by Shape 2025 & 2033
- Figure 105: Middle East and Africa Molecular Sieves Market Revenue Share (%), by Shape 2025 & 2033
- Figure 106: Middle East and Africa Molecular Sieves Market Volume Share (%), by Shape 2025 & 2033
- Figure 107: Middle East and Africa Molecular Sieves Market Revenue (Million), by Size 2025 & 2033
- Figure 108: Middle East and Africa Molecular Sieves Market Volume (K Tons), by Size 2025 & 2033
- Figure 109: Middle East and Africa Molecular Sieves Market Revenue Share (%), by Size 2025 & 2033
- Figure 110: Middle East and Africa Molecular Sieves Market Volume Share (%), by Size 2025 & 2033
- Figure 111: Middle East and Africa Molecular Sieves Market Revenue (Million), by Product Type 2025 & 2033
- Figure 112: Middle East and Africa Molecular Sieves Market Volume (K Tons), by Product Type 2025 & 2033
- Figure 113: Middle East and Africa Molecular Sieves Market Revenue Share (%), by Product Type 2025 & 2033
- Figure 114: Middle East and Africa Molecular Sieves Market Volume Share (%), by Product Type 2025 & 2033
- Figure 115: Middle East and Africa Molecular Sieves Market Revenue (Million), by End-user Industry 2025 & 2033
- Figure 116: Middle East and Africa Molecular Sieves Market Volume (K Tons), by End-user Industry 2025 & 2033
- Figure 117: Middle East and Africa Molecular Sieves Market Revenue Share (%), by End-user Industry 2025 & 2033
- Figure 118: Middle East and Africa Molecular Sieves Market Volume Share (%), by End-user Industry 2025 & 2033
- Figure 119: Middle East and Africa Molecular Sieves Market Revenue (Million), by Country 2025 & 2033
- Figure 120: Middle East and Africa Molecular Sieves Market Volume (K Tons), by Country 2025 & 2033
- Figure 121: Middle East and Africa Molecular Sieves Market Revenue Share (%), by Country 2025 & 2033
- Figure 122: Middle East and Africa Molecular Sieves Market Volume Share (%), by Country 2025 & 2033
List of Tables
- Table 1: Global Molecular Sieves Market Revenue Million Forecast, by Shape 2020 & 2033
- Table 2: Global Molecular Sieves Market Volume K Tons Forecast, by Shape 2020 & 2033
- Table 3: Global Molecular Sieves Market Revenue Million Forecast, by Size 2020 & 2033
- Table 4: Global Molecular Sieves Market Volume K Tons Forecast, by Size 2020 & 2033
- Table 5: Global Molecular Sieves Market Revenue Million Forecast, by Product Type 2020 & 2033
- Table 6: Global Molecular Sieves Market Volume K Tons Forecast, by Product Type 2020 & 2033
- Table 7: Global Molecular Sieves Market Revenue Million Forecast, by End-user Industry 2020 & 2033
- Table 8: Global Molecular Sieves Market Volume K Tons Forecast, by End-user Industry 2020 & 2033
- Table 9: Global Molecular Sieves Market Revenue Million Forecast, by Region 2020 & 2033
- Table 10: Global Molecular Sieves Market Volume K Tons Forecast, by Region 2020 & 2033
- Table 11: Global Molecular Sieves Market Revenue Million Forecast, by Shape 2020 & 2033
- Table 12: Global Molecular Sieves Market Volume K Tons Forecast, by Shape 2020 & 2033
- Table 13: Global Molecular Sieves Market Revenue Million Forecast, by Size 2020 & 2033
- Table 14: Global Molecular Sieves Market Volume K Tons Forecast, by Size 2020 & 2033
- Table 15: Global Molecular Sieves Market Revenue Million Forecast, by Product Type 2020 & 2033
- Table 16: Global Molecular Sieves Market Volume K Tons Forecast, by Product Type 2020 & 2033
- Table 17: Global Molecular Sieves Market Revenue Million Forecast, by End-user Industry 2020 & 2033
- Table 18: Global Molecular Sieves Market Volume K Tons Forecast, by End-user Industry 2020 & 2033
- Table 19: Global Molecular Sieves Market Revenue Million Forecast, by Country 2020 & 2033
- Table 20: Global Molecular Sieves Market Volume K Tons Forecast, by Country 2020 & 2033
- Table 21: China Molecular Sieves Market Revenue (Million) Forecast, by Application 2020 & 2033
- Table 22: China Molecular Sieves Market Volume (K Tons) Forecast, by Application 2020 & 2033
- Table 23: India Molecular Sieves Market Revenue (Million) Forecast, by Application 2020 & 2033
- Table 24: India Molecular Sieves Market Volume (K Tons) Forecast, by Application 2020 & 2033
- Table 25: Japan Molecular Sieves Market Revenue (Million) Forecast, by Application 2020 & 2033
- Table 26: Japan Molecular Sieves Market Volume (K Tons) Forecast, by Application 2020 & 2033
- Table 27: South Korea Molecular Sieves Market Revenue (Million) Forecast, by Application 2020 & 2033
- Table 28: South Korea Molecular Sieves Market Volume (K Tons) Forecast, by Application 2020 & 2033
- Table 29: Australia Molecular Sieves Market Revenue (Million) Forecast, by Application 2020 & 2033
- Table 30: Australia Molecular Sieves Market Volume (K Tons) Forecast, by Application 2020 & 2033
- Table 31: Global Molecular Sieves Market Revenue Million Forecast, by Shape 2020 & 2033
- Table 32: Global Molecular Sieves Market Volume K Tons Forecast, by Shape 2020 & 2033
- Table 33: Global Molecular Sieves Market Revenue Million Forecast, by Size 2020 & 2033
- Table 34: Global Molecular Sieves Market Volume K Tons Forecast, by Size 2020 & 2033
- Table 35: Global Molecular Sieves Market Revenue Million Forecast, by Product Type 2020 & 2033
- Table 36: Global Molecular Sieves Market Volume K Tons Forecast, by Product Type 2020 & 2033
- Table 37: Global Molecular Sieves Market Revenue Million Forecast, by End-user Industry 2020 & 2033
- Table 38: Global Molecular Sieves Market Volume K Tons Forecast, by End-user Industry 2020 & 2033
- Table 39: Global Molecular Sieves Market Revenue Million Forecast, by Country 2020 & 2033
- Table 40: Global Molecular Sieves Market Volume K Tons Forecast, by Country 2020 & 2033
- Table 41: Thailand Molecular Sieves Market Revenue (Million) Forecast, by Application 2020 & 2033
- Table 42: Thailand Molecular Sieves Market Volume (K Tons) Forecast, by Application 2020 & 2033
- Table 43: Indonesia Molecular Sieves Market Revenue (Million) Forecast, by Application 2020 & 2033
- Table 44: Indonesia Molecular Sieves Market Volume (K Tons) Forecast, by Application 2020 & 2033
- Table 45: Vietnam Molecular Sieves Market Revenue (Million) Forecast, by Application 2020 & 2033
- Table 46: Vietnam Molecular Sieves Market Volume (K Tons) Forecast, by Application 2020 & 2033
- Table 47: Rest of Asia Pacific Molecular Sieves Market Revenue (Million) Forecast, by Application 2020 & 2033
- Table 48: Rest of Asia Pacific Molecular Sieves Market Volume (K Tons) Forecast, by Application 2020 & 2033
- Table 49: Global Molecular Sieves Market Revenue Million Forecast, by Shape 2020 & 2033
- Table 50: Global Molecular Sieves Market Volume K Tons Forecast, by Shape 2020 & 2033
- Table 51: Global Molecular Sieves Market Revenue Million Forecast, by Size 2020 & 2033
- Table 52: Global Molecular Sieves Market Volume K Tons Forecast, by Size 2020 & 2033
- Table 53: Global Molecular Sieves Market Revenue Million Forecast, by Product Type 2020 & 2033
- Table 54: Global Molecular Sieves Market Volume K Tons Forecast, by Product Type 2020 & 2033
- Table 55: Global Molecular Sieves Market Revenue Million Forecast, by End-user Industry 2020 & 2033
- Table 56: Global Molecular Sieves Market Volume K Tons Forecast, by End-user Industry 2020 & 2033
- Table 57: Global Molecular Sieves Market Revenue Million Forecast, by Country 2020 & 2033
- Table 58: Global Molecular Sieves Market Volume K Tons Forecast, by Country 2020 & 2033
- Table 59: United States Molecular Sieves Market Revenue (Million) Forecast, by Application 2020 & 2033
- Table 60: United States Molecular Sieves Market Volume (K Tons) Forecast, by Application 2020 & 2033
- Table 61: Canada Molecular Sieves Market Revenue (Million) Forecast, by Application 2020 & 2033
- Table 62: Canada Molecular Sieves Market Volume (K Tons) Forecast, by Application 2020 & 2033
- Table 63: Mexico Molecular Sieves Market Revenue (Million) Forecast, by Application 2020 & 2033
- Table 64: Mexico Molecular Sieves Market Volume (K Tons) Forecast, by Application 2020 & 2033
- Table 65: Rest of North America Molecular Sieves Market Revenue (Million) Forecast, by Application 2020 & 2033
- Table 66: Rest of North America Molecular Sieves Market Volume (K Tons) Forecast, by Application 2020 & 2033
- Table 67: Global Molecular Sieves Market Revenue Million Forecast, by Shape 2020 & 2033
- Table 68: Global Molecular Sieves Market Volume K Tons Forecast, by Shape 2020 & 2033
- Table 69: Global Molecular Sieves Market Revenue Million Forecast, by Size 2020 & 2033
- Table 70: Global Molecular Sieves Market Volume K Tons Forecast, by Size 2020 & 2033
- Table 71: Global Molecular Sieves Market Revenue Million Forecast, by Product Type 2020 & 2033
- Table 72: Global Molecular Sieves Market Volume K Tons Forecast, by Product Type 2020 & 2033
- Table 73: Global Molecular Sieves Market Revenue Million Forecast, by End-user Industry 2020 & 2033
- Table 74: Global Molecular Sieves Market Volume K Tons Forecast, by End-user Industry 2020 & 2033
- Table 75: Global Molecular Sieves Market Revenue Million Forecast, by Country 2020 & 2033
- Table 76: Global Molecular Sieves Market Volume K Tons Forecast, by Country 2020 & 2033
- Table 77: Germany Molecular Sieves Market Revenue (Million) Forecast, by Application 2020 & 2033
- Table 78: Germany Molecular Sieves Market Volume (K Tons) Forecast, by Application 2020 & 2033
- Table 79: United Kingdom Molecular Sieves Market Revenue (Million) Forecast, by Application 2020 & 2033
- Table 80: United Kingdom Molecular Sieves Market Volume (K Tons) Forecast, by Application 2020 & 2033
- Table 81: Italy Molecular Sieves Market Revenue (Million) Forecast, by Application 2020 & 2033
- Table 82: Italy Molecular Sieves Market Volume (K Tons) Forecast, by Application 2020 & 2033
- Table 83: France Molecular Sieves Market Revenue (Million) Forecast, by Application 2020 & 2033
- Table 84: France Molecular Sieves Market Volume (K Tons) Forecast, by Application 2020 & 2033
- Table 85: Russia Molecular Sieves Market Revenue (Million) Forecast, by Application 2020 & 2033
- Table 86: Russia Molecular Sieves Market Volume (K Tons) Forecast, by Application 2020 & 2033
- Table 87: Spain Molecular Sieves Market Revenue (Million) Forecast, by Application 2020 & 2033
- Table 88: Spain Molecular Sieves Market Volume (K Tons) Forecast, by Application 2020 & 2033
- Table 89: NORDIC Molecular Sieves Market Revenue (Million) Forecast, by Application 2020 & 2033
- Table 90: NORDIC Molecular Sieves Market Volume (K Tons) Forecast, by Application 2020 & 2033
- Table 91: Turkey Molecular Sieves Market Revenue (Million) Forecast, by Application 2020 & 2033
- Table 92: Turkey Molecular Sieves Market Volume (K Tons) Forecast, by Application 2020 & 2033
- Table 93: Russia Molecular Sieves Market Revenue (Million) Forecast, by Application 2020 & 2033
- Table 94: Russia Molecular Sieves Market Volume (K Tons) Forecast, by Application 2020 & 2033
- Table 95: Rest of Europe Molecular Sieves Market Revenue (Million) Forecast, by Application 2020 & 2033
- Table 96: Rest of Europe Molecular Sieves Market Volume (K Tons) Forecast, by Application 2020 & 2033
- Table 97: Global Molecular Sieves Market Revenue Million Forecast, by Shape 2020 & 2033
- Table 98: Global Molecular Sieves Market Volume K Tons Forecast, by Shape 2020 & 2033
- Table 99: Global Molecular Sieves Market Revenue Million Forecast, by Size 2020 & 2033
- Table 100: Global Molecular Sieves Market Volume K Tons Forecast, by Size 2020 & 2033
- Table 101: Global Molecular Sieves Market Revenue Million Forecast, by Product Type 2020 & 2033
- Table 102: Global Molecular Sieves Market Volume K Tons Forecast, by Product Type 2020 & 2033
- Table 103: Global Molecular Sieves Market Revenue Million Forecast, by End-user Industry 2020 & 2033
- Table 104: Global Molecular Sieves Market Volume K Tons Forecast, by End-user Industry 2020 & 2033
- Table 105: Global Molecular Sieves Market Revenue Million Forecast, by Country 2020 & 2033
- Table 106: Global Molecular Sieves Market Volume K Tons Forecast, by Country 2020 & 2033
- Table 107: Brazil Molecular Sieves Market Revenue (Million) Forecast, by Application 2020 & 2033
- Table 108: Brazil Molecular Sieves Market Volume (K Tons) Forecast, by Application 2020 & 2033
- Table 109: Argentina Molecular Sieves Market Revenue (Million) Forecast, by Application 2020 & 2033
- Table 110: Argentina Molecular Sieves Market Volume (K Tons) Forecast, by Application 2020 & 2033
- Table 111: Colombia Molecular Sieves Market Revenue (Million) Forecast, by Application 2020 & 2033
- Table 112: Colombia Molecular Sieves Market Volume (K Tons) Forecast, by Application 2020 & 2033
- Table 113: Rest of South America Molecular Sieves Market Revenue (Million) Forecast, by Application 2020 & 2033
- Table 114: Rest of South America Molecular Sieves Market Volume (K Tons) Forecast, by Application 2020 & 2033
- Table 115: Global Molecular Sieves Market Revenue Million Forecast, by Shape 2020 & 2033
- Table 116: Global Molecular Sieves Market Volume K Tons Forecast, by Shape 2020 & 2033
- Table 117: Global Molecular Sieves Market Revenue Million Forecast, by Size 2020 & 2033
- Table 118: Global Molecular Sieves Market Volume K Tons Forecast, by Size 2020 & 2033
- Table 119: Global Molecular Sieves Market Revenue Million Forecast, by Product Type 2020 & 2033
- Table 120: Global Molecular Sieves Market Volume K Tons Forecast, by Product Type 2020 & 2033
- Table 121: Global Molecular Sieves Market Revenue Million Forecast, by End-user Industry 2020 & 2033
- Table 122: Global Molecular Sieves Market Volume K Tons Forecast, by End-user Industry 2020 & 2033
- Table 123: Global Molecular Sieves Market Revenue Million Forecast, by Country 2020 & 2033
- Table 124: Global Molecular Sieves Market Volume K Tons Forecast, by Country 2020 & 2033
- Table 125: Saudi Arabia Molecular Sieves Market Revenue (Million) Forecast, by Application 2020 & 2033
- Table 126: Saudi Arabia Molecular Sieves Market Volume (K Tons) Forecast, by Application 2020 & 2033
- Table 127: South Africa Molecular Sieves Market Revenue (Million) Forecast, by Application 2020 & 2033
- Table 128: South Africa Molecular Sieves Market Volume (K Tons) Forecast, by Application 2020 & 2033
- Table 129: Nigeria Molecular Sieves Market Revenue (Million) Forecast, by Application 2020 & 2033
- Table 130: Nigeria Molecular Sieves Market Volume (K Tons) Forecast, by Application 2020 & 2033
- Table 131: Qatar Molecular Sieves Market Revenue (Million) Forecast, by Application 2020 & 2033
- Table 132: Qatar Molecular Sieves Market Volume (K Tons) Forecast, by Application 2020 & 2033
- Table 133: Egypt Molecular Sieves Market Revenue (Million) Forecast, by Application 2020 & 2033
- Table 134: Egypt Molecular Sieves Market Volume (K Tons) Forecast, by Application 2020 & 2033
- Table 135: UAE Molecular Sieves Market Revenue (Million) Forecast, by Application 2020 & 2033
- Table 136: UAE Molecular Sieves Market Volume (K Tons) Forecast, by Application 2020 & 2033
- Table 137: Rest of Middle East and Africa Molecular Sieves Market Revenue (Million) Forecast, by Application 2020 & 2033
- Table 138: Rest of Middle East and Africa Molecular Sieves Market Volume (K Tons) Forecast, by Application 2020 & 2033
Frequently Asked Questions
1. What is the projected Compound Annual Growth Rate (CAGR) of the Molecular Sieves Market?
The projected CAGR is approximately > 4.50%.
2. Which companies are prominent players in the Molecular Sieves Market?
Key companies in the market include Palmer Holland, Axens, Honeywell International Inc, Clariant, Arkema, Kuraray Co Ltd, Merck KGaA, Zeochem AG, Sorbead India, KNT Group, BASF SE, Tosoh Corporation, Zeolyst International, OMRON Healthcare Inc, Hengye Inc, Resonac Holdings Corporation, CarboTech, W R Grace & Co -Conn, JIUZHOU CHEMICALS, Desicca Chemical Pvt Ltd.
3. What are the main segments of the Molecular Sieves Market?
The market segments include Shape, Size, Product Type, End-user Industry.
4. Can you provide details about the market size?
The market size is estimated to be USD 4.02 Million as of 2022.
5. What are some drivers contributing to market growth?
Rising Awareness About Treatment of Hazardous Organic Materials in Wastewater; Extensive Application as a Catalyst in Petroleum and Petrochemical Products; Other Drivers.
6. What are the notable trends driving market growth?
Petroleum Refining and Petrochemicals Segment to Dominate the Market.
7. Are there any restraints impacting market growth?
Threat from Chemical Composites. Enzymes. and Other Substitutes; Other Restraints.
8. Can you provide examples of recent developments in the market?
Oct 2022: Palmer Holland announced its new distribution agreement with Zeochem. According to the agreement, Palmer Holland will be a channel partner in the United States and Canada for Zeochem’s Purmol line of molecular sieves. Purmol powders are excellent moisture scavengers for polyurethane coatings, adhesives, sealants, and elastomers.
9. What pricing options are available for accessing the report?
Pricing options include single-user, multi-user, and enterprise licenses priced at USD 4750, USD 5250, and USD 8750 respectively.
10. Is the market size provided in terms of value or volume?
The market size is provided in terms of value, measured in Million and volume, measured in K Tons.
11. Are there any specific market keywords associated with the report?
Yes, the market keyword associated with the report is "Molecular Sieves Market," which aids in identifying and referencing the specific market segment covered.
12. How do I determine which pricing option suits my needs best?
The pricing options vary based on user requirements and access needs. Individual users may opt for single-user licenses, while businesses requiring broader access may choose multi-user or enterprise licenses for cost-effective access to the report.
13. Are there any additional resources or data provided in the Molecular Sieves Market report?
While the report offers comprehensive insights, it's advisable to review the specific contents or supplementary materials provided to ascertain if additional resources or data are available.
14. How can I stay updated on further developments or reports in the Molecular Sieves Market?
To stay informed about further developments, trends, and reports in the Molecular Sieves Market, consider subscribing to industry newsletters, following relevant companies and organizations, or regularly checking reputable industry news sources and publications.
Methodology
Step 1 - Identification of Relevant Samples Size from Population Database


Step 2 - Approaches for Defining Global Market Size (Value, Volume* & Price*)

Note*: In applicable scenarios
Step 3 - Data Sources
Primary Research
- Web Analytics
- Survey Reports
- Research Institute
- Latest Research Reports
- Opinion Leaders
Secondary Research
- Annual Reports
- White Paper
- Latest Press Release
- Industry Association
- Paid Database
- Investor Presentations

Step 4 - Data Triangulation
Involves using different sources of information in order to increase the validity of a study
These sources are likely to be stakeholders in a program - participants, other researchers, program staff, other community members, and so on.
Then we put all data in single framework & apply various statistical tools to find out the dynamic on the market.
During the analysis stage, feedback from the stakeholder groups would be compared to determine areas of agreement as well as areas of divergence