

Key Insights
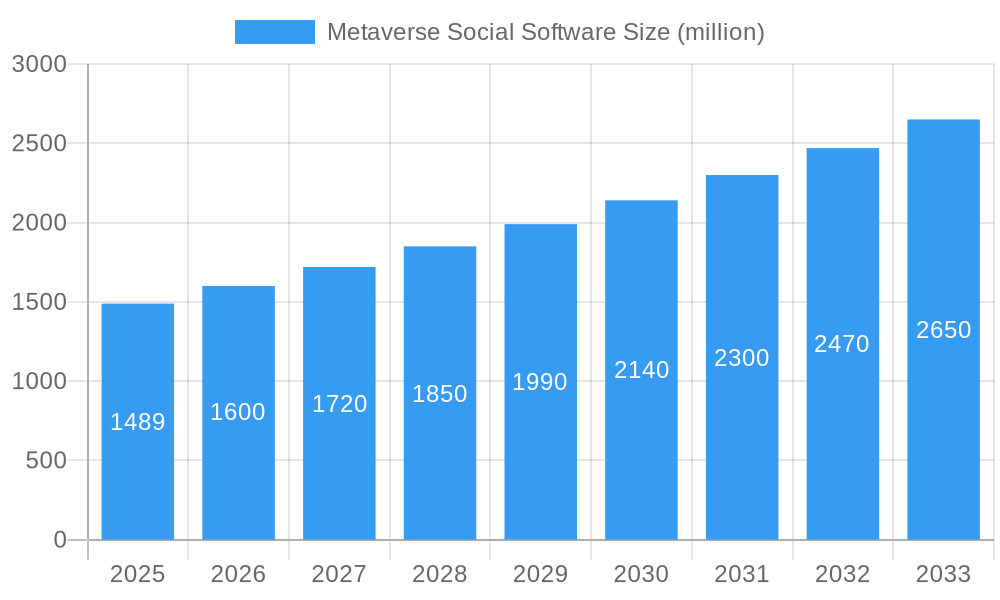
The Metaverse social software market, currently valued at $1489 million in 2025, is projected to experience robust growth, fueled by a compound annual growth rate (CAGR) of 7.4% from 2025 to 2033. This expansion is driven by several key factors. Increasing adoption of virtual and augmented reality technologies is creating immersive social experiences, attracting a broader user base across personal, group, and enterprise applications. The rising popularity of gaming platforms incorporating metaverse elements, like Roblox and Axie Infinity, further contributes to market growth. Furthermore, advancements in social interaction features within metaverse platforms, including enhanced avatars, spatial audio, and interactive virtual environments, are enhancing user engagement and driving wider adoption. The market is segmented by application (personal, group, enterprise) and device type (desktop, mobile), with mobile applications expected to witness significant growth due to increased smartphone penetration and user convenience. Competition is fierce, with major players such as Meta, Decentraland, and The Sandbox vying for market share alongside innovative startups. While technological limitations and concerns around data privacy and security present challenges, the overall market trajectory indicates a positive outlook with significant potential for future expansion.
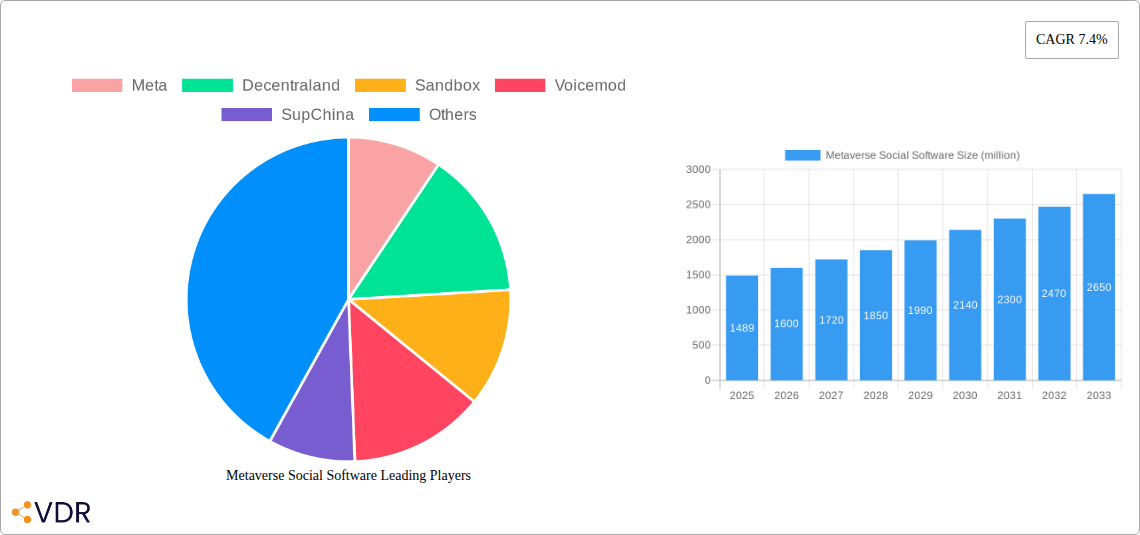
Metaverse Social Software Market Size (In Billion)
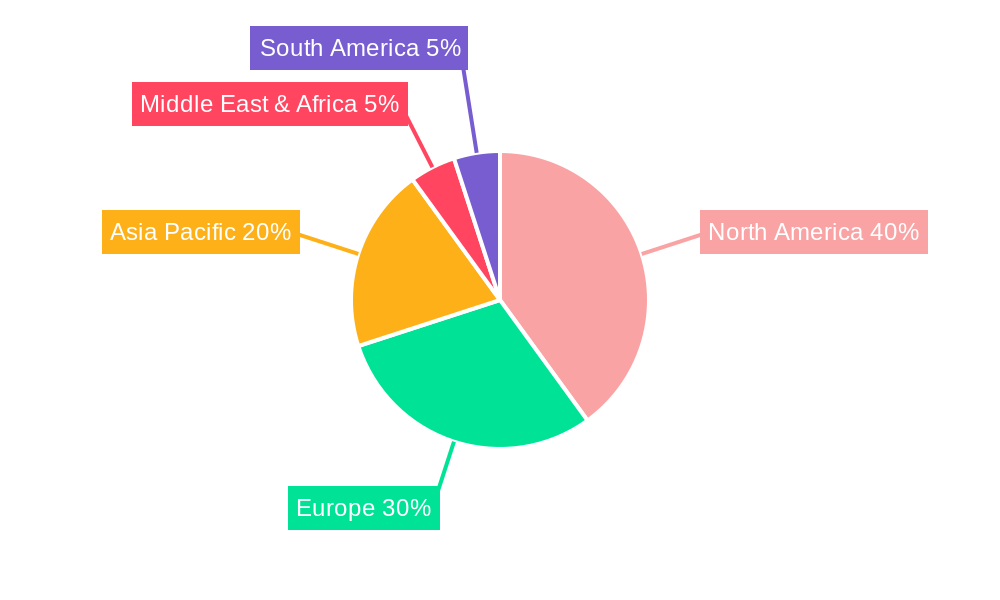
Geographic distribution shows a diversified landscape. North America, with its robust technological infrastructure and early adoption of metaverse technologies, holds a significant market share. However, Asia Pacific is poised for rapid growth, driven by burgeoning internet penetration and a large, tech-savvy population in countries like China and India. Europe also presents a substantial market, with increasing interest and investment in metaverse applications across various sectors. While the market faces challenges such as the need for improved infrastructure and user experience across various regions, these factors are likely to be addressed as the technology matures, fostering further market expansion. The successful integration of blockchain technology and the development of interoperable metaverse platforms could further accelerate market growth in the coming years.
Metaverse Social Software Company Market Share
Metaverse Social Software Market Report: 2019-2033
This comprehensive report provides an in-depth analysis of the Metaverse Social Software market, encompassing market dynamics, growth trends, regional dominance, product landscape, challenges, opportunities, and key players. The study period spans from 2019 to 2033, with 2025 serving as both the base and estimated year. The forecast period covers 2025-2033, and the historical period encompasses 2019-2024. The report covers key segments including Personal, Groups, and Enterprise applications, and Desktop and Mobile platforms. Leading companies like Meta, Decentraland, Sandbox, Roblox, and others are analyzed for their market impact and strategies.
Metaverse Social Software Market Dynamics & Structure
This section analyzes the market's competitive landscape, technological advancements, regulatory influences, and market trends, providing a comprehensive understanding of its structure. The global Metaverse Social Software market size in 2024 is estimated at $xx billion, and it is projected to reach $xx billion by 2033.
- Market Concentration: The market is characterized by a mix of established tech giants (Meta, ByteDance) and emerging players (Decentraland, Sandbox). Meta holds a significant market share, estimated at xx%, followed by Roblox at xx%, and others sharing the remaining xx%.
- Technological Innovation: Key drivers include advancements in VR/AR technologies, AI-powered social features, and blockchain integration for decentralized platforms. However, interoperability challenges and the need for robust security protocols remain key barriers.
- Regulatory Frameworks: Data privacy regulations (GDPR, CCPA) and content moderation policies significantly influence platform development and adoption. Differing regulations across jurisdictions pose challenges to global expansion.
- Competitive Substitutes: Traditional social media platforms (Facebook, Instagram, TikTok) remain primary competitors. However, unique immersive experiences offered by Metaverse platforms are driving their growth.
- End-User Demographics: The market primarily targets younger demographics (18-35 years), but broader adoption is expected as technology matures and usability improves.
- M&A Trends: The number of M&A deals in the sector has increased from xx in 2019 to xx in 2024, demonstrating consolidation and expansion strategies among players. The total deal value reached approximately $xx billion in 2024.
Metaverse Social Software Growth Trends & Insights
This section details the market's evolutionary trajectory, adoption patterns, technological disruptions, and evolving consumer behaviors. The market exhibits a Compound Annual Growth Rate (CAGR) of xx% during the forecast period (2025-2033). Market penetration is expected to reach xx% by 2033, driven by increasing smartphone penetration, affordable VR/AR devices, and enhanced user experience. The shift towards decentralized platforms powered by blockchain technology also fuels the growth. Consumer behavior is increasingly focused on immersive experiences and community building within virtual worlds. This is demonstrated by growing user bases for platforms like Decentraland and The Sandbox. Key technological disruptions include advancements in haptic feedback technology, enhancing the sense of realism. The increasing adoption of Web3 technologies is also driving the growth of the decentralized metaverse space.
Dominant Regions, Countries, or Segments in Metaverse Social Software
North America and Asia are currently the dominant regions, holding approximately xx% and xx% of the market share, respectively. Within these regions, the United States and China are leading countries. The Personal segment (xx% market share) surpasses the Groups and Enterprise segments, primarily driven by the consumer adoption of social games and virtual events. Mobile platforms (xx% market share) are currently more popular than desktop platforms, attributed to high mobile penetration and ease of access.
- Key Drivers (North America): Strong technological infrastructure, high disposable income, and early adoption of new technologies.
- Key Drivers (Asia): Rapid growth of the mobile gaming market, expanding internet penetration, and a large young population.
- Key Drivers (Personal Segment): Desire for enhanced social interaction, access to immersive entertainment, and personalized virtual spaces.
- Key Drivers (Mobile Segment): High smartphone penetration, portability, and convenient access to Metaverse platforms.
Metaverse Social Software Product Landscape
Metaverse social software platforms offer a diverse range of features, including virtual avatars, interactive environments, virtual events, social games, and digital asset creation and trading. Platforms like Roblox prioritize user-generated content, while Decentraland and The Sandbox focus on virtual land ownership and decentralized governance. Key innovations involve advancements in realistic avatars, spatial audio, and haptic feedback technologies, improving the overall user experience. These platforms leverage unique selling propositions like virtual real estate (Decentraland, Sandbox), social gaming (Roblox), and integration with other digital assets (Illuvium, Axie Infinity).
Key Drivers, Barriers & Challenges in Metaverse Social Software
Key Drivers:
Technological advancements (VR/AR, AI, Blockchain), increasing internet penetration, growing demand for immersive experiences, and strategic partnerships between tech giants and game developers.
Key Challenges:
High development costs, interoperability issues between platforms, security concerns regarding digital assets and user data, regulatory uncertainty, and the need for improved user experience and accessibility. Competition from established social media platforms and the potential for market saturation pose significant challenges. Supply chain disruptions for VR/AR hardware can also impact market growth. Regulatory hurdles related to data privacy and content moderation present substantial challenges to global expansion.
Emerging Opportunities in Metaverse Social Software
Untapped markets in developing economies, integration with the Internet of Things (IoT), innovative applications in education and healthcare, and evolving consumer preferences towards personalized virtual experiences present substantial growth opportunities. The increasing integration of NFTs and the metaverse creates new avenues for digital asset creation and trading.
Growth Accelerators in the Metaverse Social Software Industry
Technological breakthroughs in VR/AR, AI, and blockchain technology will accelerate growth. Strategic partnerships between tech companies, game developers, and content creators will unlock new opportunities. Expanding into new markets (e.g., developing countries) and expanding use cases across various sectors (e.g., education, healthcare) will further fuel market expansion.
Notable Milestones in Metaverse Social Software Sector
- 2021 Q4: Meta rebrands to Meta, signaling a significant shift towards the Metaverse.
- 2022 Q1: Roblox surpasses 50 million daily active users.
- 2022 Q3: Decentraland hosts major virtual events attracting thousands of participants.
- 2023 Q2: Sandbox partners with major brands for virtual land sales and marketing initiatives.
- 2024 Q1: Significant investments in Metaverse infrastructure development are announced by various tech companies.
In-Depth Metaverse Social Software Market Outlook
The Metaverse social software market is poised for substantial growth driven by technological advancements, increasing consumer adoption, and expanded applications across various sectors. Strategic partnerships, innovation in immersive technologies, and the development of interoperable platforms will unlock significant opportunities. The market is expected to evolve into a more decentralized and user-centric ecosystem, with an increasing focus on user-generated content and virtual economies. The focus on enhancing user experience and improving accessibility will drive further adoption across diverse demographics.
Metaverse Social Software Segmentation
-
1. Application
- 1.1. Personal
- 1.2. Groups
- 1.3. Enterprise
-
2. Type
- 2.1. Desktop
- 2.2. Mobile
Metaverse Social Software Segmentation By Geography
-
1. North America
- 1.1. United States
- 1.2. Canada
- 1.3. Mexico
-
2. South America
- 2.1. Brazil
- 2.2. Argentina
- 2.3. Rest of South America
-
3. Europe
- 3.1. United Kingdom
- 3.2. Germany
- 3.3. France
- 3.4. Italy
- 3.5. Spain
- 3.6. Russia
- 3.7. Benelux
- 3.8. Nordics
- 3.9. Rest of Europe
-
4. Middle East & Africa
- 4.1. Turkey
- 4.2. Israel
- 4.3. GCC
- 4.4. North Africa
- 4.5. South Africa
- 4.6. Rest of Middle East & Africa
-
5. Asia Pacific
- 5.1. China
- 5.2. India
- 5.3. Japan
- 5.4. South Korea
- 5.5. ASEAN
- 5.6. Oceania
- 5.7. Rest of Asia Pacific
Metaverse Social Software Regional Market Share
Geographic Coverage of Metaverse Social Software
Metaverse Social Software REPORT HIGHLIGHTS
| Aspects | Details |
|---|---|
| Study Period | 2020-2034 |
| Base Year | 2025 |
| Estimated Year | 2026 |
| Forecast Period | 2026-2034 |
| Historical Period | 2020-2025 |
| Growth Rate | CAGR of 42.78% from 2020-2034 |
| Segmentation |
|
Table of Contents
- 1. Introduction
- 1.1. Research Scope
- 1.2. Market Segmentation
- 1.3. Research Objective
- 1.4. Definitions and Assumptions
- 2. Executive Summary
- 2.1. Market Snapshot
- 3. Market Dynamics
- 3.1. Market Drivers
- 3.2. Market Restrains
- 3.3. Market Trends
- 3.4. Market Opportunities
- 4. Market Factor Analysis
- 4.1. Porters Five Forces
- 4.1.1. Bargaining Power of Suppliers
- 4.1.2. Bargaining Power of Buyers
- 4.1.3. Threat of New Entrants
- 4.1.4. Threat of Substitutes
- 4.1.5. Competitive Rivalry
- 4.2. PESTEL analysis
- 4.3. BCG Analysis
- 4.3.1. Stars (High Growth, High Market Share)
- 4.3.2. Cash Cows (Low Growth, High Market Share)
- 4.3.3. Question Mark (High Growth, Low Market Share)
- 4.3.4. Dogs (Low Growth, Low Market Share)
- 4.4. Ansoff Matrix Analysis
- 4.5. Supply Chain Analysis
- 4.6. Regulatory Landscape
- 4.7. Current Market Potential and Opportunity Assessment (TAM–SAM–SOM Framework)
- 4.8. VDR Analyst Note
- 4.1. Porters Five Forces
- 5. Market Analysis, Insights and Forecast 2021-2033
- 5.1. Market Analysis, Insights and Forecast - by Application
- 5.1.1. Personal
- 5.1.2. Groups
- 5.1.3. Enterprise
- 5.2. Market Analysis, Insights and Forecast - by Type
- 5.2.1. Desktop
- 5.2.2. Mobile
- 5.3. Market Analysis, Insights and Forecast - by Region
- 5.3.1. North America
- 5.3.2. South America
- 5.3.3. Europe
- 5.3.4. Middle East & Africa
- 5.3.5. Asia Pacific
- 5.1. Market Analysis, Insights and Forecast - by Application
- 6. Global Metaverse Social Software Analysis, Insights and Forecast, 2021-2033
- 6.1. Market Analysis, Insights and Forecast - by Application
- 6.1.1. Personal
- 6.1.2. Groups
- 6.1.3. Enterprise
- 6.2. Market Analysis, Insights and Forecast - by Type
- 6.2.1. Desktop
- 6.2.2. Mobile
- 6.1. Market Analysis, Insights and Forecast - by Application
- 7. North America Metaverse Social Software Analysis, Insights and Forecast, 2021-2033
- 7.1. Market Analysis, Insights and Forecast - by Application
- 7.1.1. Personal
- 7.1.2. Groups
- 7.1.3. Enterprise
- 7.2. Market Analysis, Insights and Forecast - by Type
- 7.2.1. Desktop
- 7.2.2. Mobile
- 7.1. Market Analysis, Insights and Forecast - by Application
- 8. South America Metaverse Social Software Analysis, Insights and Forecast, 2021-2033
- 8.1. Market Analysis, Insights and Forecast - by Application
- 8.1.1. Personal
- 8.1.2. Groups
- 8.1.3. Enterprise
- 8.2. Market Analysis, Insights and Forecast - by Type
- 8.2.1. Desktop
- 8.2.2. Mobile
- 8.1. Market Analysis, Insights and Forecast - by Application
- 9. Europe Metaverse Social Software Analysis, Insights and Forecast, 2021-2033
- 9.1. Market Analysis, Insights and Forecast - by Application
- 9.1.1. Personal
- 9.1.2. Groups
- 9.1.3. Enterprise
- 9.2. Market Analysis, Insights and Forecast - by Type
- 9.2.1. Desktop
- 9.2.2. Mobile
- 9.1. Market Analysis, Insights and Forecast - by Application
- 10. Middle East & Africa Metaverse Social Software Analysis, Insights and Forecast, 2021-2033
- 10.1. Market Analysis, Insights and Forecast - by Application
- 10.1.1. Personal
- 10.1.2. Groups
- 10.1.3. Enterprise
- 10.2. Market Analysis, Insights and Forecast - by Type
- 10.2.1. Desktop
- 10.2.2. Mobile
- 10.1. Market Analysis, Insights and Forecast - by Application
- 11. Asia Pacific Metaverse Social Software Analysis, Insights and Forecast, 2021-2033
- 11.1. Market Analysis, Insights and Forecast - by Application
- 11.1.1. Personal
- 11.1.2. Groups
- 11.1.3. Enterprise
- 11.2. Market Analysis, Insights and Forecast - by Type
- 11.2.1. Desktop
- 11.2.2. Mobile
- 11.1. Market Analysis, Insights and Forecast - by Application
- 12. Competitive Analysis
- 12.1. Company Profiles
- 12.1.1 Meta
- 12.1.1.1. Company Overview
- 12.1.1.2. Products
- 12.1.1.3. Company Financials
- 12.1.1.4. SWOT Analysis
- 12.1.2 Decentraland
- 12.1.2.1. Company Overview
- 12.1.2.2. Products
- 12.1.2.3. Company Financials
- 12.1.2.4. SWOT Analysis
- 12.1.3 Sandbox
- 12.1.3.1. Company Overview
- 12.1.3.2. Products
- 12.1.3.3. Company Financials
- 12.1.3.4. SWOT Analysis
- 12.1.4 Voicemod
- 12.1.4.1. Company Overview
- 12.1.4.2. Products
- 12.1.4.3. Company Financials
- 12.1.4.4. SWOT Analysis
- 12.1.5 SupChina
- 12.1.5.1. Company Overview
- 12.1.5.2. Products
- 12.1.5.3. Company Financials
- 12.1.5.4. SWOT Analysis
- 12.1.6 Illuvium
- 12.1.6.1. Company Overview
- 12.1.6.2. Products
- 12.1.6.3. Company Financials
- 12.1.6.4. SWOT Analysis
- 12.1.7 Axie Infinity.
- 12.1.7.1. Company Overview
- 12.1.7.2. Products
- 12.1.7.3. Company Financials
- 12.1.7.4. SWOT Analysis
- 12.1.8 Soul
- 12.1.8.1. Company Overview
- 12.1.8.2. Products
- 12.1.8.3. Company Financials
- 12.1.8.4. SWOT Analysis
- 12.1.9 Rroblox
- 12.1.9.1. Company Overview
- 12.1.9.2. Products
- 12.1.9.3. Company Financials
- 12.1.9.4. SWOT Analysis
- 12.1.10 ByteDance
- 12.1.10.1. Company Overview
- 12.1.10.2. Products
- 12.1.10.3. Company Financials
- 12.1.10.4. SWOT Analysis
- 12.1.11 Yalla
- 12.1.11.1. Company Overview
- 12.1.11.2. Products
- 12.1.11.3. Company Financials
- 12.1.11.4. SWOT Analysis
- 12.1.1 Meta
- 12.2. Market Entropy
- 12.2.1 Company's Key Areas Served
- 12.2.2 Recent Developments
- 12.3. Company Market Share Analysis 2025
- 12.3.1 Top 5 Companies Market Share Analysis
- 12.3.2 Top 3 Companies Market Share Analysis
- 12.4. List of Potential Customers
- 13. Research Methodology
List of Figures
- Figure 1: Global Metaverse Social Software Revenue Breakdown (undefined, %) by Region 2025 & 2033
- Figure 2: North America Metaverse Social Software Revenue (undefined), by Application 2025 & 2033
- Figure 3: North America Metaverse Social Software Revenue Share (%), by Application 2025 & 2033
- Figure 4: North America Metaverse Social Software Revenue (undefined), by Type 2025 & 2033
- Figure 5: North America Metaverse Social Software Revenue Share (%), by Type 2025 & 2033
- Figure 6: North America Metaverse Social Software Revenue (undefined), by Country 2025 & 2033
- Figure 7: North America Metaverse Social Software Revenue Share (%), by Country 2025 & 2033
- Figure 8: South America Metaverse Social Software Revenue (undefined), by Application 2025 & 2033
- Figure 9: South America Metaverse Social Software Revenue Share (%), by Application 2025 & 2033
- Figure 10: South America Metaverse Social Software Revenue (undefined), by Type 2025 & 2033
- Figure 11: South America Metaverse Social Software Revenue Share (%), by Type 2025 & 2033
- Figure 12: South America Metaverse Social Software Revenue (undefined), by Country 2025 & 2033
- Figure 13: South America Metaverse Social Software Revenue Share (%), by Country 2025 & 2033
- Figure 14: Europe Metaverse Social Software Revenue (undefined), by Application 2025 & 2033
- Figure 15: Europe Metaverse Social Software Revenue Share (%), by Application 2025 & 2033
- Figure 16: Europe Metaverse Social Software Revenue (undefined), by Type 2025 & 2033
- Figure 17: Europe Metaverse Social Software Revenue Share (%), by Type 2025 & 2033
- Figure 18: Europe Metaverse Social Software Revenue (undefined), by Country 2025 & 2033
- Figure 19: Europe Metaverse Social Software Revenue Share (%), by Country 2025 & 2033
- Figure 20: Middle East & Africa Metaverse Social Software Revenue (undefined), by Application 2025 & 2033
- Figure 21: Middle East & Africa Metaverse Social Software Revenue Share (%), by Application 2025 & 2033
- Figure 22: Middle East & Africa Metaverse Social Software Revenue (undefined), by Type 2025 & 2033
- Figure 23: Middle East & Africa Metaverse Social Software Revenue Share (%), by Type 2025 & 2033
- Figure 24: Middle East & Africa Metaverse Social Software Revenue (undefined), by Country 2025 & 2033
- Figure 25: Middle East & Africa Metaverse Social Software Revenue Share (%), by Country 2025 & 2033
- Figure 26: Asia Pacific Metaverse Social Software Revenue (undefined), by Application 2025 & 2033
- Figure 27: Asia Pacific Metaverse Social Software Revenue Share (%), by Application 2025 & 2033
- Figure 28: Asia Pacific Metaverse Social Software Revenue (undefined), by Type 2025 & 2033
- Figure 29: Asia Pacific Metaverse Social Software Revenue Share (%), by Type 2025 & 2033
- Figure 30: Asia Pacific Metaverse Social Software Revenue (undefined), by Country 2025 & 2033
- Figure 31: Asia Pacific Metaverse Social Software Revenue Share (%), by Country 2025 & 2033
List of Tables
- Table 1: Global Metaverse Social Software Revenue undefined Forecast, by Application 2020 & 2033
- Table 2: Global Metaverse Social Software Revenue undefined Forecast, by Type 2020 & 2033
- Table 3: Global Metaverse Social Software Revenue undefined Forecast, by Region 2020 & 2033
- Table 4: Global Metaverse Social Software Revenue undefined Forecast, by Application 2020 & 2033
- Table 5: Global Metaverse Social Software Revenue undefined Forecast, by Type 2020 & 2033
- Table 6: Global Metaverse Social Software Revenue undefined Forecast, by Country 2020 & 2033
- Table 7: United States Metaverse Social Software Revenue (undefined) Forecast, by Application 2020 & 2033
- Table 8: Canada Metaverse Social Software Revenue (undefined) Forecast, by Application 2020 & 2033
- Table 9: Mexico Metaverse Social Software Revenue (undefined) Forecast, by Application 2020 & 2033
- Table 10: Global Metaverse Social Software Revenue undefined Forecast, by Application 2020 & 2033
- Table 11: Global Metaverse Social Software Revenue undefined Forecast, by Type 2020 & 2033
- Table 12: Global Metaverse Social Software Revenue undefined Forecast, by Country 2020 & 2033
- Table 13: Brazil Metaverse Social Software Revenue (undefined) Forecast, by Application 2020 & 2033
- Table 14: Argentina Metaverse Social Software Revenue (undefined) Forecast, by Application 2020 & 2033
- Table 15: Rest of South America Metaverse Social Software Revenue (undefined) Forecast, by Application 2020 & 2033
- Table 16: Global Metaverse Social Software Revenue undefined Forecast, by Application 2020 & 2033
- Table 17: Global Metaverse Social Software Revenue undefined Forecast, by Type 2020 & 2033
- Table 18: Global Metaverse Social Software Revenue undefined Forecast, by Country 2020 & 2033
- Table 19: United Kingdom Metaverse Social Software Revenue (undefined) Forecast, by Application 2020 & 2033
- Table 20: Germany Metaverse Social Software Revenue (undefined) Forecast, by Application 2020 & 2033
- Table 21: France Metaverse Social Software Revenue (undefined) Forecast, by Application 2020 & 2033
- Table 22: Italy Metaverse Social Software Revenue (undefined) Forecast, by Application 2020 & 2033
- Table 23: Spain Metaverse Social Software Revenue (undefined) Forecast, by Application 2020 & 2033
- Table 24: Russia Metaverse Social Software Revenue (undefined) Forecast, by Application 2020 & 2033
- Table 25: Benelux Metaverse Social Software Revenue (undefined) Forecast, by Application 2020 & 2033
- Table 26: Nordics Metaverse Social Software Revenue (undefined) Forecast, by Application 2020 & 2033
- Table 27: Rest of Europe Metaverse Social Software Revenue (undefined) Forecast, by Application 2020 & 2033
- Table 28: Global Metaverse Social Software Revenue undefined Forecast, by Application 2020 & 2033
- Table 29: Global Metaverse Social Software Revenue undefined Forecast, by Type 2020 & 2033
- Table 30: Global Metaverse Social Software Revenue undefined Forecast, by Country 2020 & 2033
- Table 31: Turkey Metaverse Social Software Revenue (undefined) Forecast, by Application 2020 & 2033
- Table 32: Israel Metaverse Social Software Revenue (undefined) Forecast, by Application 2020 & 2033
- Table 33: GCC Metaverse Social Software Revenue (undefined) Forecast, by Application 2020 & 2033
- Table 34: North Africa Metaverse Social Software Revenue (undefined) Forecast, by Application 2020 & 2033
- Table 35: South Africa Metaverse Social Software Revenue (undefined) Forecast, by Application 2020 & 2033
- Table 36: Rest of Middle East & Africa Metaverse Social Software Revenue (undefined) Forecast, by Application 2020 & 2033
- Table 37: Global Metaverse Social Software Revenue undefined Forecast, by Application 2020 & 2033
- Table 38: Global Metaverse Social Software Revenue undefined Forecast, by Type 2020 & 2033
- Table 39: Global Metaverse Social Software Revenue undefined Forecast, by Country 2020 & 2033
- Table 40: China Metaverse Social Software Revenue (undefined) Forecast, by Application 2020 & 2033
- Table 41: India Metaverse Social Software Revenue (undefined) Forecast, by Application 2020 & 2033
- Table 42: Japan Metaverse Social Software Revenue (undefined) Forecast, by Application 2020 & 2033
- Table 43: South Korea Metaverse Social Software Revenue (undefined) Forecast, by Application 2020 & 2033
- Table 44: ASEAN Metaverse Social Software Revenue (undefined) Forecast, by Application 2020 & 2033
- Table 45: Oceania Metaverse Social Software Revenue (undefined) Forecast, by Application 2020 & 2033
- Table 46: Rest of Asia Pacific Metaverse Social Software Revenue (undefined) Forecast, by Application 2020 & 2033
Frequently Asked Questions
1. What is the projected Compound Annual Growth Rate (CAGR) of the Metaverse Social Software?
The projected CAGR is approximately 42.78%.
2. Which companies are prominent players in the Metaverse Social Software?
Key companies in the market include Meta, Decentraland, Sandbox, Voicemod, SupChina, Illuvium, Axie Infinity., Soul, Rroblox, ByteDance, Yalla.
3. What are the main segments of the Metaverse Social Software?
The market segments include Application, Type.
4. Can you provide details about the market size?
The market size is estimated to be USD XXX N/A as of 2022.
5. What are some drivers contributing to market growth?
N/A
6. What are the notable trends driving market growth?
N/A
7. Are there any restraints impacting market growth?
N/A
8. Can you provide examples of recent developments in the market?
N/A
9. What pricing options are available for accessing the report?
Pricing options include single-user, multi-user, and enterprise licenses priced at USD 2900.00, USD 4350.00, and USD 5800.00 respectively.
10. Is the market size provided in terms of value or volume?
The market size is provided in terms of value, measured in N/A.
11. Are there any specific market keywords associated with the report?
Yes, the market keyword associated with the report is "Metaverse Social Software," which aids in identifying and referencing the specific market segment covered.
12. How do I determine which pricing option suits my needs best?
The pricing options vary based on user requirements and access needs. Individual users may opt for single-user licenses, while businesses requiring broader access may choose multi-user or enterprise licenses for cost-effective access to the report.
13. Are there any additional resources or data provided in the Metaverse Social Software report?
While the report offers comprehensive insights, it's advisable to review the specific contents or supplementary materials provided to ascertain if additional resources or data are available.
14. How can I stay updated on further developments or reports in the Metaverse Social Software?
To stay informed about further developments, trends, and reports in the Metaverse Social Software, consider subscribing to industry newsletters, following relevant companies and organizations, or regularly checking reputable industry news sources and publications.
Methodology
Step 1 - Identification of Relevant Samples Size from Population Database


Step 2 - Approaches for Defining Global Market Size (Value, Volume* & Price*)

Note*: In applicable scenarios
Step 3 - Data Sources
Primary Research
- Web Analytics
- Survey Reports
- Research Institute
- Latest Research Reports
- Opinion Leaders
Secondary Research
- Annual Reports
- White Paper
- Latest Press Release
- Industry Association
- Paid Database
- Investor Presentations

Step 4 - Data Triangulation
Involves using different sources of information in order to increase the validity of a study
These sources are likely to be stakeholders in a program - participants, other researchers, program staff, other community members, and so on.
Then we put all data in single framework & apply various statistical tools to find out the dynamic on the market.
During the analysis stage, feedback from the stakeholder groups would be compared to determine areas of agreement as well as areas of divergence