

Key Insights
The Membrane Water Treatment Chemicals market is poised for significant expansion, driven by escalating global water stress, rigorous environmental mandates, and a growing demand for purified water across diverse industries. The market, valued at approximately $2.4 billion in the base year 2025, is projected to achieve a robust Compound Annual Growth Rate (CAGR) of 6.1% throughout the forecast period (2025-2033). This growth trajectory is underpinned by the increasing adoption of membrane technologies in industrial processes (including power generation, manufacturing, and pharmaceuticals), municipal water purification facilities, and desalination plants. Innovations in membrane technology, enhancing efficiency and reducing operational expenditures, further stimulate market development. Heightened awareness of water contamination and its public health implications is also accelerating investment in sophisticated water treatment solutions. While North America and Europe currently lead market contributions, rapid industrialization and urbanization in the Asia-Pacific and Middle East regions are anticipated to drive substantial future growth. The market landscape is competitive, featuring established and emerging entities pursuing market share through innovation and strategic alliances.
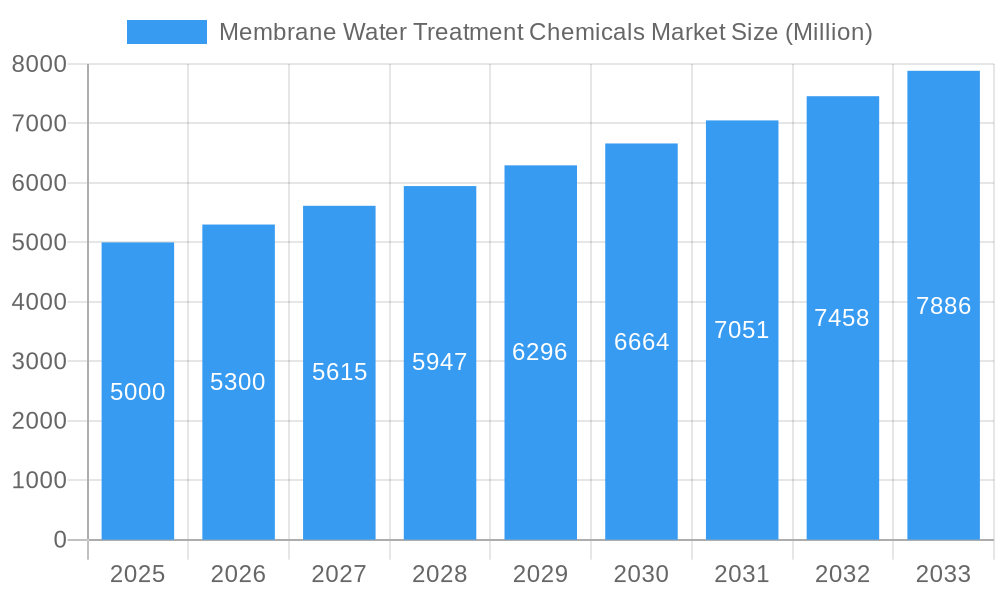
Membrane Water Treatment Chemicals Market Market Size (In Billion)
The forecast period (2025-2033) is expected to observe a pronounced shift toward eco-friendly and sustainable chemical formulations, influenced by regulations promoting the adoption of less toxic and biodegradable alternatives. Technological advancements prioritizing enhanced chemical efficacy, reduced energy consumption, and extended membrane lifespan will continue to shape market dynamics. The industry will likely witness an intensified focus on bespoke chemical solutions designed to address specific water quality challenges and membrane types. The integration of intelligent technologies and data analytics into water treatment operations is projected to foster the development of advanced chemical management systems, contributing to the overall growth of the Membrane Water Treatment Chemicals market. Strategic pricing and resilient supply chains will be critical determinants of success for market participants.
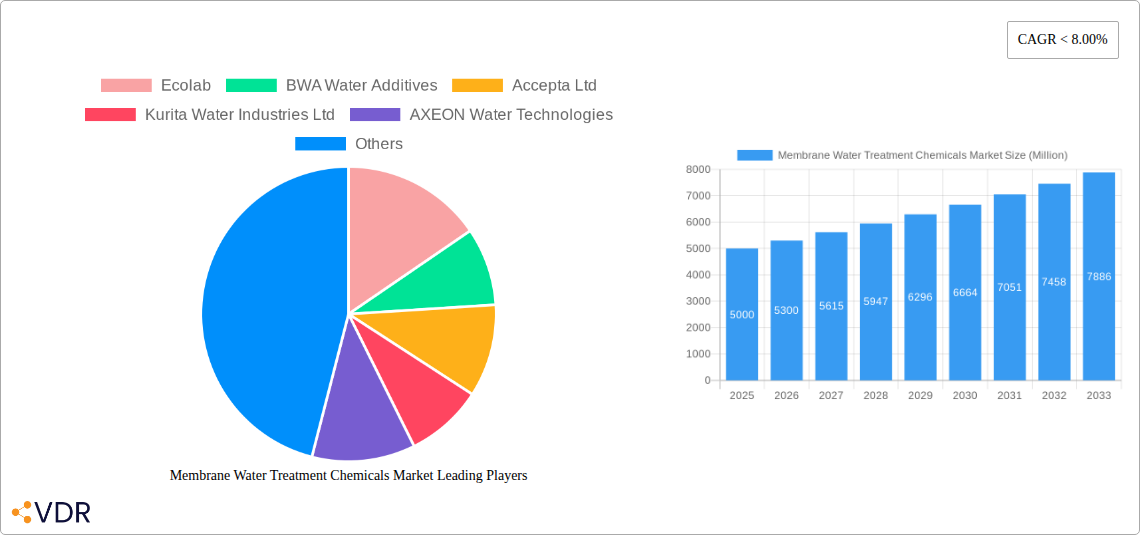
Membrane Water Treatment Chemicals Market Company Market Share
Membrane Water Treatment Chemicals Market: A Comprehensive Report (2019-2033)
This comprehensive report provides an in-depth analysis of the Membrane Water Treatment Chemicals market, encompassing market dynamics, growth trends, regional segmentation, product landscape, key players, and future outlook. The study period spans from 2019 to 2033, with 2025 serving as the base and estimated year. The report caters to industry professionals, investors, and researchers seeking a detailed understanding of this vital sector within the broader water treatment chemicals market. The market is expected to reach xx Million by 2033.
Membrane Water Treatment Chemicals Market Market Dynamics & Structure
The Membrane Water Treatment Chemicals market is characterized by moderate concentration, with key players holding significant market share. The market is driven by technological innovations in membrane filtration technologies, stringent regulatory frameworks emphasizing water quality, and the increasing demand for clean water across diverse end-user industries. Competitive pressures are intensified by the presence of substitute products, such as traditional water treatment methods. Mergers and acquisitions (M&A) activity has been relatively consistent, with a total of xx deals recorded between 2019 and 2024, resulting in a xx% increase in market consolidation.
- Market Concentration: Moderately concentrated, with top 5 players holding approximately xx% market share in 2024.
- Technological Innovation: Focus on developing high-performance, cost-effective chemicals for reverse osmosis (RO), ultrafiltration (UF), and microfiltration (MF) membranes.
- Regulatory Landscape: Stringent environmental regulations driving demand for advanced water treatment solutions.
- Competitive Substitutes: Traditional water treatment methods pose a competitive threat, but membrane filtration's efficiency is a key differentiator.
- End-User Demographics: Growth fueled by increasing industrialization, population growth, and rising demand for clean water in various sectors.
- M&A Activity: xx M&A deals between 2019-2024, indicating consolidation and strategic expansion within the market.
Membrane Water Treatment Chemicals Market Growth Trends & Insights
The Membrane Water Treatment Chemicals market has witnessed robust growth over the historical period (2019-2024), expanding at a CAGR of xx%. This growth is primarily attributed to increasing awareness of water scarcity, rising adoption of membrane filtration technologies across diverse industries, and technological advancements leading to improved chemical efficacy and reduced environmental impact. Consumer behavior shifts towards sustainable practices further augment market expansion. The market size is estimated at xx Million in 2025 and is projected to reach xx Million by 2033, exhibiting a CAGR of xx% during the forecast period (2025-2033). Market penetration in key sectors like municipal water treatment and food & beverage processing continues to rise, driven by stricter regulations and the increasing need for high-quality water. Technological disruptions, such as the development of bio-based chemicals and AI-driven optimization, are expected to further accelerate market growth.
Dominant Regions, Countries, or Segments in Membrane Water Treatment Chemicals Market
North America currently holds the largest market share, driven by stringent environmental regulations and significant investments in water infrastructure. Within chemical types, pre-treatment chemicals dominate, owing to their crucial role in extending membrane lifespan and enhancing treatment efficiency. The Food and Beverage Processing segment exhibits high growth potential due to its stringent hygiene and quality standards.
- Leading Region: North America
- Dominant Chemical Type: Pre-treatment chemicals
- Fastest-Growing End-user Industry: Food and Beverage Processing
- Key Drivers: Stringent environmental regulations (North America), increasing industrialization (Asia-Pacific), and rising demand for clean water in food & beverage processing (globally).
Membrane Water Treatment Chemicals Market Product Landscape
The market offers a diverse range of chemicals tailored to different membrane types and applications. Innovations focus on enhancing chemical efficacy, reducing environmental footprint, and improving cost-effectiveness. Products are differentiated based on their specific functionalities, such as anti-scaling, biofouling control, and cleaning agents. Technological advancements include the development of eco-friendly formulations and AI-driven dosage optimization systems.
Key Drivers, Barriers & Challenges in Membrane Water Treatment Chemicals Market
Key Drivers:
- Increasing water scarcity and stringent environmental regulations are pushing adoption of advanced water treatment technologies.
- Growing industrialization and urbanization are driving demand for clean water across various sectors.
- Technological advancements are leading to more efficient and sustainable chemical formulations.
Key Barriers & Challenges:
- Fluctuations in raw material prices and supply chain disruptions impact production costs.
- Stringent regulatory approvals and compliance requirements pose a hurdle for new product launches.
- Intense competition from established players and the emergence of new entrants creates pricing pressure. This pressure is estimated to reduce profit margins by approximately xx% by 2033.
Emerging Opportunities in Membrane Water Treatment Chemicals Market
- Untapped markets in developing economies present significant growth potential.
- Growing demand for sustainable and eco-friendly chemicals opens opportunities for bio-based alternatives.
- Advancements in AI and IoT offer opportunities for smart water management and optimized chemical usage.
Growth Accelerators in the Membrane Water Treatment Chemicals Market Industry
Strategic partnerships between chemical manufacturers and membrane technology providers are driving innovation and market expansion. Technological breakthroughs in chemical formulations and dosage control systems are improving efficiency and reducing operational costs. Expansion into new geographical markets and diversification into adjacent sectors further fuels growth.
Key Players Shaping the Membrane Water Treatment Chemicals Market Market
- Ecolab
- BWA Water Additives
- Accepta Ltd
- Kurita Water Industries Ltd
- AXEON Water Technologies
- Evoqua Water Technologies LLC
- BASF SE
- SUEZ
- Kemira
- Chemtrade Logistics Inc
- ChemTreat Inc
- Solenis
- Avista Technologies Inc
- Veolia Water Technologies *List Not Exhaustive
Notable Milestones in Membrane Water Treatment Chemicals Market Sector
- 2020: Launch of a new bio-based anti-fouling agent by Ecolab.
- 2022: Acquisition of a smaller chemical manufacturer by SUEZ, expanding its product portfolio.
- 2023: Introduction of an AI-powered dosage optimization system by Kurita Water Industries.
In-Depth Membrane Water Treatment Chemicals Market Market Outlook
The Membrane Water Treatment Chemicals market is poised for continued growth, driven by several factors including increasing demand for clean water, technological advancements, and stringent environmental regulations. Strategic partnerships, product innovation, and expansion into new markets will play a crucial role in shaping the future landscape. The market presents significant opportunities for players who can effectively adapt to evolving technological trends and customer preferences. The predicted market size in 2033 signifies considerable potential for growth and investment in this essential sector.
Membrane Water Treatment Chemicals Market Segmentation
-
1. Chemical Type
- 1.1. Pre-treatment
- 1.2. Biological Controllers
- 1.3. Other Chemical Types
-
2. End-user Industry
- 2.1. Food and Beverage Processing
- 2.2. Healthcare
- 2.3. Municipal
- 2.4. Chemicals (Including Pulp and Paper)
- 2.5. Power
- 2.6. Other End-user Industries
Membrane Water Treatment Chemicals Market Segmentation By Geography
-
1. Asia Pacific
- 1.1. China
- 1.2. India
- 1.3. Japan
- 1.4. South Korea
- 1.5. Rest of Asia Pacific
-
2. North America
- 2.1. United States
- 2.2. Canada
- 2.3. Rest of the North America
-
3. Europe
- 3.1. Germany
- 3.2. France
- 3.3. United Kingdom
- 3.4. Italy
- 3.5. Rest of the Europe
-
4. South America
- 4.1. Brazil
- 4.2. Argentina
- 4.3. Rest of South America
- 5. Middle East
-
6. Saudi Arabia
- 6.1. South Africa
- 6.2. Rest of Middle East
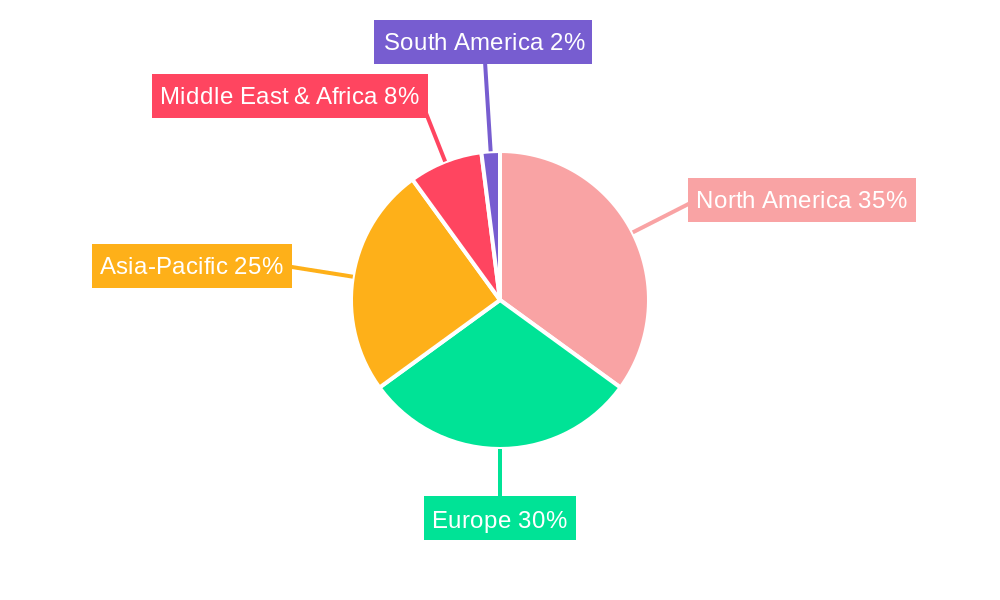
Membrane Water Treatment Chemicals Market Regional Market Share
Geographic Coverage of Membrane Water Treatment Chemicals Market
Membrane Water Treatment Chemicals Market REPORT HIGHLIGHTS
| Aspects | Details |
|---|---|
| Study Period | 2020-2034 |
| Base Year | 2025 |
| Estimated Year | 2026 |
| Forecast Period | 2026-2034 |
| Historical Period | 2020-2025 |
| Growth Rate | CAGR of 6.1% from 2020-2034 |
| Segmentation |
|
Table of Contents
- 1. Introduction
- 1.1. Research Scope
- 1.2. Market Segmentation
- 1.3. Research Objective
- 1.4. Definitions and Assumptions
- 2. Executive Summary
- 2.1. Market Snapshot
- 3. Market Dynamics
- 3.1. Market Drivers
- 3.2. Market Restrains
- 3.3. Market Trends
- 3.4. Market Opportunities
- 4. Market Factor Analysis
- 4.1. Porters Five Forces
- 4.1.1. Bargaining Power of Suppliers
- 4.1.2. Bargaining Power of Buyers
- 4.1.3. Threat of New Entrants
- 4.1.4. Threat of Substitutes
- 4.1.5. Competitive Rivalry
- 4.2. PESTEL analysis
- 4.3. BCG Analysis
- 4.3.1. Stars (High Growth, High Market Share)
- 4.3.2. Cash Cows (Low Growth, High Market Share)
- 4.3.3. Question Mark (High Growth, Low Market Share)
- 4.3.4. Dogs (Low Growth, Low Market Share)
- 4.4. Ansoff Matrix Analysis
- 4.5. Supply Chain Analysis
- 4.6. Regulatory Landscape
- 4.7. Current Market Potential and Opportunity Assessment (TAM–SAM–SOM Framework)
- 4.8. VDR Analyst Note
- 4.1. Porters Five Forces
- 5. Market Analysis, Insights and Forecast 2021-2033
- 5.1. Market Analysis, Insights and Forecast - by Chemical Type
- 5.1.1. Pre-treatment
- 5.1.2. Biological Controllers
- 5.1.3. Other Chemical Types
- 5.2. Market Analysis, Insights and Forecast - by End-user Industry
- 5.2.1. Food and Beverage Processing
- 5.2.2. Healthcare
- 5.2.3. Municipal
- 5.2.4. Chemicals (Including Pulp and Paper)
- 5.2.5. Power
- 5.2.6. Other End-user Industries
- 5.3. Market Analysis, Insights and Forecast - by Region
- 5.3.1. Asia Pacific
- 5.3.2. North America
- 5.3.3. Europe
- 5.3.4. South America
- 5.3.5. Middle East
- 5.3.6. Saudi Arabia
- 5.1. Market Analysis, Insights and Forecast - by Chemical Type
- 6. Global Membrane Water Treatment Chemicals Market Analysis, Insights and Forecast, 2021-2033
- 6.1. Market Analysis, Insights and Forecast - by Chemical Type
- 6.1.1. Pre-treatment
- 6.1.2. Biological Controllers
- 6.1.3. Other Chemical Types
- 6.2. Market Analysis, Insights and Forecast - by End-user Industry
- 6.2.1. Food and Beverage Processing
- 6.2.2. Healthcare
- 6.2.3. Municipal
- 6.2.4. Chemicals (Including Pulp and Paper)
- 6.2.5. Power
- 6.2.6. Other End-user Industries
- 6.1. Market Analysis, Insights and Forecast - by Chemical Type
- 7. Asia Pacific Membrane Water Treatment Chemicals Market Analysis, Insights and Forecast, 2021-2033
- 7.1. Market Analysis, Insights and Forecast - by Chemical Type
- 7.1.1. Pre-treatment
- 7.1.2. Biological Controllers
- 7.1.3. Other Chemical Types
- 7.2. Market Analysis, Insights and Forecast - by End-user Industry
- 7.2.1. Food and Beverage Processing
- 7.2.2. Healthcare
- 7.2.3. Municipal
- 7.2.4. Chemicals (Including Pulp and Paper)
- 7.2.5. Power
- 7.2.6. Other End-user Industries
- 7.1. Market Analysis, Insights and Forecast - by Chemical Type
- 8. North America Membrane Water Treatment Chemicals Market Analysis, Insights and Forecast, 2021-2033
- 8.1. Market Analysis, Insights and Forecast - by Chemical Type
- 8.1.1. Pre-treatment
- 8.1.2. Biological Controllers
- 8.1.3. Other Chemical Types
- 8.2. Market Analysis, Insights and Forecast - by End-user Industry
- 8.2.1. Food and Beverage Processing
- 8.2.2. Healthcare
- 8.2.3. Municipal
- 8.2.4. Chemicals (Including Pulp and Paper)
- 8.2.5. Power
- 8.2.6. Other End-user Industries
- 8.1. Market Analysis, Insights and Forecast - by Chemical Type
- 9. Europe Membrane Water Treatment Chemicals Market Analysis, Insights and Forecast, 2021-2033
- 9.1. Market Analysis, Insights and Forecast - by Chemical Type
- 9.1.1. Pre-treatment
- 9.1.2. Biological Controllers
- 9.1.3. Other Chemical Types
- 9.2. Market Analysis, Insights and Forecast - by End-user Industry
- 9.2.1. Food and Beverage Processing
- 9.2.2. Healthcare
- 9.2.3. Municipal
- 9.2.4. Chemicals (Including Pulp and Paper)
- 9.2.5. Power
- 9.2.6. Other End-user Industries
- 9.1. Market Analysis, Insights and Forecast - by Chemical Type
- 10. South America Membrane Water Treatment Chemicals Market Analysis, Insights and Forecast, 2021-2033
- 10.1. Market Analysis, Insights and Forecast - by Chemical Type
- 10.1.1. Pre-treatment
- 10.1.2. Biological Controllers
- 10.1.3. Other Chemical Types
- 10.2. Market Analysis, Insights and Forecast - by End-user Industry
- 10.2.1. Food and Beverage Processing
- 10.2.2. Healthcare
- 10.2.3. Municipal
- 10.2.4. Chemicals (Including Pulp and Paper)
- 10.2.5. Power
- 10.2.6. Other End-user Industries
- 10.1. Market Analysis, Insights and Forecast - by Chemical Type
- 11. Middle East Membrane Water Treatment Chemicals Market Analysis, Insights and Forecast, 2021-2033
- 11.1. Market Analysis, Insights and Forecast - by Chemical Type
- 11.1.1. Pre-treatment
- 11.1.2. Biological Controllers
- 11.1.3. Other Chemical Types
- 11.2. Market Analysis, Insights and Forecast - by End-user Industry
- 11.2.1. Food and Beverage Processing
- 11.2.2. Healthcare
- 11.2.3. Municipal
- 11.2.4. Chemicals (Including Pulp and Paper)
- 11.2.5. Power
- 11.2.6. Other End-user Industries
- 11.1. Market Analysis, Insights and Forecast - by Chemical Type
- 12. Saudi Arabia Membrane Water Treatment Chemicals Market Analysis, Insights and Forecast, 2021-2033
- 12.1. Market Analysis, Insights and Forecast - by Chemical Type
- 12.1.1. Pre-treatment
- 12.1.2. Biological Controllers
- 12.1.3. Other Chemical Types
- 12.2. Market Analysis, Insights and Forecast - by End-user Industry
- 12.2.1. Food and Beverage Processing
- 12.2.2. Healthcare
- 12.2.3. Municipal
- 12.2.4. Chemicals (Including Pulp and Paper)
- 12.2.5. Power
- 12.2.6. Other End-user Industries
- 12.1. Market Analysis, Insights and Forecast - by Chemical Type
- 13. Competitive Analysis
- 13.1. Company Profiles
- 13.1.1 Ecolab
- 13.1.1.1. Company Overview
- 13.1.1.2. Products
- 13.1.1.3. Company Financials
- 13.1.1.4. SWOT Analysis
- 13.1.2 BWA Water Additives
- 13.1.2.1. Company Overview
- 13.1.2.2. Products
- 13.1.2.3. Company Financials
- 13.1.2.4. SWOT Analysis
- 13.1.3 Accepta Ltd
- 13.1.3.1. Company Overview
- 13.1.3.2. Products
- 13.1.3.3. Company Financials
- 13.1.3.4. SWOT Analysis
- 13.1.4 Kurita Water Industries Ltd
- 13.1.4.1. Company Overview
- 13.1.4.2. Products
- 13.1.4.3. Company Financials
- 13.1.4.4. SWOT Analysis
- 13.1.5 AXEON Water Technologies
- 13.1.5.1. Company Overview
- 13.1.5.2. Products
- 13.1.5.3. Company Financials
- 13.1.5.4. SWOT Analysis
- 13.1.6 Evoqua Water Technologies LLC
- 13.1.6.1. Company Overview
- 13.1.6.2. Products
- 13.1.6.3. Company Financials
- 13.1.6.4. SWOT Analysis
- 13.1.7 BASF SE
- 13.1.7.1. Company Overview
- 13.1.7.2. Products
- 13.1.7.3. Company Financials
- 13.1.7.4. SWOT Analysis
- 13.1.8 SUEZ
- 13.1.8.1. Company Overview
- 13.1.8.2. Products
- 13.1.8.3. Company Financials
- 13.1.8.4. SWOT Analysis
- 13.1.9 Kemira
- 13.1.9.1. Company Overview
- 13.1.9.2. Products
- 13.1.9.3. Company Financials
- 13.1.9.4. SWOT Analysis
- 13.1.10 Chemtrade Logistics Inc
- 13.1.10.1. Company Overview
- 13.1.10.2. Products
- 13.1.10.3. Company Financials
- 13.1.10.4. SWOT Analysis
- 13.1.11 ChemTreat Inc
- 13.1.11.1. Company Overview
- 13.1.11.2. Products
- 13.1.11.3. Company Financials
- 13.1.11.4. SWOT Analysis
- 13.1.12 Solenis
- 13.1.12.1. Company Overview
- 13.1.12.2. Products
- 13.1.12.3. Company Financials
- 13.1.12.4. SWOT Analysis
- 13.1.13 Avista Technologies Inc
- 13.1.13.1. Company Overview
- 13.1.13.2. Products
- 13.1.13.3. Company Financials
- 13.1.13.4. SWOT Analysis
- 13.1.14 Veolia Water Technologies*List Not Exhaustive
- 13.1.14.1. Company Overview
- 13.1.14.2. Products
- 13.1.14.3. Company Financials
- 13.1.14.4. SWOT Analysis
- 13.1.1 Ecolab
- 13.2. Market Entropy
- 13.2.1 Company's Key Areas Served
- 13.2.2 Recent Developments
- 13.3. Company Market Share Analysis 2025
- 13.3.1 Top 5 Companies Market Share Analysis
- 13.3.2 Top 3 Companies Market Share Analysis
- 13.4. List of Potential Customers
- 14. Research Methodology
List of Figures
- Figure 1: Global Membrane Water Treatment Chemicals Market Revenue Breakdown (billion, %) by Region 2025 & 2033
- Figure 2: Asia Pacific Membrane Water Treatment Chemicals Market Revenue (billion), by Chemical Type 2025 & 2033
- Figure 3: Asia Pacific Membrane Water Treatment Chemicals Market Revenue Share (%), by Chemical Type 2025 & 2033
- Figure 4: Asia Pacific Membrane Water Treatment Chemicals Market Revenue (billion), by End-user Industry 2025 & 2033
- Figure 5: Asia Pacific Membrane Water Treatment Chemicals Market Revenue Share (%), by End-user Industry 2025 & 2033
- Figure 6: Asia Pacific Membrane Water Treatment Chemicals Market Revenue (billion), by Country 2025 & 2033
- Figure 7: Asia Pacific Membrane Water Treatment Chemicals Market Revenue Share (%), by Country 2025 & 2033
- Figure 8: North America Membrane Water Treatment Chemicals Market Revenue (billion), by Chemical Type 2025 & 2033
- Figure 9: North America Membrane Water Treatment Chemicals Market Revenue Share (%), by Chemical Type 2025 & 2033
- Figure 10: North America Membrane Water Treatment Chemicals Market Revenue (billion), by End-user Industry 2025 & 2033
- Figure 11: North America Membrane Water Treatment Chemicals Market Revenue Share (%), by End-user Industry 2025 & 2033
- Figure 12: North America Membrane Water Treatment Chemicals Market Revenue (billion), by Country 2025 & 2033
- Figure 13: North America Membrane Water Treatment Chemicals Market Revenue Share (%), by Country 2025 & 2033
- Figure 14: Europe Membrane Water Treatment Chemicals Market Revenue (billion), by Chemical Type 2025 & 2033
- Figure 15: Europe Membrane Water Treatment Chemicals Market Revenue Share (%), by Chemical Type 2025 & 2033
- Figure 16: Europe Membrane Water Treatment Chemicals Market Revenue (billion), by End-user Industry 2025 & 2033
- Figure 17: Europe Membrane Water Treatment Chemicals Market Revenue Share (%), by End-user Industry 2025 & 2033
- Figure 18: Europe Membrane Water Treatment Chemicals Market Revenue (billion), by Country 2025 & 2033
- Figure 19: Europe Membrane Water Treatment Chemicals Market Revenue Share (%), by Country 2025 & 2033
- Figure 20: South America Membrane Water Treatment Chemicals Market Revenue (billion), by Chemical Type 2025 & 2033
- Figure 21: South America Membrane Water Treatment Chemicals Market Revenue Share (%), by Chemical Type 2025 & 2033
- Figure 22: South America Membrane Water Treatment Chemicals Market Revenue (billion), by End-user Industry 2025 & 2033
- Figure 23: South America Membrane Water Treatment Chemicals Market Revenue Share (%), by End-user Industry 2025 & 2033
- Figure 24: South America Membrane Water Treatment Chemicals Market Revenue (billion), by Country 2025 & 2033
- Figure 25: South America Membrane Water Treatment Chemicals Market Revenue Share (%), by Country 2025 & 2033
- Figure 26: Middle East Membrane Water Treatment Chemicals Market Revenue (billion), by Chemical Type 2025 & 2033
- Figure 27: Middle East Membrane Water Treatment Chemicals Market Revenue Share (%), by Chemical Type 2025 & 2033
- Figure 28: Middle East Membrane Water Treatment Chemicals Market Revenue (billion), by End-user Industry 2025 & 2033
- Figure 29: Middle East Membrane Water Treatment Chemicals Market Revenue Share (%), by End-user Industry 2025 & 2033
- Figure 30: Middle East Membrane Water Treatment Chemicals Market Revenue (billion), by Country 2025 & 2033
- Figure 31: Middle East Membrane Water Treatment Chemicals Market Revenue Share (%), by Country 2025 & 2033
- Figure 32: Saudi Arabia Membrane Water Treatment Chemicals Market Revenue (billion), by Chemical Type 2025 & 2033
- Figure 33: Saudi Arabia Membrane Water Treatment Chemicals Market Revenue Share (%), by Chemical Type 2025 & 2033
- Figure 34: Saudi Arabia Membrane Water Treatment Chemicals Market Revenue (billion), by End-user Industry 2025 & 2033
- Figure 35: Saudi Arabia Membrane Water Treatment Chemicals Market Revenue Share (%), by End-user Industry 2025 & 2033
- Figure 36: Saudi Arabia Membrane Water Treatment Chemicals Market Revenue (billion), by Country 2025 & 2033
- Figure 37: Saudi Arabia Membrane Water Treatment Chemicals Market Revenue Share (%), by Country 2025 & 2033
List of Tables
- Table 1: Global Membrane Water Treatment Chemicals Market Revenue billion Forecast, by Chemical Type 2020 & 2033
- Table 2: Global Membrane Water Treatment Chemicals Market Revenue billion Forecast, by End-user Industry 2020 & 2033
- Table 3: Global Membrane Water Treatment Chemicals Market Revenue billion Forecast, by Region 2020 & 2033
- Table 4: Global Membrane Water Treatment Chemicals Market Revenue billion Forecast, by Chemical Type 2020 & 2033
- Table 5: Global Membrane Water Treatment Chemicals Market Revenue billion Forecast, by End-user Industry 2020 & 2033
- Table 6: Global Membrane Water Treatment Chemicals Market Revenue billion Forecast, by Country 2020 & 2033
- Table 7: China Membrane Water Treatment Chemicals Market Revenue (billion) Forecast, by Application 2020 & 2033
- Table 8: India Membrane Water Treatment Chemicals Market Revenue (billion) Forecast, by Application 2020 & 2033
- Table 9: Japan Membrane Water Treatment Chemicals Market Revenue (billion) Forecast, by Application 2020 & 2033
- Table 10: South Korea Membrane Water Treatment Chemicals Market Revenue (billion) Forecast, by Application 2020 & 2033
- Table 11: Rest of Asia Pacific Membrane Water Treatment Chemicals Market Revenue (billion) Forecast, by Application 2020 & 2033
- Table 12: Global Membrane Water Treatment Chemicals Market Revenue billion Forecast, by Chemical Type 2020 & 2033
- Table 13: Global Membrane Water Treatment Chemicals Market Revenue billion Forecast, by End-user Industry 2020 & 2033
- Table 14: Global Membrane Water Treatment Chemicals Market Revenue billion Forecast, by Country 2020 & 2033
- Table 15: United States Membrane Water Treatment Chemicals Market Revenue (billion) Forecast, by Application 2020 & 2033
- Table 16: Canada Membrane Water Treatment Chemicals Market Revenue (billion) Forecast, by Application 2020 & 2033
- Table 17: Rest of the North America Membrane Water Treatment Chemicals Market Revenue (billion) Forecast, by Application 2020 & 2033
- Table 18: Global Membrane Water Treatment Chemicals Market Revenue billion Forecast, by Chemical Type 2020 & 2033
- Table 19: Global Membrane Water Treatment Chemicals Market Revenue billion Forecast, by End-user Industry 2020 & 2033
- Table 20: Global Membrane Water Treatment Chemicals Market Revenue billion Forecast, by Country 2020 & 2033
- Table 21: Germany Membrane Water Treatment Chemicals Market Revenue (billion) Forecast, by Application 2020 & 2033
- Table 22: France Membrane Water Treatment Chemicals Market Revenue (billion) Forecast, by Application 2020 & 2033
- Table 23: United Kingdom Membrane Water Treatment Chemicals Market Revenue (billion) Forecast, by Application 2020 & 2033
- Table 24: Italy Membrane Water Treatment Chemicals Market Revenue (billion) Forecast, by Application 2020 & 2033
- Table 25: Rest of the Europe Membrane Water Treatment Chemicals Market Revenue (billion) Forecast, by Application 2020 & 2033
- Table 26: Global Membrane Water Treatment Chemicals Market Revenue billion Forecast, by Chemical Type 2020 & 2033
- Table 27: Global Membrane Water Treatment Chemicals Market Revenue billion Forecast, by End-user Industry 2020 & 2033
- Table 28: Global Membrane Water Treatment Chemicals Market Revenue billion Forecast, by Country 2020 & 2033
- Table 29: Brazil Membrane Water Treatment Chemicals Market Revenue (billion) Forecast, by Application 2020 & 2033
- Table 30: Argentina Membrane Water Treatment Chemicals Market Revenue (billion) Forecast, by Application 2020 & 2033
- Table 31: Rest of South America Membrane Water Treatment Chemicals Market Revenue (billion) Forecast, by Application 2020 & 2033
- Table 32: Global Membrane Water Treatment Chemicals Market Revenue billion Forecast, by Chemical Type 2020 & 2033
- Table 33: Global Membrane Water Treatment Chemicals Market Revenue billion Forecast, by End-user Industry 2020 & 2033
- Table 34: Global Membrane Water Treatment Chemicals Market Revenue billion Forecast, by Country 2020 & 2033
- Table 35: Global Membrane Water Treatment Chemicals Market Revenue billion Forecast, by Chemical Type 2020 & 2033
- Table 36: Global Membrane Water Treatment Chemicals Market Revenue billion Forecast, by End-user Industry 2020 & 2033
- Table 37: Global Membrane Water Treatment Chemicals Market Revenue billion Forecast, by Country 2020 & 2033
- Table 38: South Africa Membrane Water Treatment Chemicals Market Revenue (billion) Forecast, by Application 2020 & 2033
- Table 39: Rest of Middle East Membrane Water Treatment Chemicals Market Revenue (billion) Forecast, by Application 2020 & 2033
Frequently Asked Questions
1. What is the projected Compound Annual Growth Rate (CAGR) of the Membrane Water Treatment Chemicals Market?
The projected CAGR is approximately 6.1%.
2. Which companies are prominent players in the Membrane Water Treatment Chemicals Market?
Key companies in the market include Ecolab, BWA Water Additives, Accepta Ltd, Kurita Water Industries Ltd, AXEON Water Technologies, Evoqua Water Technologies LLC, BASF SE, SUEZ, Kemira, Chemtrade Logistics Inc, ChemTreat Inc, Solenis, Avista Technologies Inc, Veolia Water Technologies*List Not Exhaustive.
3. What are the main segments of the Membrane Water Treatment Chemicals Market?
The market segments include Chemical Type, End-user Industry.
4. Can you provide details about the market size?
The market size is estimated to be USD 2.4 billion as of 2022.
5. What are some drivers contributing to market growth?
; Emergence of Smart Water Grid and Related Solutions; Stringent Regulations to Control Produced and Wastewater Disposal; Increasing Demand from the Municipal and Manufacturing Sector.
6. What are the notable trends driving market growth?
Pre-treatment chemicals to dominate the Market.
7. Are there any restraints impacting market growth?
; Low Adoption in Developing Countries; Other Restraints.
8. Can you provide examples of recent developments in the market?
N/A
9. What pricing options are available for accessing the report?
Pricing options include single-user, multi-user, and enterprise licenses priced at USD 4750, USD 5250, and USD 8750 respectively.
10. Is the market size provided in terms of value or volume?
The market size is provided in terms of value, measured in billion.
11. Are there any specific market keywords associated with the report?
Yes, the market keyword associated with the report is "Membrane Water Treatment Chemicals Market," which aids in identifying and referencing the specific market segment covered.
12. How do I determine which pricing option suits my needs best?
The pricing options vary based on user requirements and access needs. Individual users may opt for single-user licenses, while businesses requiring broader access may choose multi-user or enterprise licenses for cost-effective access to the report.
13. Are there any additional resources or data provided in the Membrane Water Treatment Chemicals Market report?
While the report offers comprehensive insights, it's advisable to review the specific contents or supplementary materials provided to ascertain if additional resources or data are available.
14. How can I stay updated on further developments or reports in the Membrane Water Treatment Chemicals Market?
To stay informed about further developments, trends, and reports in the Membrane Water Treatment Chemicals Market, consider subscribing to industry newsletters, following relevant companies and organizations, or regularly checking reputable industry news sources and publications.
Methodology
Step 1 - Identification of Relevant Samples Size from Population Database


Step 2 - Approaches for Defining Global Market Size (Value, Volume* & Price*)

Note*: In applicable scenarios
Step 3 - Data Sources
Primary Research
- Web Analytics
- Survey Reports
- Research Institute
- Latest Research Reports
- Opinion Leaders
Secondary Research
- Annual Reports
- White Paper
- Latest Press Release
- Industry Association
- Paid Database
- Investor Presentations

Step 4 - Data Triangulation
Involves using different sources of information in order to increase the validity of a study
These sources are likely to be stakeholders in a program - participants, other researchers, program staff, other community members, and so on.
Then we put all data in single framework & apply various statistical tools to find out the dynamic on the market.
During the analysis stage, feedback from the stakeholder groups would be compared to determine areas of agreement as well as areas of divergence