
Key Insights
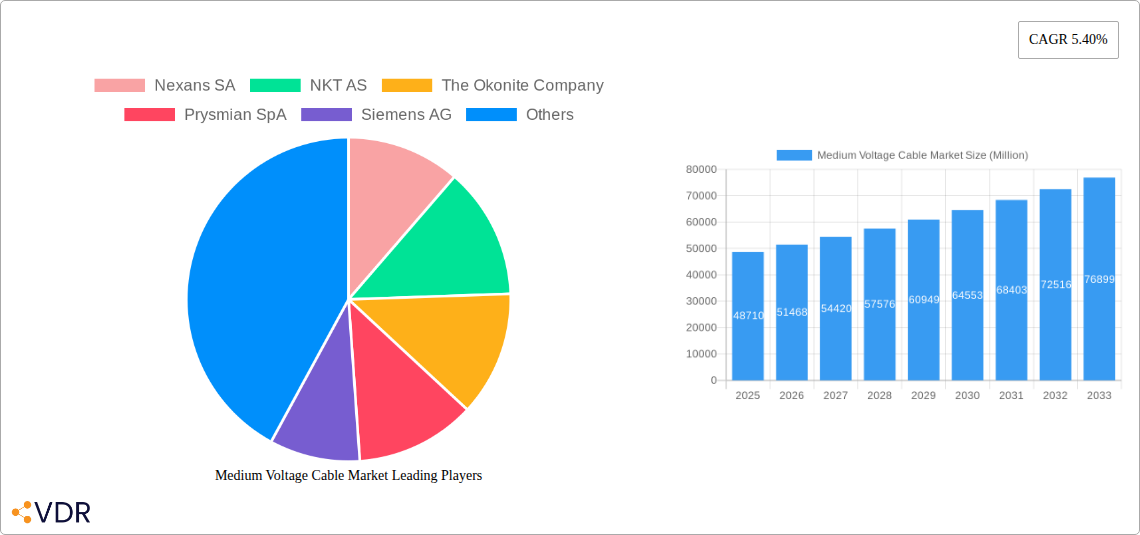
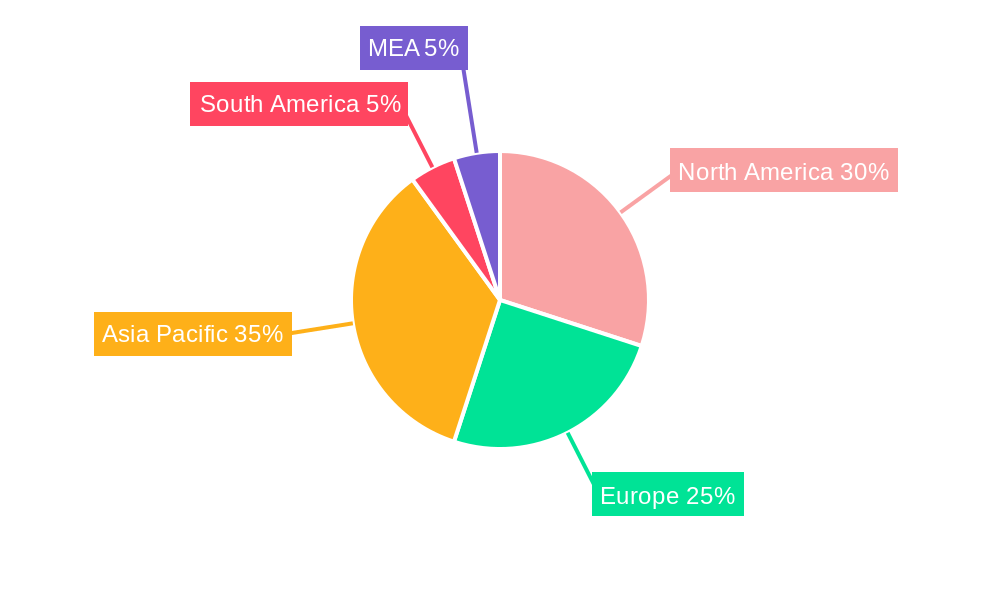
The global medium voltage cable market, valued at $48.71 billion in 2025, is projected to experience robust growth, exhibiting a Compound Annual Growth Rate (CAGR) of 5.40% from 2025 to 2033. This expansion is driven by several key factors. Increasing urbanization and industrialization necessitate extensive power infrastructure development, fueling demand for reliable and efficient medium voltage cables. The global shift towards renewable energy sources, including solar and wind power, further contributes to market growth as these projects require substantial cable installations. Furthermore, advancements in cable technology, such as the adoption of more durable and efficient materials like cross-linked polyethylene (XLPE) and ethylene propylene rubber (EPR), are enhancing performance and lifespan, driving market uptake. The market is segmented by voltage level (less than 35 kV and greater than 35 kV), application (residential, commercial & industrial, utility), insulation type (XLPE, EPR, and others), and location of deployment (overhead and underground). North America and Europe currently hold significant market shares, but the Asia-Pacific region is poised for substantial growth, driven by rapid infrastructure development in countries like China and India.
Competitive pressures are shaping the market landscape. Major players like Nexans SA, Prysmian SpA, and Siemens AG are investing heavily in research and development, striving for innovation in cable design and manufacturing processes. This competition is likely to intensify, leading to product diversification and potentially influencing pricing dynamics. However, challenges remain, including fluctuating raw material prices and potential supply chain disruptions. Moreover, stringent regulatory compliance requirements regarding cable safety and environmental impact pose further complexities for market participants. The long-term outlook for the medium voltage cable market remains positive, with consistent growth expected throughout the forecast period, spurred by ongoing infrastructure investments and technological advancements. The market's segmentation provides opportunities for specialized cable manufacturers to cater to specific application needs and regional demands.
Medium Voltage Cable Market: A Comprehensive Report (2019-2033)
This in-depth report provides a comprehensive analysis of the Medium Voltage Cable market, encompassing market dynamics, growth trends, regional segmentation, product landscape, and key player analysis. It offers invaluable insights for industry professionals, investors, and strategic decision-makers seeking to understand and capitalize on opportunities within this dynamic sector. The report covers the parent market of power cables and the child market of medium voltage cables, offering a granular perspective on market segments such as voltage level, application, insulation type, and location of deployment. The study period spans from 2019 to 2033, with a focus on the forecast period of 2025-2033 and a base year of 2025. Market values are presented in million units.
Medium Voltage Cable Market Dynamics & Structure
The medium voltage cable market is characterized by a moderately consolidated structure, with several major players holding significant market share. Market concentration is expected to remain relatively stable over the forecast period, although strategic acquisitions and mergers could reshape the competitive landscape. Technological innovation, particularly in insulation materials and cable design, is a key driver of market growth. Stringent regulatory frameworks concerning safety and environmental impact influence product development and adoption. Competitive pressures from alternative technologies, such as wireless power transmission, pose a potential threat. End-user demographics, particularly the growth of renewable energy and smart grid initiatives, are significantly impacting market demand.
- Market Concentration: Moderately consolidated, with top 5 players holding approximately xx% of the market share in 2024.
- Technological Innovation: Focus on improving insulation materials (XLPE, EPR), enhancing cable durability, and integrating smart grid technologies.
- Regulatory Frameworks: Compliance with safety standards (e.g., IEC, IEEE) and environmental regulations (e.g., RoHS) drives product development and market access.
- M&A Activity: A moderate number of M&A deals are anticipated in the coming years, primarily driven by expansion strategies and access to new technologies. xx M&A deals were recorded between 2019 and 2024.
- Competitive Substitutes: Wireless power transmission and optical fiber cables present limited but growing competition.
Medium Voltage Cable Market Growth Trends & Insights
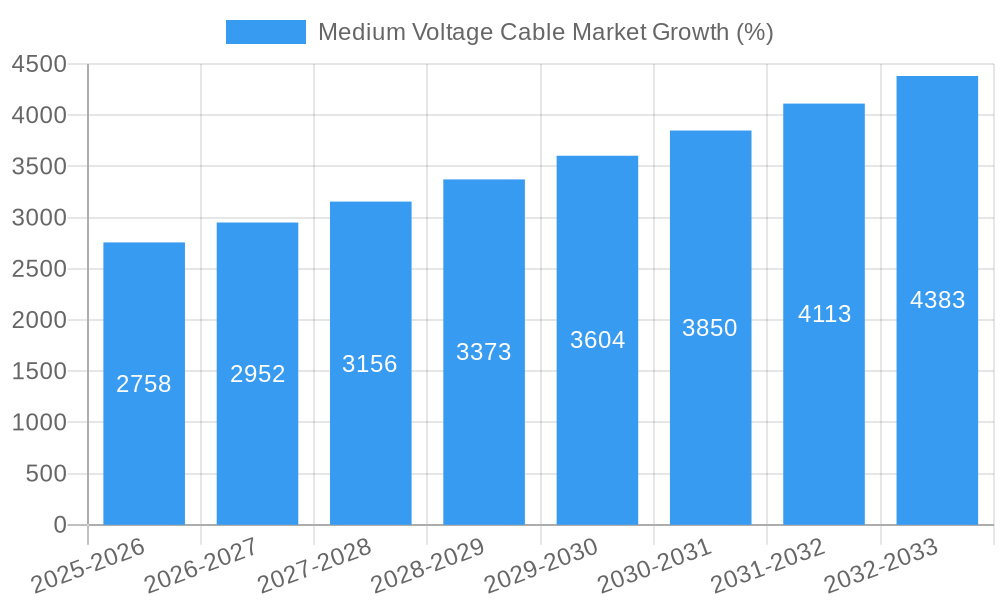
The global medium voltage cable market is poised for robust growth, driven by expanding electricity infrastructure, rising urbanization, and the increasing adoption of renewable energy sources. The market witnessed a CAGR of xx% during the historical period (2019-2024) and is projected to maintain a CAGR of xx% during the forecast period (2025-2033), reaching a market size of xx million units by 2033. This growth is fueled by significant investments in grid modernization and expansion projects globally, particularly in developing economies. The increasing demand for reliable and efficient power transmission is driving the adoption of advanced medium voltage cable technologies. Changes in consumer behavior, reflecting a growing awareness of energy efficiency and sustainability, also contribute positively to market growth.
Dominant Regions, Countries, or Segments in Medium Voltage Cable Market
The Asia-Pacific region is anticipated to dominate the medium voltage cable market, driven by rapid infrastructure development and rising energy demand in countries like China and India. Europe and North America will also experience significant growth, fueled by grid modernization and renewable energy integration projects. Within the segments, the "Greater than 35 kV" voltage level segment exhibits higher growth potential due to increased demand for high-capacity power transmission. The Utility application segment holds the largest market share, driven by extensive power grid expansion projects. Cross-linked Polyethylene (XLPE) insulation remains the dominant material due to its superior performance characteristics. Underground deployment is more prevalent than overhead, reflecting safety and reliability concerns.
- Key Drivers: Rapid urbanization, increasing energy demand, grid modernization, and renewable energy integration.
- Dominant Region: Asia-Pacific, followed by Europe and North America.
- High-Growth Segments: Greater than 35 kV voltage level, Utility application, and XLPE insulation.
- Market Share: Asia-Pacific holds approximately xx% of the global market share in 2024.
Medium Voltage Cable Market Product Landscape
The medium voltage cable market offers a diverse range of products, categorized by voltage rating, insulation material, conductor type, and installation method. Recent innovations focus on enhancing cable performance through the development of advanced insulation materials with improved dielectric strength and thermal stability. Product differentiation is achieved through features such as enhanced flexibility, reduced weight, improved resistance to environmental factors, and integrated sensing capabilities for condition monitoring. These advancements aim to improve grid reliability, reduce operational costs, and enhance safety.
Key Drivers, Barriers & Challenges in Medium Voltage Cable Market
Key Drivers:
- Increasing investment in grid modernization and expansion projects.
- Growing demand for renewable energy and smart grid technologies.
- Stringent government regulations promoting grid reliability and safety.
Challenges:
- Fluctuations in raw material prices, particularly copper and polymers.
- Intense competition and price pressures.
- Supply chain disruptions and logistical challenges.
Emerging Opportunities in Medium Voltage Cable Market
- Growing demand for high-voltage direct current (HVDC) cables for long-distance power transmission.
- Expansion into emerging markets with significant infrastructure development needs.
- Integration of smart grid technologies and sensors for improved grid management.
Growth Accelerators in the Medium Voltage Cable Market Industry
Technological advancements, particularly in insulation materials and cable design, are driving long-term growth. Strategic partnerships between cable manufacturers and utility companies facilitate the adoption of new technologies and accelerate market penetration. Expansion into new geographical markets and diversification into related products are also key growth accelerators.
Key Players Shaping the Medium Voltage Cable Market Market
- Nexans SA
- NKT AS
- The Okonite Company
- Prysmian SpA
- Siemens AG
- Southwire Company LLC
- Riyadh Cables Group
- Eland Cables Ltd
- Cablel Hellenic Cables Group
- General Cables Corporation
Notable Milestones in Medium Voltage Cable Market Sector
- February 2023: Prysmian Group awarded a medium-voltage cable framework agreement with National Grid Electricity Distribution (UK) for a minimum of 3 years.
- May 2023: NKT awarded a turnkey contract by Ellevio (Sweden) to upgrade a section of its power grid in Stockholm.
In-Depth Medium Voltage Cable Market Market Outlook
The medium voltage cable market is projected to experience sustained growth over the forecast period, driven by the ongoing expansion of electricity grids worldwide and the increasing adoption of renewable energy sources. Strategic partnerships, technological advancements, and proactive market expansion strategies by key players will further accelerate market growth. The focus on enhancing grid reliability, safety, and efficiency creates significant opportunities for innovation and market expansion.
Medium Voltage Cable Market Segmentation
-
1. Voltage Level
- 1.1. Less than 35 kV
- 1.2. Greater than 35 kV
-
2. Application
- 2.1. Residential
- 2.2. Commercial and Industrial (C&I)
- 2.3. Utility
-
3. Insulation
- 3.1. Cross-linked Polyethylene (XLPE)
- 3.2. Ethylene Propylene Rubber (EPR)
- 3.3. Other Insulations
-
4. Location of Deployment
- 4.1. Overhead
- 4.2. Underground
Medium Voltage Cable Market Segmentation By Geography
-
1. North America
- 1.1. United States
- 1.2. Canada
- 1.3. Rest of North America
-
2. Europe
- 2.1. United Kingdom
- 2.2. Spain
- 2.3. NORDIC
- 2.4. Russia
- 2.5. Turkey
- 2.6. Germany
- 2.7. Italy
- 2.8. Rest of Europe
-
3. Asia Pacific
- 3.1. China
- 3.2. India
- 3.3. Japan
- 3.4. Malaysia
- 3.5. Thailand
- 3.6. Indonesia
- 3.7. Vietnam
- 3.8. Rest of Asia Pacific
-
4. South America
- 4.1. Brazil
- 4.2. Argentina
- 4.3. Colombia
- 4.4. Rest of South America
-
5. Middle East and Africa
- 5.1. United Arab Emirates
- 5.2. Saudi Arabia
- 5.3. South Africa
- 5.4. Nigeria
- 5.5. Qatar
- 5.6. Egypt
- 5.7. Rest of Middle East and Africa
Medium Voltage Cable Market REPORT HIGHLIGHTS
| Aspects | Details |
|---|---|
| Study Period | 2019-2033 |
| Base Year | 2024 |
| Estimated Year | 2025 |
| Forecast Period | 2025-2033 |
| Historical Period | 2019-2024 |
| Growth Rate | CAGR of 5.40% from 2019-2033 |
| Segmentation |
|
Table of Contents
- 1. Introduction
- 1.1. Research Scope
- 1.2. Market Segmentation
- 1.3. Research Methodology
- 1.4. Definitions and Assumptions
- 2. Executive Summary
- 2.1. Introduction
- 3. Market Dynamics
- 3.1. Introduction
- 3.2. Market Drivers
- 3.2.1. 4.; Increase in Electricity Propelled by Growing Industrialization and Urbanization4.; Aging Power Sector Infrastructure
- 3.3. Market Restrains
- 3.3.1. 4.; Limited Investments to Support Medium-voltage Transmission Network
- 3.4. Market Trends
- 3.4.1. The Underground Segment to Witness Significant Growth
- 4. Market Factor Analysis
- 4.1. Porters Five Forces
- 4.2. Supply/Value Chain
- 4.3. PESTEL analysis
- 4.4. Market Entropy
- 4.5. Patent/Trademark Analysis
- 5. Global Medium Voltage Cable Market Analysis, Insights and Forecast, 2019-2031
- 5.1. Market Analysis, Insights and Forecast - by Voltage Level
- 5.1.1. Less than 35 kV
- 5.1.2. Greater than 35 kV
- 5.2. Market Analysis, Insights and Forecast - by Application
- 5.2.1. Residential
- 5.2.2. Commercial and Industrial (C&I)
- 5.2.3. Utility
- 5.3. Market Analysis, Insights and Forecast - by Insulation
- 5.3.1. Cross-linked Polyethylene (XLPE)
- 5.3.2. Ethylene Propylene Rubber (EPR)
- 5.3.3. Other Insulations
- 5.4. Market Analysis, Insights and Forecast - by Location of Deployment
- 5.4.1. Overhead
- 5.4.2. Underground
- 5.5. Market Analysis, Insights and Forecast - by Region
- 5.5.1. North America
- 5.5.2. Europe
- 5.5.3. Asia Pacific
- 5.5.4. South America
- 5.5.5. Middle East and Africa
- 5.1. Market Analysis, Insights and Forecast - by Voltage Level
- 6. North America Medium Voltage Cable Market Analysis, Insights and Forecast, 2019-2031
- 6.1. Market Analysis, Insights and Forecast - by Voltage Level
- 6.1.1. Less than 35 kV
- 6.1.2. Greater than 35 kV
- 6.2. Market Analysis, Insights and Forecast - by Application
- 6.2.1. Residential
- 6.2.2. Commercial and Industrial (C&I)
- 6.2.3. Utility
- 6.3. Market Analysis, Insights and Forecast - by Insulation
- 6.3.1. Cross-linked Polyethylene (XLPE)
- 6.3.2. Ethylene Propylene Rubber (EPR)
- 6.3.3. Other Insulations
- 6.4. Market Analysis, Insights and Forecast - by Location of Deployment
- 6.4.1. Overhead
- 6.4.2. Underground
- 6.1. Market Analysis, Insights and Forecast - by Voltage Level
- 7. Europe Medium Voltage Cable Market Analysis, Insights and Forecast, 2019-2031
- 7.1. Market Analysis, Insights and Forecast - by Voltage Level
- 7.1.1. Less than 35 kV
- 7.1.2. Greater than 35 kV
- 7.2. Market Analysis, Insights and Forecast - by Application
- 7.2.1. Residential
- 7.2.2. Commercial and Industrial (C&I)
- 7.2.3. Utility
- 7.3. Market Analysis, Insights and Forecast - by Insulation
- 7.3.1. Cross-linked Polyethylene (XLPE)
- 7.3.2. Ethylene Propylene Rubber (EPR)
- 7.3.3. Other Insulations
- 7.4. Market Analysis, Insights and Forecast - by Location of Deployment
- 7.4.1. Overhead
- 7.4.2. Underground
- 7.1. Market Analysis, Insights and Forecast - by Voltage Level
- 8. Asia Pacific Medium Voltage Cable Market Analysis, Insights and Forecast, 2019-2031
- 8.1. Market Analysis, Insights and Forecast - by Voltage Level
- 8.1.1. Less than 35 kV
- 8.1.2. Greater than 35 kV
- 8.2. Market Analysis, Insights and Forecast - by Application
- 8.2.1. Residential
- 8.2.2. Commercial and Industrial (C&I)
- 8.2.3. Utility
- 8.3. Market Analysis, Insights and Forecast - by Insulation
- 8.3.1. Cross-linked Polyethylene (XLPE)
- 8.3.2. Ethylene Propylene Rubber (EPR)
- 8.3.3. Other Insulations
- 8.4. Market Analysis, Insights and Forecast - by Location of Deployment
- 8.4.1. Overhead
- 8.4.2. Underground
- 8.1. Market Analysis, Insights and Forecast - by Voltage Level
- 9. South America Medium Voltage Cable Market Analysis, Insights and Forecast, 2019-2031
- 9.1. Market Analysis, Insights and Forecast - by Voltage Level
- 9.1.1. Less than 35 kV
- 9.1.2. Greater than 35 kV
- 9.2. Market Analysis, Insights and Forecast - by Application
- 9.2.1. Residential
- 9.2.2. Commercial and Industrial (C&I)
- 9.2.3. Utility
- 9.3. Market Analysis, Insights and Forecast - by Insulation
- 9.3.1. Cross-linked Polyethylene (XLPE)
- 9.3.2. Ethylene Propylene Rubber (EPR)
- 9.3.3. Other Insulations
- 9.4. Market Analysis, Insights and Forecast - by Location of Deployment
- 9.4.1. Overhead
- 9.4.2. Underground
- 9.1. Market Analysis, Insights and Forecast - by Voltage Level
- 10. Middle East and Africa Medium Voltage Cable Market Analysis, Insights and Forecast, 2019-2031
- 10.1. Market Analysis, Insights and Forecast - by Voltage Level
- 10.1.1. Less than 35 kV
- 10.1.2. Greater than 35 kV
- 10.2. Market Analysis, Insights and Forecast - by Application
- 10.2.1. Residential
- 10.2.2. Commercial and Industrial (C&I)
- 10.2.3. Utility
- 10.3. Market Analysis, Insights and Forecast - by Insulation
- 10.3.1. Cross-linked Polyethylene (XLPE)
- 10.3.2. Ethylene Propylene Rubber (EPR)
- 10.3.3. Other Insulations
- 10.4. Market Analysis, Insights and Forecast - by Location of Deployment
- 10.4.1. Overhead
- 10.4.2. Underground
- 10.1. Market Analysis, Insights and Forecast - by Voltage Level
- 11. North America Medium Voltage Cable Market Analysis, Insights and Forecast, 2019-2031
- 11.1. Market Analysis, Insights and Forecast - By Country/Sub-region
- 11.1.1 United States
- 11.1.2 Canada
- 11.1.3 Mexico
- 12. Europe Medium Voltage Cable Market Analysis, Insights and Forecast, 2019-2031
- 12.1. Market Analysis, Insights and Forecast - By Country/Sub-region
- 12.1.1 Germany
- 12.1.2 United Kingdom
- 12.1.3 France
- 12.1.4 Spain
- 12.1.5 Italy
- 12.1.6 Spain
- 12.1.7 Belgium
- 12.1.8 Netherland
- 12.1.9 Nordics
- 12.1.10 Rest of Europe
- 13. Asia Pacific Medium Voltage Cable Market Analysis, Insights and Forecast, 2019-2031
- 13.1. Market Analysis, Insights and Forecast - By Country/Sub-region
- 13.1.1 China
- 13.1.2 Japan
- 13.1.3 India
- 13.1.4 South Korea
- 13.1.5 Southeast Asia
- 13.1.6 Australia
- 13.1.7 Indonesia
- 13.1.8 Phillipes
- 13.1.9 Singapore
- 13.1.10 Thailandc
- 13.1.11 Rest of Asia Pacific
- 14. South America Medium Voltage Cable Market Analysis, Insights and Forecast, 2019-2031
- 14.1. Market Analysis, Insights and Forecast - By Country/Sub-region
- 14.1.1 Brazil
- 14.1.2 Argentina
- 14.1.3 Peru
- 14.1.4 Chile
- 14.1.5 Colombia
- 14.1.6 Ecuador
- 14.1.7 Venezuela
- 14.1.8 Rest of South America
- 15. North America Medium Voltage Cable Market Analysis, Insights and Forecast, 2019-2031
- 15.1. Market Analysis, Insights and Forecast - By Country/Sub-region
- 15.1.1 United States
- 15.1.2 Canada
- 15.1.3 Mexico
- 16. MEA Medium Voltage Cable Market Analysis, Insights and Forecast, 2019-2031
- 16.1. Market Analysis, Insights and Forecast - By Country/Sub-region
- 16.1.1 United Arab Emirates
- 16.1.2 Saudi Arabia
- 16.1.3 South Africa
- 16.1.4 Rest of Middle East and Africa
- 17. Competitive Analysis
- 17.1. Global Market Share Analysis 2024
- 17.2. Company Profiles
- 17.2.1 Nexans SA
- 17.2.1.1. Overview
- 17.2.1.2. Products
- 17.2.1.3. SWOT Analysis
- 17.2.1.4. Recent Developments
- 17.2.1.5. Financials (Based on Availability)
- 17.2.2 NKT AS
- 17.2.2.1. Overview
- 17.2.2.2. Products
- 17.2.2.3. SWOT Analysis
- 17.2.2.4. Recent Developments
- 17.2.2.5. Financials (Based on Availability)
- 17.2.3 The Okonite Company
- 17.2.3.1. Overview
- 17.2.3.2. Products
- 17.2.3.3. SWOT Analysis
- 17.2.3.4. Recent Developments
- 17.2.3.5. Financials (Based on Availability)
- 17.2.4 Prysmian SpA
- 17.2.4.1. Overview
- 17.2.4.2. Products
- 17.2.4.3. SWOT Analysis
- 17.2.4.4. Recent Developments
- 17.2.4.5. Financials (Based on Availability)
- 17.2.5 Siemens AG
- 17.2.5.1. Overview
- 17.2.5.2. Products
- 17.2.5.3. SWOT Analysis
- 17.2.5.4. Recent Developments
- 17.2.5.5. Financials (Based on Availability)
- 17.2.6 Southwire Company LLC
- 17.2.6.1. Overview
- 17.2.6.2. Products
- 17.2.6.3. SWOT Analysis
- 17.2.6.4. Recent Developments
- 17.2.6.5. Financials (Based on Availability)
- 17.2.7 Riyadh Cables Group
- 17.2.7.1. Overview
- 17.2.7.2. Products
- 17.2.7.3. SWOT Analysis
- 17.2.7.4. Recent Developments
- 17.2.7.5. Financials (Based on Availability)
- 17.2.8 Eland Cables Ltd
- 17.2.8.1. Overview
- 17.2.8.2. Products
- 17.2.8.3. SWOT Analysis
- 17.2.8.4. Recent Developments
- 17.2.8.5. Financials (Based on Availability)
- 17.2.9 Cablel Hellenic Cables Group
- 17.2.9.1. Overview
- 17.2.9.2. Products
- 17.2.9.3. SWOT Analysis
- 17.2.9.4. Recent Developments
- 17.2.9.5. Financials (Based on Availability)
- 17.2.10 General Cables Corporation*List Not Exhaustive 6 4 Market Ranking Analysi
- 17.2.10.1. Overview
- 17.2.10.2. Products
- 17.2.10.3. SWOT Analysis
- 17.2.10.4. Recent Developments
- 17.2.10.5. Financials (Based on Availability)
- 17.2.1 Nexans SA
List of Figures
- Figure 1: Global Medium Voltage Cable Market Revenue Breakdown (Million, %) by Region 2024 & 2032
- Figure 2: Global Medium Voltage Cable Market Volume Breakdown (Meter, %) by Region 2024 & 2032
- Figure 3: North America Medium Voltage Cable Market Revenue (Million), by Country 2024 & 2032
- Figure 4: North America Medium Voltage Cable Market Volume (Meter), by Country 2024 & 2032
- Figure 5: North America Medium Voltage Cable Market Revenue Share (%), by Country 2024 & 2032
- Figure 6: North America Medium Voltage Cable Market Volume Share (%), by Country 2024 & 2032
- Figure 7: Europe Medium Voltage Cable Market Revenue (Million), by Country 2024 & 2032
- Figure 8: Europe Medium Voltage Cable Market Volume (Meter), by Country 2024 & 2032
- Figure 9: Europe Medium Voltage Cable Market Revenue Share (%), by Country 2024 & 2032
- Figure 10: Europe Medium Voltage Cable Market Volume Share (%), by Country 2024 & 2032
- Figure 11: Asia Pacific Medium Voltage Cable Market Revenue (Million), by Country 2024 & 2032
- Figure 12: Asia Pacific Medium Voltage Cable Market Volume (Meter), by Country 2024 & 2032
- Figure 13: Asia Pacific Medium Voltage Cable Market Revenue Share (%), by Country 2024 & 2032
- Figure 14: Asia Pacific Medium Voltage Cable Market Volume Share (%), by Country 2024 & 2032
- Figure 15: South America Medium Voltage Cable Market Revenue (Million), by Country 2024 & 2032
- Figure 16: South America Medium Voltage Cable Market Volume (Meter), by Country 2024 & 2032
- Figure 17: South America Medium Voltage Cable Market Revenue Share (%), by Country 2024 & 2032
- Figure 18: South America Medium Voltage Cable Market Volume Share (%), by Country 2024 & 2032
- Figure 19: North America Medium Voltage Cable Market Revenue (Million), by Country 2024 & 2032
- Figure 20: North America Medium Voltage Cable Market Volume (Meter), by Country 2024 & 2032
- Figure 21: North America Medium Voltage Cable Market Revenue Share (%), by Country 2024 & 2032
- Figure 22: North America Medium Voltage Cable Market Volume Share (%), by Country 2024 & 2032
- Figure 23: MEA Medium Voltage Cable Market Revenue (Million), by Country 2024 & 2032
- Figure 24: MEA Medium Voltage Cable Market Volume (Meter), by Country 2024 & 2032
- Figure 25: MEA Medium Voltage Cable Market Revenue Share (%), by Country 2024 & 2032
- Figure 26: MEA Medium Voltage Cable Market Volume Share (%), by Country 2024 & 2032
- Figure 27: North America Medium Voltage Cable Market Revenue (Million), by Voltage Level 2024 & 2032
- Figure 28: North America Medium Voltage Cable Market Volume (Meter), by Voltage Level 2024 & 2032
- Figure 29: North America Medium Voltage Cable Market Revenue Share (%), by Voltage Level 2024 & 2032
- Figure 30: North America Medium Voltage Cable Market Volume Share (%), by Voltage Level 2024 & 2032
- Figure 31: North America Medium Voltage Cable Market Revenue (Million), by Application 2024 & 2032
- Figure 32: North America Medium Voltage Cable Market Volume (Meter), by Application 2024 & 2032
- Figure 33: North America Medium Voltage Cable Market Revenue Share (%), by Application 2024 & 2032
- Figure 34: North America Medium Voltage Cable Market Volume Share (%), by Application 2024 & 2032
- Figure 35: North America Medium Voltage Cable Market Revenue (Million), by Insulation 2024 & 2032
- Figure 36: North America Medium Voltage Cable Market Volume (Meter), by Insulation 2024 & 2032
- Figure 37: North America Medium Voltage Cable Market Revenue Share (%), by Insulation 2024 & 2032
- Figure 38: North America Medium Voltage Cable Market Volume Share (%), by Insulation 2024 & 2032
- Figure 39: North America Medium Voltage Cable Market Revenue (Million), by Location of Deployment 2024 & 2032
- Figure 40: North America Medium Voltage Cable Market Volume (Meter), by Location of Deployment 2024 & 2032
- Figure 41: North America Medium Voltage Cable Market Revenue Share (%), by Location of Deployment 2024 & 2032
- Figure 42: North America Medium Voltage Cable Market Volume Share (%), by Location of Deployment 2024 & 2032
- Figure 43: North America Medium Voltage Cable Market Revenue (Million), by Country 2024 & 2032
- Figure 44: North America Medium Voltage Cable Market Volume (Meter), by Country 2024 & 2032
- Figure 45: North America Medium Voltage Cable Market Revenue Share (%), by Country 2024 & 2032
- Figure 46: North America Medium Voltage Cable Market Volume Share (%), by Country 2024 & 2032
- Figure 47: Europe Medium Voltage Cable Market Revenue (Million), by Voltage Level 2024 & 2032
- Figure 48: Europe Medium Voltage Cable Market Volume (Meter), by Voltage Level 2024 & 2032
- Figure 49: Europe Medium Voltage Cable Market Revenue Share (%), by Voltage Level 2024 & 2032
- Figure 50: Europe Medium Voltage Cable Market Volume Share (%), by Voltage Level 2024 & 2032
- Figure 51: Europe Medium Voltage Cable Market Revenue (Million), by Application 2024 & 2032
- Figure 52: Europe Medium Voltage Cable Market Volume (Meter), by Application 2024 & 2032
- Figure 53: Europe Medium Voltage Cable Market Revenue Share (%), by Application 2024 & 2032
- Figure 54: Europe Medium Voltage Cable Market Volume Share (%), by Application 2024 & 2032
- Figure 55: Europe Medium Voltage Cable Market Revenue (Million), by Insulation 2024 & 2032
- Figure 56: Europe Medium Voltage Cable Market Volume (Meter), by Insulation 2024 & 2032
- Figure 57: Europe Medium Voltage Cable Market Revenue Share (%), by Insulation 2024 & 2032
- Figure 58: Europe Medium Voltage Cable Market Volume Share (%), by Insulation 2024 & 2032
- Figure 59: Europe Medium Voltage Cable Market Revenue (Million), by Location of Deployment 2024 & 2032
- Figure 60: Europe Medium Voltage Cable Market Volume (Meter), by Location of Deployment 2024 & 2032
- Figure 61: Europe Medium Voltage Cable Market Revenue Share (%), by Location of Deployment 2024 & 2032
- Figure 62: Europe Medium Voltage Cable Market Volume Share (%), by Location of Deployment 2024 & 2032
- Figure 63: Europe Medium Voltage Cable Market Revenue (Million), by Country 2024 & 2032
- Figure 64: Europe Medium Voltage Cable Market Volume (Meter), by Country 2024 & 2032
- Figure 65: Europe Medium Voltage Cable Market Revenue Share (%), by Country 2024 & 2032
- Figure 66: Europe Medium Voltage Cable Market Volume Share (%), by Country 2024 & 2032
- Figure 67: Asia Pacific Medium Voltage Cable Market Revenue (Million), by Voltage Level 2024 & 2032
- Figure 68: Asia Pacific Medium Voltage Cable Market Volume (Meter), by Voltage Level 2024 & 2032
- Figure 69: Asia Pacific Medium Voltage Cable Market Revenue Share (%), by Voltage Level 2024 & 2032
- Figure 70: Asia Pacific Medium Voltage Cable Market Volume Share (%), by Voltage Level 2024 & 2032
- Figure 71: Asia Pacific Medium Voltage Cable Market Revenue (Million), by Application 2024 & 2032
- Figure 72: Asia Pacific Medium Voltage Cable Market Volume (Meter), by Application 2024 & 2032
- Figure 73: Asia Pacific Medium Voltage Cable Market Revenue Share (%), by Application 2024 & 2032
- Figure 74: Asia Pacific Medium Voltage Cable Market Volume Share (%), by Application 2024 & 2032
- Figure 75: Asia Pacific Medium Voltage Cable Market Revenue (Million), by Insulation 2024 & 2032
- Figure 76: Asia Pacific Medium Voltage Cable Market Volume (Meter), by Insulation 2024 & 2032
- Figure 77: Asia Pacific Medium Voltage Cable Market Revenue Share (%), by Insulation 2024 & 2032
- Figure 78: Asia Pacific Medium Voltage Cable Market Volume Share (%), by Insulation 2024 & 2032
- Figure 79: Asia Pacific Medium Voltage Cable Market Revenue (Million), by Location of Deployment 2024 & 2032
- Figure 80: Asia Pacific Medium Voltage Cable Market Volume (Meter), by Location of Deployment 2024 & 2032
- Figure 81: Asia Pacific Medium Voltage Cable Market Revenue Share (%), by Location of Deployment 2024 & 2032
- Figure 82: Asia Pacific Medium Voltage Cable Market Volume Share (%), by Location of Deployment 2024 & 2032
- Figure 83: Asia Pacific Medium Voltage Cable Market Revenue (Million), by Country 2024 & 2032
- Figure 84: Asia Pacific Medium Voltage Cable Market Volume (Meter), by Country 2024 & 2032
- Figure 85: Asia Pacific Medium Voltage Cable Market Revenue Share (%), by Country 2024 & 2032
- Figure 86: Asia Pacific Medium Voltage Cable Market Volume Share (%), by Country 2024 & 2032
- Figure 87: South America Medium Voltage Cable Market Revenue (Million), by Voltage Level 2024 & 2032
- Figure 88: South America Medium Voltage Cable Market Volume (Meter), by Voltage Level 2024 & 2032
- Figure 89: South America Medium Voltage Cable Market Revenue Share (%), by Voltage Level 2024 & 2032
- Figure 90: South America Medium Voltage Cable Market Volume Share (%), by Voltage Level 2024 & 2032
- Figure 91: South America Medium Voltage Cable Market Revenue (Million), by Application 2024 & 2032
- Figure 92: South America Medium Voltage Cable Market Volume (Meter), by Application 2024 & 2032
- Figure 93: South America Medium Voltage Cable Market Revenue Share (%), by Application 2024 & 2032
- Figure 94: South America Medium Voltage Cable Market Volume Share (%), by Application 2024 & 2032
- Figure 95: South America Medium Voltage Cable Market Revenue (Million), by Insulation 2024 & 2032
- Figure 96: South America Medium Voltage Cable Market Volume (Meter), by Insulation 2024 & 2032
- Figure 97: South America Medium Voltage Cable Market Revenue Share (%), by Insulation 2024 & 2032
- Figure 98: South America Medium Voltage Cable Market Volume Share (%), by Insulation 2024 & 2032
- Figure 99: South America Medium Voltage Cable Market Revenue (Million), by Location of Deployment 2024 & 2032
- Figure 100: South America Medium Voltage Cable Market Volume (Meter), by Location of Deployment 2024 & 2032
- Figure 101: South America Medium Voltage Cable Market Revenue Share (%), by Location of Deployment 2024 & 2032
- Figure 102: South America Medium Voltage Cable Market Volume Share (%), by Location of Deployment 2024 & 2032
- Figure 103: South America Medium Voltage Cable Market Revenue (Million), by Country 2024 & 2032
- Figure 104: South America Medium Voltage Cable Market Volume (Meter), by Country 2024 & 2032
- Figure 105: South America Medium Voltage Cable Market Revenue Share (%), by Country 2024 & 2032
- Figure 106: South America Medium Voltage Cable Market Volume Share (%), by Country 2024 & 2032
- Figure 107: Middle East and Africa Medium Voltage Cable Market Revenue (Million), by Voltage Level 2024 & 2032
- Figure 108: Middle East and Africa Medium Voltage Cable Market Volume (Meter), by Voltage Level 2024 & 2032
- Figure 109: Middle East and Africa Medium Voltage Cable Market Revenue Share (%), by Voltage Level 2024 & 2032
- Figure 110: Middle East and Africa Medium Voltage Cable Market Volume Share (%), by Voltage Level 2024 & 2032
- Figure 111: Middle East and Africa Medium Voltage Cable Market Revenue (Million), by Application 2024 & 2032
- Figure 112: Middle East and Africa Medium Voltage Cable Market Volume (Meter), by Application 2024 & 2032
- Figure 113: Middle East and Africa Medium Voltage Cable Market Revenue Share (%), by Application 2024 & 2032
- Figure 114: Middle East and Africa Medium Voltage Cable Market Volume Share (%), by Application 2024 & 2032
- Figure 115: Middle East and Africa Medium Voltage Cable Market Revenue (Million), by Insulation 2024 & 2032
- Figure 116: Middle East and Africa Medium Voltage Cable Market Volume (Meter), by Insulation 2024 & 2032
- Figure 117: Middle East and Africa Medium Voltage Cable Market Revenue Share (%), by Insulation 2024 & 2032
- Figure 118: Middle East and Africa Medium Voltage Cable Market Volume Share (%), by Insulation 2024 & 2032
- Figure 119: Middle East and Africa Medium Voltage Cable Market Revenue (Million), by Location of Deployment 2024 & 2032
- Figure 120: Middle East and Africa Medium Voltage Cable Market Volume (Meter), by Location of Deployment 2024 & 2032
- Figure 121: Middle East and Africa Medium Voltage Cable Market Revenue Share (%), by Location of Deployment 2024 & 2032
- Figure 122: Middle East and Africa Medium Voltage Cable Market Volume Share (%), by Location of Deployment 2024 & 2032
- Figure 123: Middle East and Africa Medium Voltage Cable Market Revenue (Million), by Country 2024 & 2032
- Figure 124: Middle East and Africa Medium Voltage Cable Market Volume (Meter), by Country 2024 & 2032
- Figure 125: Middle East and Africa Medium Voltage Cable Market Revenue Share (%), by Country 2024 & 2032
- Figure 126: Middle East and Africa Medium Voltage Cable Market Volume Share (%), by Country 2024 & 2032
List of Tables
- Table 1: Global Medium Voltage Cable Market Revenue Million Forecast, by Region 2019 & 2032
- Table 2: Global Medium Voltage Cable Market Volume Meter Forecast, by Region 2019 & 2032
- Table 3: Global Medium Voltage Cable Market Revenue Million Forecast, by Voltage Level 2019 & 2032
- Table 4: Global Medium Voltage Cable Market Volume Meter Forecast, by Voltage Level 2019 & 2032
- Table 5: Global Medium Voltage Cable Market Revenue Million Forecast, by Application 2019 & 2032
- Table 6: Global Medium Voltage Cable Market Volume Meter Forecast, by Application 2019 & 2032
- Table 7: Global Medium Voltage Cable Market Revenue Million Forecast, by Insulation 2019 & 2032
- Table 8: Global Medium Voltage Cable Market Volume Meter Forecast, by Insulation 2019 & 2032
- Table 9: Global Medium Voltage Cable Market Revenue Million Forecast, by Location of Deployment 2019 & 2032
- Table 10: Global Medium Voltage Cable Market Volume Meter Forecast, by Location of Deployment 2019 & 2032
- Table 11: Global Medium Voltage Cable Market Revenue Million Forecast, by Region 2019 & 2032
- Table 12: Global Medium Voltage Cable Market Volume Meter Forecast, by Region 2019 & 2032
- Table 13: Global Medium Voltage Cable Market Revenue Million Forecast, by Country 2019 & 2032
- Table 14: Global Medium Voltage Cable Market Volume Meter Forecast, by Country 2019 & 2032
- Table 15: United States Medium Voltage Cable Market Revenue (Million) Forecast, by Application 2019 & 2032
- Table 16: United States Medium Voltage Cable Market Volume (Meter) Forecast, by Application 2019 & 2032
- Table 17: Canada Medium Voltage Cable Market Revenue (Million) Forecast, by Application 2019 & 2032
- Table 18: Canada Medium Voltage Cable Market Volume (Meter) Forecast, by Application 2019 & 2032
- Table 19: Mexico Medium Voltage Cable Market Revenue (Million) Forecast, by Application 2019 & 2032
- Table 20: Mexico Medium Voltage Cable Market Volume (Meter) Forecast, by Application 2019 & 2032
- Table 21: Global Medium Voltage Cable Market Revenue Million Forecast, by Country 2019 & 2032
- Table 22: Global Medium Voltage Cable Market Volume Meter Forecast, by Country 2019 & 2032
- Table 23: Germany Medium Voltage Cable Market Revenue (Million) Forecast, by Application 2019 & 2032
- Table 24: Germany Medium Voltage Cable Market Volume (Meter) Forecast, by Application 2019 & 2032
- Table 25: United Kingdom Medium Voltage Cable Market Revenue (Million) Forecast, by Application 2019 & 2032
- Table 26: United Kingdom Medium Voltage Cable Market Volume (Meter) Forecast, by Application 2019 & 2032
- Table 27: France Medium Voltage Cable Market Revenue (Million) Forecast, by Application 2019 & 2032
- Table 28: France Medium Voltage Cable Market Volume (Meter) Forecast, by Application 2019 & 2032
- Table 29: Spain Medium Voltage Cable Market Revenue (Million) Forecast, by Application 2019 & 2032
- Table 30: Spain Medium Voltage Cable Market Volume (Meter) Forecast, by Application 2019 & 2032
- Table 31: Italy Medium Voltage Cable Market Revenue (Million) Forecast, by Application 2019 & 2032
- Table 32: Italy Medium Voltage Cable Market Volume (Meter) Forecast, by Application 2019 & 2032
- Table 33: Spain Medium Voltage Cable Market Revenue (Million) Forecast, by Application 2019 & 2032
- Table 34: Spain Medium Voltage Cable Market Volume (Meter) Forecast, by Application 2019 & 2032
- Table 35: Belgium Medium Voltage Cable Market Revenue (Million) Forecast, by Application 2019 & 2032
- Table 36: Belgium Medium Voltage Cable Market Volume (Meter) Forecast, by Application 2019 & 2032
- Table 37: Netherland Medium Voltage Cable Market Revenue (Million) Forecast, by Application 2019 & 2032
- Table 38: Netherland Medium Voltage Cable Market Volume (Meter) Forecast, by Application 2019 & 2032
- Table 39: Nordics Medium Voltage Cable Market Revenue (Million) Forecast, by Application 2019 & 2032
- Table 40: Nordics Medium Voltage Cable Market Volume (Meter) Forecast, by Application 2019 & 2032
- Table 41: Rest of Europe Medium Voltage Cable Market Revenue (Million) Forecast, by Application 2019 & 2032
- Table 42: Rest of Europe Medium Voltage Cable Market Volume (Meter) Forecast, by Application 2019 & 2032
- Table 43: Global Medium Voltage Cable Market Revenue Million Forecast, by Country 2019 & 2032
- Table 44: Global Medium Voltage Cable Market Volume Meter Forecast, by Country 2019 & 2032
- Table 45: China Medium Voltage Cable Market Revenue (Million) Forecast, by Application 2019 & 2032
- Table 46: China Medium Voltage Cable Market Volume (Meter) Forecast, by Application 2019 & 2032
- Table 47: Japan Medium Voltage Cable Market Revenue (Million) Forecast, by Application 2019 & 2032
- Table 48: Japan Medium Voltage Cable Market Volume (Meter) Forecast, by Application 2019 & 2032
- Table 49: India Medium Voltage Cable Market Revenue (Million) Forecast, by Application 2019 & 2032
- Table 50: India Medium Voltage Cable Market Volume (Meter) Forecast, by Application 2019 & 2032
- Table 51: South Korea Medium Voltage Cable Market Revenue (Million) Forecast, by Application 2019 & 2032
- Table 52: South Korea Medium Voltage Cable Market Volume (Meter) Forecast, by Application 2019 & 2032
- Table 53: Southeast Asia Medium Voltage Cable Market Revenue (Million) Forecast, by Application 2019 & 2032
- Table 54: Southeast Asia Medium Voltage Cable Market Volume (Meter) Forecast, by Application 2019 & 2032
- Table 55: Australia Medium Voltage Cable Market Revenue (Million) Forecast, by Application 2019 & 2032
- Table 56: Australia Medium Voltage Cable Market Volume (Meter) Forecast, by Application 2019 & 2032
- Table 57: Indonesia Medium Voltage Cable Market Revenue (Million) Forecast, by Application 2019 & 2032
- Table 58: Indonesia Medium Voltage Cable Market Volume (Meter) Forecast, by Application 2019 & 2032
- Table 59: Phillipes Medium Voltage Cable Market Revenue (Million) Forecast, by Application 2019 & 2032
- Table 60: Phillipes Medium Voltage Cable Market Volume (Meter) Forecast, by Application 2019 & 2032
- Table 61: Singapore Medium Voltage Cable Market Revenue (Million) Forecast, by Application 2019 & 2032
- Table 62: Singapore Medium Voltage Cable Market Volume (Meter) Forecast, by Application 2019 & 2032
- Table 63: Thailandc Medium Voltage Cable Market Revenue (Million) Forecast, by Application 2019 & 2032
- Table 64: Thailandc Medium Voltage Cable Market Volume (Meter) Forecast, by Application 2019 & 2032
- Table 65: Rest of Asia Pacific Medium Voltage Cable Market Revenue (Million) Forecast, by Application 2019 & 2032
- Table 66: Rest of Asia Pacific Medium Voltage Cable Market Volume (Meter) Forecast, by Application 2019 & 2032
- Table 67: Global Medium Voltage Cable Market Revenue Million Forecast, by Country 2019 & 2032
- Table 68: Global Medium Voltage Cable Market Volume Meter Forecast, by Country 2019 & 2032
- Table 69: Brazil Medium Voltage Cable Market Revenue (Million) Forecast, by Application 2019 & 2032
- Table 70: Brazil Medium Voltage Cable Market Volume (Meter) Forecast, by Application 2019 & 2032
- Table 71: Argentina Medium Voltage Cable Market Revenue (Million) Forecast, by Application 2019 & 2032
- Table 72: Argentina Medium Voltage Cable Market Volume (Meter) Forecast, by Application 2019 & 2032
- Table 73: Peru Medium Voltage Cable Market Revenue (Million) Forecast, by Application 2019 & 2032
- Table 74: Peru Medium Voltage Cable Market Volume (Meter) Forecast, by Application 2019 & 2032
- Table 75: Chile Medium Voltage Cable Market Revenue (Million) Forecast, by Application 2019 & 2032
- Table 76: Chile Medium Voltage Cable Market Volume (Meter) Forecast, by Application 2019 & 2032
- Table 77: Colombia Medium Voltage Cable Market Revenue (Million) Forecast, by Application 2019 & 2032
- Table 78: Colombia Medium Voltage Cable Market Volume (Meter) Forecast, by Application 2019 & 2032
- Table 79: Ecuador Medium Voltage Cable Market Revenue (Million) Forecast, by Application 2019 & 2032
- Table 80: Ecuador Medium Voltage Cable Market Volume (Meter) Forecast, by Application 2019 & 2032
- Table 81: Venezuela Medium Voltage Cable Market Revenue (Million) Forecast, by Application 2019 & 2032
- Table 82: Venezuela Medium Voltage Cable Market Volume (Meter) Forecast, by Application 2019 & 2032
- Table 83: Rest of South America Medium Voltage Cable Market Revenue (Million) Forecast, by Application 2019 & 2032
- Table 84: Rest of South America Medium Voltage Cable Market Volume (Meter) Forecast, by Application 2019 & 2032
- Table 85: Global Medium Voltage Cable Market Revenue Million Forecast, by Country 2019 & 2032
- Table 86: Global Medium Voltage Cable Market Volume Meter Forecast, by Country 2019 & 2032
- Table 87: United States Medium Voltage Cable Market Revenue (Million) Forecast, by Application 2019 & 2032
- Table 88: United States Medium Voltage Cable Market Volume (Meter) Forecast, by Application 2019 & 2032
- Table 89: Canada Medium Voltage Cable Market Revenue (Million) Forecast, by Application 2019 & 2032
- Table 90: Canada Medium Voltage Cable Market Volume (Meter) Forecast, by Application 2019 & 2032
- Table 91: Mexico Medium Voltage Cable Market Revenue (Million) Forecast, by Application 2019 & 2032
- Table 92: Mexico Medium Voltage Cable Market Volume (Meter) Forecast, by Application 2019 & 2032
- Table 93: Global Medium Voltage Cable Market Revenue Million Forecast, by Country 2019 & 2032
- Table 94: Global Medium Voltage Cable Market Volume Meter Forecast, by Country 2019 & 2032
- Table 95: United Arab Emirates Medium Voltage Cable Market Revenue (Million) Forecast, by Application 2019 & 2032
- Table 96: United Arab Emirates Medium Voltage Cable Market Volume (Meter) Forecast, by Application 2019 & 2032
- Table 97: Saudi Arabia Medium Voltage Cable Market Revenue (Million) Forecast, by Application 2019 & 2032
- Table 98: Saudi Arabia Medium Voltage Cable Market Volume (Meter) Forecast, by Application 2019 & 2032
- Table 99: South Africa Medium Voltage Cable Market Revenue (Million) Forecast, by Application 2019 & 2032
- Table 100: South Africa Medium Voltage Cable Market Volume (Meter) Forecast, by Application 2019 & 2032
- Table 101: Rest of Middle East and Africa Medium Voltage Cable Market Revenue (Million) Forecast, by Application 2019 & 2032
- Table 102: Rest of Middle East and Africa Medium Voltage Cable Market Volume (Meter) Forecast, by Application 2019 & 2032
- Table 103: Global Medium Voltage Cable Market Revenue Million Forecast, by Voltage Level 2019 & 2032
- Table 104: Global Medium Voltage Cable Market Volume Meter Forecast, by Voltage Level 2019 & 2032
- Table 105: Global Medium Voltage Cable Market Revenue Million Forecast, by Application 2019 & 2032
- Table 106: Global Medium Voltage Cable Market Volume Meter Forecast, by Application 2019 & 2032
- Table 107: Global Medium Voltage Cable Market Revenue Million Forecast, by Insulation 2019 & 2032
- Table 108: Global Medium Voltage Cable Market Volume Meter Forecast, by Insulation 2019 & 2032
- Table 109: Global Medium Voltage Cable Market Revenue Million Forecast, by Location of Deployment 2019 & 2032
- Table 110: Global Medium Voltage Cable Market Volume Meter Forecast, by Location of Deployment 2019 & 2032
- Table 111: Global Medium Voltage Cable Market Revenue Million Forecast, by Country 2019 & 2032
- Table 112: Global Medium Voltage Cable Market Volume Meter Forecast, by Country 2019 & 2032
- Table 113: United States Medium Voltage Cable Market Revenue (Million) Forecast, by Application 2019 & 2032
- Table 114: United States Medium Voltage Cable Market Volume (Meter) Forecast, by Application 2019 & 2032
- Table 115: Canada Medium Voltage Cable Market Revenue (Million) Forecast, by Application 2019 & 2032
- Table 116: Canada Medium Voltage Cable Market Volume (Meter) Forecast, by Application 2019 & 2032
- Table 117: Rest of North America Medium Voltage Cable Market Revenue (Million) Forecast, by Application 2019 & 2032
- Table 118: Rest of North America Medium Voltage Cable Market Volume (Meter) Forecast, by Application 2019 & 2032
- Table 119: Global Medium Voltage Cable Market Revenue Million Forecast, by Voltage Level 2019 & 2032
- Table 120: Global Medium Voltage Cable Market Volume Meter Forecast, by Voltage Level 2019 & 2032
- Table 121: Global Medium Voltage Cable Market Revenue Million Forecast, by Application 2019 & 2032
- Table 122: Global Medium Voltage Cable Market Volume Meter Forecast, by Application 2019 & 2032
- Table 123: Global Medium Voltage Cable Market Revenue Million Forecast, by Insulation 2019 & 2032
- Table 124: Global Medium Voltage Cable Market Volume Meter Forecast, by Insulation 2019 & 2032
- Table 125: Global Medium Voltage Cable Market Revenue Million Forecast, by Location of Deployment 2019 & 2032
- Table 126: Global Medium Voltage Cable Market Volume Meter Forecast, by Location of Deployment 2019 & 2032
- Table 127: Global Medium Voltage Cable Market Revenue Million Forecast, by Country 2019 & 2032
- Table 128: Global Medium Voltage Cable Market Volume Meter Forecast, by Country 2019 & 2032
- Table 129: United Kingdom Medium Voltage Cable Market Revenue (Million) Forecast, by Application 2019 & 2032
- Table 130: United Kingdom Medium Voltage Cable Market Volume (Meter) Forecast, by Application 2019 & 2032
- Table 131: Spain Medium Voltage Cable Market Revenue (Million) Forecast, by Application 2019 & 2032
- Table 132: Spain Medium Voltage Cable Market Volume (Meter) Forecast, by Application 2019 & 2032
- Table 133: NORDIC Medium Voltage Cable Market Revenue (Million) Forecast, by Application 2019 & 2032
- Table 134: NORDIC Medium Voltage Cable Market Volume (Meter) Forecast, by Application 2019 & 2032
- Table 135: Russia Medium Voltage Cable Market Revenue (Million) Forecast, by Application 2019 & 2032
- Table 136: Russia Medium Voltage Cable Market Volume (Meter) Forecast, by Application 2019 & 2032
- Table 137: Turkey Medium Voltage Cable Market Revenue (Million) Forecast, by Application 2019 & 2032
- Table 138: Turkey Medium Voltage Cable Market Volume (Meter) Forecast, by Application 2019 & 2032
- Table 139: Germany Medium Voltage Cable Market Revenue (Million) Forecast, by Application 2019 & 2032
- Table 140: Germany Medium Voltage Cable Market Volume (Meter) Forecast, by Application 2019 & 2032
- Table 141: Italy Medium Voltage Cable Market Revenue (Million) Forecast, by Application 2019 & 2032
- Table 142: Italy Medium Voltage Cable Market Volume (Meter) Forecast, by Application 2019 & 2032
- Table 143: Rest of Europe Medium Voltage Cable Market Revenue (Million) Forecast, by Application 2019 & 2032
- Table 144: Rest of Europe Medium Voltage Cable Market Volume (Meter) Forecast, by Application 2019 & 2032
- Table 145: Global Medium Voltage Cable Market Revenue Million Forecast, by Voltage Level 2019 & 2032
- Table 146: Global Medium Voltage Cable Market Volume Meter Forecast, by Voltage Level 2019 & 2032
- Table 147: Global Medium Voltage Cable Market Revenue Million Forecast, by Application 2019 & 2032
- Table 148: Global Medium Voltage Cable Market Volume Meter Forecast, by Application 2019 & 2032
- Table 149: Global Medium Voltage Cable Market Revenue Million Forecast, by Insulation 2019 & 2032
- Table 150: Global Medium Voltage Cable Market Volume Meter Forecast, by Insulation 2019 & 2032
- Table 151: Global Medium Voltage Cable Market Revenue Million Forecast, by Location of Deployment 2019 & 2032
- Table 152: Global Medium Voltage Cable Market Volume Meter Forecast, by Location of Deployment 2019 & 2032
- Table 153: Global Medium Voltage Cable Market Revenue Million Forecast, by Country 2019 & 2032
- Table 154: Global Medium Voltage Cable Market Volume Meter Forecast, by Country 2019 & 2032
- Table 155: China Medium Voltage Cable Market Revenue (Million) Forecast, by Application 2019 & 2032
- Table 156: China Medium Voltage Cable Market Volume (Meter) Forecast, by Application 2019 & 2032
- Table 157: India Medium Voltage Cable Market Revenue (Million) Forecast, by Application 2019 & 2032
- Table 158: India Medium Voltage Cable Market Volume (Meter) Forecast, by Application 2019 & 2032
- Table 159: Japan Medium Voltage Cable Market Revenue (Million) Forecast, by Application 2019 & 2032
- Table 160: Japan Medium Voltage Cable Market Volume (Meter) Forecast, by Application 2019 & 2032
- Table 161: Malaysia Medium Voltage Cable Market Revenue (Million) Forecast, by Application 2019 & 2032
- Table 162: Malaysia Medium Voltage Cable Market Volume (Meter) Forecast, by Application 2019 & 2032
- Table 163: Thailand Medium Voltage Cable Market Revenue (Million) Forecast, by Application 2019 & 2032
- Table 164: Thailand Medium Voltage Cable Market Volume (Meter) Forecast, by Application 2019 & 2032
- Table 165: Indonesia Medium Voltage Cable Market Revenue (Million) Forecast, by Application 2019 & 2032
- Table 166: Indonesia Medium Voltage Cable Market Volume (Meter) Forecast, by Application 2019 & 2032
- Table 167: Vietnam Medium Voltage Cable Market Revenue (Million) Forecast, by Application 2019 & 2032
- Table 168: Vietnam Medium Voltage Cable Market Volume (Meter) Forecast, by Application 2019 & 2032
- Table 169: Rest of Asia Pacific Medium Voltage Cable Market Revenue (Million) Forecast, by Application 2019 & 2032
- Table 170: Rest of Asia Pacific Medium Voltage Cable Market Volume (Meter) Forecast, by Application 2019 & 2032
- Table 171: Global Medium Voltage Cable Market Revenue Million Forecast, by Voltage Level 2019 & 2032
- Table 172: Global Medium Voltage Cable Market Volume Meter Forecast, by Voltage Level 2019 & 2032
- Table 173: Global Medium Voltage Cable Market Revenue Million Forecast, by Application 2019 & 2032
- Table 174: Global Medium Voltage Cable Market Volume Meter Forecast, by Application 2019 & 2032
- Table 175: Global Medium Voltage Cable Market Revenue Million Forecast, by Insulation 2019 & 2032
- Table 176: Global Medium Voltage Cable Market Volume Meter Forecast, by Insulation 2019 & 2032
- Table 177: Global Medium Voltage Cable Market Revenue Million Forecast, by Location of Deployment 2019 & 2032
- Table 178: Global Medium Voltage Cable Market Volume Meter Forecast, by Location of Deployment 2019 & 2032
- Table 179: Global Medium Voltage Cable Market Revenue Million Forecast, by Country 2019 & 2032
- Table 180: Global Medium Voltage Cable Market Volume Meter Forecast, by Country 2019 & 2032
- Table 181: Brazil Medium Voltage Cable Market Revenue (Million) Forecast, by Application 2019 & 2032
- Table 182: Brazil Medium Voltage Cable Market Volume (Meter) Forecast, by Application 2019 & 2032
- Table 183: Argentina Medium Voltage Cable Market Revenue (Million) Forecast, by Application 2019 & 2032
- Table 184: Argentina Medium Voltage Cable Market Volume (Meter) Forecast, by Application 2019 & 2032
- Table 185: Colombia Medium Voltage Cable Market Revenue (Million) Forecast, by Application 2019 & 2032
- Table 186: Colombia Medium Voltage Cable Market Volume (Meter) Forecast, by Application 2019 & 2032
- Table 187: Rest of South America Medium Voltage Cable Market Revenue (Million) Forecast, by Application 2019 & 2032
- Table 188: Rest of South America Medium Voltage Cable Market Volume (Meter) Forecast, by Application 2019 & 2032
- Table 189: Global Medium Voltage Cable Market Revenue Million Forecast, by Voltage Level 2019 & 2032
- Table 190: Global Medium Voltage Cable Market Volume Meter Forecast, by Voltage Level 2019 & 2032
- Table 191: Global Medium Voltage Cable Market Revenue Million Forecast, by Application 2019 & 2032
- Table 192: Global Medium Voltage Cable Market Volume Meter Forecast, by Application 2019 & 2032
- Table 193: Global Medium Voltage Cable Market Revenue Million Forecast, by Insulation 2019 & 2032
- Table 194: Global Medium Voltage Cable Market Volume Meter Forecast, by Insulation 2019 & 2032
- Table 195: Global Medium Voltage Cable Market Revenue Million Forecast, by Location of Deployment 2019 & 2032
- Table 196: Global Medium Voltage Cable Market Volume Meter Forecast, by Location of Deployment 2019 & 2032
- Table 197: Global Medium Voltage Cable Market Revenue Million Forecast, by Country 2019 & 2032
- Table 198: Global Medium Voltage Cable Market Volume Meter Forecast, by Country 2019 & 2032
- Table 199: United Arab Emirates Medium Voltage Cable Market Revenue (Million) Forecast, by Application 2019 & 2032
- Table 200: United Arab Emirates Medium Voltage Cable Market Volume (Meter) Forecast, by Application 2019 & 2032
- Table 201: Saudi Arabia Medium Voltage Cable Market Revenue (Million) Forecast, by Application 2019 & 2032
- Table 202: Saudi Arabia Medium Voltage Cable Market Volume (Meter) Forecast, by Application 2019 & 2032
- Table 203: South Africa Medium Voltage Cable Market Revenue (Million) Forecast, by Application 2019 & 2032
- Table 204: South Africa Medium Voltage Cable Market Volume (Meter) Forecast, by Application 2019 & 2032
- Table 205: Nigeria Medium Voltage Cable Market Revenue (Million) Forecast, by Application 2019 & 2032
- Table 206: Nigeria Medium Voltage Cable Market Volume (Meter) Forecast, by Application 2019 & 2032
- Table 207: Qatar Medium Voltage Cable Market Revenue (Million) Forecast, by Application 2019 & 2032
- Table 208: Qatar Medium Voltage Cable Market Volume (Meter) Forecast, by Application 2019 & 2032
- Table 209: Egypt Medium Voltage Cable Market Revenue (Million) Forecast, by Application 2019 & 2032
- Table 210: Egypt Medium Voltage Cable Market Volume (Meter) Forecast, by Application 2019 & 2032
- Table 211: Rest of Middle East and Africa Medium Voltage Cable Market Revenue (Million) Forecast, by Application 2019 & 2032
- Table 212: Rest of Middle East and Africa Medium Voltage Cable Market Volume (Meter) Forecast, by Application 2019 & 2032
Frequently Asked Questions
1. What is the projected Compound Annual Growth Rate (CAGR) of the Medium Voltage Cable Market?
The projected CAGR is approximately 5.40%.
2. Which companies are prominent players in the Medium Voltage Cable Market?
Key companies in the market include Nexans SA, NKT AS, The Okonite Company, Prysmian SpA, Siemens AG, Southwire Company LLC, Riyadh Cables Group, Eland Cables Ltd, Cablel Hellenic Cables Group, General Cables Corporation*List Not Exhaustive 6 4 Market Ranking Analysi.
3. What are the main segments of the Medium Voltage Cable Market?
The market segments include Voltage Level, Application, Insulation, Location of Deployment.
4. Can you provide details about the market size?
The market size is estimated to be USD 48.71 Million as of 2022.
5. What are some drivers contributing to market growth?
4.; Increase in Electricity Propelled by Growing Industrialization and Urbanization4.; Aging Power Sector Infrastructure.
6. What are the notable trends driving market growth?
The Underground Segment to Witness Significant Growth.
7. Are there any restraints impacting market growth?
4.; Limited Investments to Support Medium-voltage Transmission Network.
8. Can you provide examples of recent developments in the market?
February 2023: Prysmian Group confirmed its support for upgrading the United Kingdom’s electricity grid. The company was awarded a medium-voltage cable framework agreement with National Grid Electricity Distribution for a minimum of 3 years.
9. What pricing options are available for accessing the report?
Pricing options include single-user, multi-user, and enterprise licenses priced at USD 4750, USD 5250, and USD 8750 respectively.
10. Is the market size provided in terms of value or volume?
The market size is provided in terms of value, measured in Million and volume, measured in Meter.
11. Are there any specific market keywords associated with the report?
Yes, the market keyword associated with the report is "Medium Voltage Cable Market," which aids in identifying and referencing the specific market segment covered.
12. How do I determine which pricing option suits my needs best?
The pricing options vary based on user requirements and access needs. Individual users may opt for single-user licenses, while businesses requiring broader access may choose multi-user or enterprise licenses for cost-effective access to the report.
13. Are there any additional resources or data provided in the Medium Voltage Cable Market report?
While the report offers comprehensive insights, it's advisable to review the specific contents or supplementary materials provided to ascertain if additional resources or data are available.
14. How can I stay updated on further developments or reports in the Medium Voltage Cable Market?
To stay informed about further developments, trends, and reports in the Medium Voltage Cable Market, consider subscribing to industry newsletters, following relevant companies and organizations, or regularly checking reputable industry news sources and publications.
Methodology
Step 1 - Identification of Relevant Samples Size from Population Database


Step 2 - Approaches for Defining Global Market Size (Value, Volume* & Price*)

Note*: In applicable scenarios
Step 3 - Data Sources
Primary Research
- Web Analytics
- Survey Reports
- Research Institute
- Latest Research Reports
- Opinion Leaders
Secondary Research
- Annual Reports
- White Paper
- Latest Press Release
- Industry Association
- Paid Database
- Investor Presentations

Step 4 - Data Triangulation
Involves using different sources of information in order to increase the validity of a study
These sources are likely to be stakeholders in a program - participants, other researchers, program staff, other community members, and so on.
Then we put all data in single framework & apply various statistical tools to find out the dynamic on the market.
During the analysis stage, feedback from the stakeholder groups would be compared to determine areas of agreement as well as areas of divergence


