
Key Insights
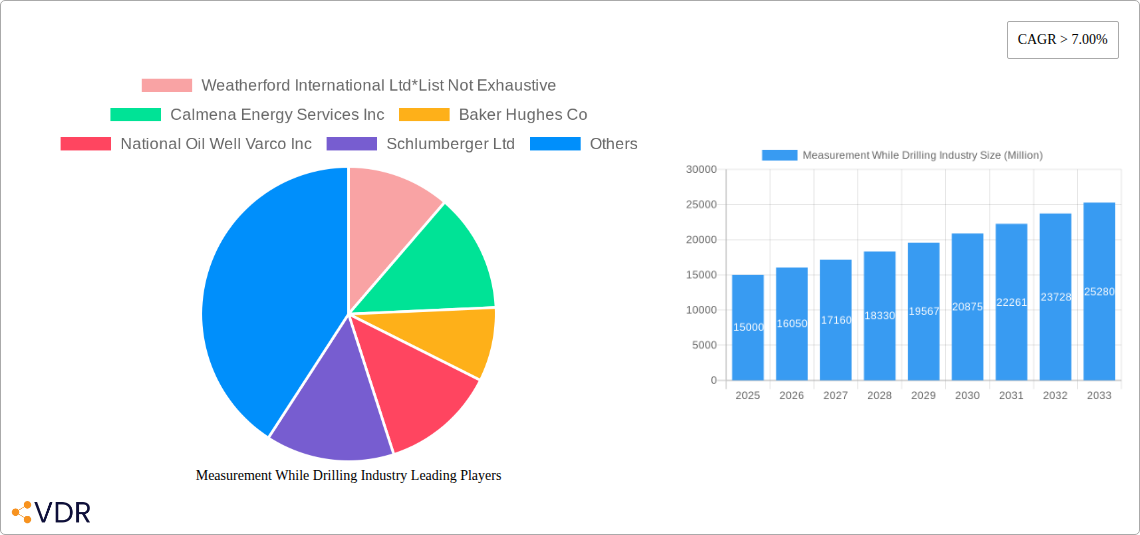
The Measurement While Drilling (MWD) industry is experiencing robust growth, driven by the increasing demand for enhanced oil and gas exploration and production efficiency. A compound annual growth rate (CAGR) exceeding 7% from 2019-2033 indicates a significant expansion of the market, projected to reach substantial value within the forecast period. This growth is fueled by several key factors. Firstly, the ongoing need for improved drilling accuracy and reduced non-productive time (NPT) is pushing adoption of advanced MWD technologies. Secondly, the exploration and production of oil and gas in increasingly challenging environments—deepwater and harsh terrains— necessitates reliable real-time data acquisition provided by MWD systems. Finally, the integration of MWD data with other drilling technologies, enabling better decision-making and optimized drilling strategies, is further boosting market expansion. The onshore segment currently holds a larger market share compared to the offshore segment, but the offshore segment is expected to witness significant growth driven by rising deepwater exploration activities. Major players like Schlumberger, Halliburton, and Baker Hughes are actively investing in research and development, leading to technological advancements and an increasingly competitive landscape. While supply chain constraints and fluctuating oil prices pose challenges, the long-term prospects for the MWD industry remain positive, fueled by the persistent global need for energy resources.
The geographical distribution of the MWD market reflects global energy exploration patterns. North America, particularly the United States and Canada, holds a substantial market share due to established oil and gas infrastructure and ongoing exploration activities. However, Asia-Pacific, driven by strong growth in countries like China and India, is expected to show the highest growth rate. Europe maintains a stable market presence, while the Middle East and Africa regions exhibit substantial potential for growth, linked to increasing investments in oil and gas exploration projects. The competitive landscape is characterized by a mix of established multinational corporations and smaller specialized service providers. Technological advancements, strategic partnerships, and mergers and acquisitions are likely to reshape the market structure in the coming years. Despite potential headwinds, the consistent global need for efficient and accurate drilling techniques ensures the continued growth and development of the MWD market.
Measurement While Drilling (MWD) Industry Market Report: 2019-2033
This comprehensive report provides an in-depth analysis of the Measurement While Drilling (MWD) industry, covering market dynamics, growth trends, regional performance, and key players. The study period spans 2019-2033, with 2025 serving as the base and estimated year. The report is essential for industry professionals, investors, and strategic decision-makers seeking a clear understanding of this dynamic market. The total market size in 2025 is estimated at $XX Million.
Measurement While Drilling Industry Market Dynamics & Structure
The MWD market, valued at $XX Million in 2025, is characterized by moderate concentration, with key players holding significant market share. Technological innovation, particularly in sensor technology and data analytics, is a primary growth driver. Stringent regulatory frameworks concerning safety and environmental impact shape market practices. Competitive pressure from substitute technologies and the increasing adoption of automation are key factors to consider. The market experiences frequent M&A activity, driven by the need for expansion and technological integration.
- Market Concentration: The top 5 players account for approximately XX% of the market share in 2025.
- Technological Innovation: Advancements in downhole sensors, wireless data transmission, and AI-driven data analysis are driving market growth.
- Regulatory Landscape: Compliance with environmental regulations and safety standards significantly impacts operational costs and market expansion.
- M&A Activity: The past five years have seen XX major M&A deals, mostly focused on consolidation and technology acquisition.
- Competitive Substitutes: The emergence of alternative drilling technologies poses a moderate competitive threat.
Measurement While Drilling Industry Growth Trends & Insights
The MWD market exhibits a steady growth trajectory, driven by increasing oil and gas exploration activities, and the rising demand for real-time drilling data to optimize operations. The market witnessed a Compound Annual Growth Rate (CAGR) of XX% during the historical period (2019-2024) and is projected to maintain a CAGR of XX% during the forecast period (2025-2033). Technological disruptions, such as the adoption of advanced sensor technologies and data analytics, are accelerating market adoption and improving operational efficiency. Consumer behavior (oil and gas companies) increasingly favors real-time data for improved drilling performance and cost reduction. The market penetration rate in 2025 is estimated at XX%.

Dominant Regions, Countries, or Segments in Measurement While Drilling Industry
The onshore segment currently dominates the MWD market, representing XX% of the total market revenue in 2025, largely driven by the extensive presence of onshore drilling operations globally. However, the offshore segment is projected to experience significant growth in the coming years due to increasing deepwater exploration and production activities. North America and the Middle East remain key regional markets due to their robust oil and gas exploration and production sectors.
- Onshore Dominance: High oil and gas production in regions like North America and the Middle East fuels onshore MWD demand.
- Offshore Growth: Deepwater exploration and production are driving growth in the offshore segment.
- Regional Variations: Government policies, infrastructure development, and regional energy demands vary across regions, impacting market growth.
Measurement While Drilling Industry Product Landscape
MWD systems encompass a range of products, including sensors (pressure, temperature, inclination, azimuth), telemetry systems, and data processing software. Recent innovations focus on enhancing accuracy, reliability, and data processing speed. Unique selling propositions include advanced data analytics capabilities, improved sensor technology, and robust communication systems. Technological advancements revolve around reducing latency, increasing data bandwidth, and integrating AI for better decision-making.
Key Drivers, Barriers & Challenges in Measurement While Drilling Industry
Key Drivers: Increased demand for real-time drilling data, technological advancements in sensor and data processing technologies, growing oil and gas exploration activities globally, and the need for improved operational efficiency are major drivers.
Key Barriers and Challenges: High initial investment costs for implementing MWD systems, potential technical difficulties and downtime, competition from alternative technologies, and stringent regulatory compliance requirements are primary challenges. Supply chain disruptions can impact availability and cost, resulting in a XX% increase in prices during periods of high demand.
Emerging Opportunities in Measurement While Drilling Industry
Untapped markets in developing economies, increasing demand for autonomous drilling, and integration of MWD data with other drilling parameters present significant opportunities. The development of more robust and cost-effective MWD systems catering to the needs of smaller drilling operations is another promising area.
Growth Accelerators in the Measurement While Drilling Industry Industry
Technological breakthroughs like advanced sensor miniaturization, improved data analytics capabilities, and the integration of AI and machine learning are poised to significantly accelerate market growth. Strategic partnerships among MWD providers and oilfield service companies will also stimulate market expansion.
Key Players Shaping the Measurement While Drilling Industry Market
- Weatherford International Ltd
- Calmena Energy Services Inc
- Baker Hughes Co
- National Oil Well Varco Inc
- Schlumberger Ltd
- Gyrodata Inc
- China Oilfield Services Limited
- Halliburton Company
- Nabors Industries Limited
- Scientific Drilling International Inc
Notable Milestones in Measurement While Drilling Industry Sector
- 2020: Launch of a new MWD system with enhanced data analytics capabilities by Baker Hughes.
- 2022: Acquisition of a smaller MWD technology company by Schlumberger.
- 2023: Introduction of AI-powered data interpretation software by Weatherford. (Further milestones can be added here)
In-Depth Measurement While Drilling Industry Market Outlook
The future of the MWD industry is bright, driven by sustained demand for enhanced drilling efficiency and cost optimization. The market is projected to experience significant growth, fueled by technological advancements, strategic partnerships, and expansion into emerging markets. Companies focusing on innovation and providing comprehensive solutions are expected to capture substantial market share. The continued development of robust and cost-effective systems will unlock opportunities in previously underserved segments.
Measurement While Drilling Industry Segmentation
-
1. Location of Deployment
- 1.1. Onshore
- 1.2. Offshore
Measurement While Drilling Industry Segmentation By Geography
- 1. North America
- 2. Europe
- 3. Asia Pacific
- 4. South America
- 5. Middle East

Measurement While Drilling Industry REPORT HIGHLIGHTS
| Aspects | Details |
|---|---|
| Study Period | 2019-2033 |
| Base Year | 2024 |
| Estimated Year | 2025 |
| Forecast Period | 2025-2033 |
| Historical Period | 2019-2024 |
| Growth Rate | CAGR of > 7.00% from 2019-2033 |
| Segmentation |
|
Table of Contents
- 1. Introduction
- 1.1. Research Scope
- 1.2. Market Segmentation
- 1.3. Research Methodology
- 1.4. Definitions and Assumptions
- 2. Executive Summary
- 2.1. Introduction
- 3. Market Dynamics
- 3.1. Introduction
- 3.2. Market Drivers
- 3.2.1. 4.; Presence of Strict Government Regulations to Control Air Pollution
- 3.3. Market Restrains
- 3.3.1. 4.; Increasing Adoption of Renewable Energy
- 3.4. Market Trends
- 3.4.1. Offshore Oil and Gas to Dominate the Market
- 4. Market Factor Analysis
- 4.1. Porters Five Forces
- 4.2. Supply/Value Chain
- 4.3. PESTEL analysis
- 4.4. Market Entropy
- 4.5. Patent/Trademark Analysis
- 5. Global Measurement While Drilling Industry Analysis, Insights and Forecast, 2019-2031
- 5.1. Market Analysis, Insights and Forecast - by Location of Deployment
- 5.1.1. Onshore
- 5.1.2. Offshore
- 5.2. Market Analysis, Insights and Forecast - by Region
- 5.2.1. North America
- 5.2.2. Europe
- 5.2.3. Asia Pacific
- 5.2.4. South America
- 5.2.5. Middle East
- 5.1. Market Analysis, Insights and Forecast - by Location of Deployment
- 6. North America Measurement While Drilling Industry Analysis, Insights and Forecast, 2019-2031
- 6.1. Market Analysis, Insights and Forecast - by Location of Deployment
- 6.1.1. Onshore
- 6.1.2. Offshore
- 6.1. Market Analysis, Insights and Forecast - by Location of Deployment
- 7. Europe Measurement While Drilling Industry Analysis, Insights and Forecast, 2019-2031
- 7.1. Market Analysis, Insights and Forecast - by Location of Deployment
- 7.1.1. Onshore
- 7.1.2. Offshore
- 7.1. Market Analysis, Insights and Forecast - by Location of Deployment
- 8. Asia Pacific Measurement While Drilling Industry Analysis, Insights and Forecast, 2019-2031
- 8.1. Market Analysis, Insights and Forecast - by Location of Deployment
- 8.1.1. Onshore
- 8.1.2. Offshore
- 8.1. Market Analysis, Insights and Forecast - by Location of Deployment
- 9. South America Measurement While Drilling Industry Analysis, Insights and Forecast, 2019-2031
- 9.1. Market Analysis, Insights and Forecast - by Location of Deployment
- 9.1.1. Onshore
- 9.1.2. Offshore
- 9.1. Market Analysis, Insights and Forecast - by Location of Deployment
- 10. Middle East Measurement While Drilling Industry Analysis, Insights and Forecast, 2019-2031
- 10.1. Market Analysis, Insights and Forecast - by Location of Deployment
- 10.1.1. Onshore
- 10.1.2. Offshore
- 10.1. Market Analysis, Insights and Forecast - by Location of Deployment
- 11. North America Measurement While Drilling Industry Analysis, Insights and Forecast, 2019-2031
- 11.1. Market Analysis, Insights and Forecast - By Country/Sub-region
- 11.1.1 United States
- 11.1.2 Canada
- 11.1.3 Mexico
- 12. Europe Measurement While Drilling Industry Analysis, Insights and Forecast, 2019-2031
- 12.1. Market Analysis, Insights and Forecast - By Country/Sub-region
- 12.1.1 Germany
- 12.1.2 United Kingdom
- 12.1.3 France
- 12.1.4 Spain
- 12.1.5 Italy
- 12.1.6 Spain
- 12.1.7 Belgium
- 12.1.8 Netherland
- 12.1.9 Nordics
- 12.1.10 Rest of Europe
- 13. Asia Pacific Measurement While Drilling Industry Analysis, Insights and Forecast, 2019-2031
- 13.1. Market Analysis, Insights and Forecast - By Country/Sub-region
- 13.1.1 China
- 13.1.2 Japan
- 13.1.3 India
- 13.1.4 South Korea
- 13.1.5 Southeast Asia
- 13.1.6 Australia
- 13.1.7 Indonesia
- 13.1.8 Phillipes
- 13.1.9 Singapore
- 13.1.10 Thailandc
- 13.1.11 Rest of Asia Pacific
- 14. South America Measurement While Drilling Industry Analysis, Insights and Forecast, 2019-2031
- 14.1. Market Analysis, Insights and Forecast - By Country/Sub-region
- 14.1.1 Brazil
- 14.1.2 Argentina
- 14.1.3 Peru
- 14.1.4 Chile
- 14.1.5 Colombia
- 14.1.6 Ecuador
- 14.1.7 Venezuela
- 14.1.8 Rest of South America
- 15. North America Measurement While Drilling Industry Analysis, Insights and Forecast, 2019-2031
- 15.1. Market Analysis, Insights and Forecast - By Country/Sub-region
- 15.1.1 United States
- 15.1.2 Canada
- 15.1.3 Mexico
- 16. MEA Measurement While Drilling Industry Analysis, Insights and Forecast, 2019-2031
- 16.1. Market Analysis, Insights and Forecast - By Country/Sub-region
- 16.1.1 United Arab Emirates
- 16.1.2 Saudi Arabia
- 16.1.3 South Africa
- 16.1.4 Rest of Middle East and Africa
- 17. Competitive Analysis
- 17.1. Global Market Share Analysis 2024
- 17.2. Company Profiles
- 17.2.1 Weatherford International Ltd*List Not Exhaustive
- 17.2.1.1. Overview
- 17.2.1.2. Products
- 17.2.1.3. SWOT Analysis
- 17.2.1.4. Recent Developments
- 17.2.1.5. Financials (Based on Availability)
- 17.2.2 Calmena Energy Services Inc
- 17.2.2.1. Overview
- 17.2.2.2. Products
- 17.2.2.3. SWOT Analysis
- 17.2.2.4. Recent Developments
- 17.2.2.5. Financials (Based on Availability)
- 17.2.3 Baker Hughes Co
- 17.2.3.1. Overview
- 17.2.3.2. Products
- 17.2.3.3. SWOT Analysis
- 17.2.3.4. Recent Developments
- 17.2.3.5. Financials (Based on Availability)
- 17.2.4 National Oil Well Varco Inc
- 17.2.4.1. Overview
- 17.2.4.2. Products
- 17.2.4.3. SWOT Analysis
- 17.2.4.4. Recent Developments
- 17.2.4.5. Financials (Based on Availability)
- 17.2.5 Schlumberger Ltd
- 17.2.5.1. Overview
- 17.2.5.2. Products
- 17.2.5.3. SWOT Analysis
- 17.2.5.4. Recent Developments
- 17.2.5.5. Financials (Based on Availability)
- 17.2.6 Gyrodata Inc
- 17.2.6.1. Overview
- 17.2.6.2. Products
- 17.2.6.3. SWOT Analysis
- 17.2.6.4. Recent Developments
- 17.2.6.5. Financials (Based on Availability)
- 17.2.7 China Oilfield Services Limited
- 17.2.7.1. Overview
- 17.2.7.2. Products
- 17.2.7.3. SWOT Analysis
- 17.2.7.4. Recent Developments
- 17.2.7.5. Financials (Based on Availability)
- 17.2.8 Halliburton Company
- 17.2.8.1. Overview
- 17.2.8.2. Products
- 17.2.8.3. SWOT Analysis
- 17.2.8.4. Recent Developments
- 17.2.8.5. Financials (Based on Availability)
- 17.2.9 Nabors Industries Limited
- 17.2.9.1. Overview
- 17.2.9.2. Products
- 17.2.9.3. SWOT Analysis
- 17.2.9.4. Recent Developments
- 17.2.9.5. Financials (Based on Availability)
- 17.2.10 Scientific Drilling International Inc
- 17.2.10.1. Overview
- 17.2.10.2. Products
- 17.2.10.3. SWOT Analysis
- 17.2.10.4. Recent Developments
- 17.2.10.5. Financials (Based on Availability)
- 17.2.1 Weatherford International Ltd*List Not Exhaustive
List of Figures
- Figure 1: Global Measurement While Drilling Industry Revenue Breakdown (Million, %) by Region 2024 & 2032
- Figure 2: North America Measurement While Drilling Industry Revenue (Million), by Country 2024 & 2032
- Figure 3: North America Measurement While Drilling Industry Revenue Share (%), by Country 2024 & 2032
- Figure 4: Europe Measurement While Drilling Industry Revenue (Million), by Country 2024 & 2032
- Figure 5: Europe Measurement While Drilling Industry Revenue Share (%), by Country 2024 & 2032
- Figure 6: Asia Pacific Measurement While Drilling Industry Revenue (Million), by Country 2024 & 2032
- Figure 7: Asia Pacific Measurement While Drilling Industry Revenue Share (%), by Country 2024 & 2032
- Figure 8: South America Measurement While Drilling Industry Revenue (Million), by Country 2024 & 2032
- Figure 9: South America Measurement While Drilling Industry Revenue Share (%), by Country 2024 & 2032
- Figure 10: North America Measurement While Drilling Industry Revenue (Million), by Country 2024 & 2032
- Figure 11: North America Measurement While Drilling Industry Revenue Share (%), by Country 2024 & 2032
- Figure 12: MEA Measurement While Drilling Industry Revenue (Million), by Country 2024 & 2032
- Figure 13: MEA Measurement While Drilling Industry Revenue Share (%), by Country 2024 & 2032
- Figure 14: North America Measurement While Drilling Industry Revenue (Million), by Location of Deployment 2024 & 2032
- Figure 15: North America Measurement While Drilling Industry Revenue Share (%), by Location of Deployment 2024 & 2032
- Figure 16: North America Measurement While Drilling Industry Revenue (Million), by Country 2024 & 2032
- Figure 17: North America Measurement While Drilling Industry Revenue Share (%), by Country 2024 & 2032
- Figure 18: Europe Measurement While Drilling Industry Revenue (Million), by Location of Deployment 2024 & 2032
- Figure 19: Europe Measurement While Drilling Industry Revenue Share (%), by Location of Deployment 2024 & 2032
- Figure 20: Europe Measurement While Drilling Industry Revenue (Million), by Country 2024 & 2032
- Figure 21: Europe Measurement While Drilling Industry Revenue Share (%), by Country 2024 & 2032
- Figure 22: Asia Pacific Measurement While Drilling Industry Revenue (Million), by Location of Deployment 2024 & 2032
- Figure 23: Asia Pacific Measurement While Drilling Industry Revenue Share (%), by Location of Deployment 2024 & 2032
- Figure 24: Asia Pacific Measurement While Drilling Industry Revenue (Million), by Country 2024 & 2032
- Figure 25: Asia Pacific Measurement While Drilling Industry Revenue Share (%), by Country 2024 & 2032
- Figure 26: South America Measurement While Drilling Industry Revenue (Million), by Location of Deployment 2024 & 2032
- Figure 27: South America Measurement While Drilling Industry Revenue Share (%), by Location of Deployment 2024 & 2032
- Figure 28: South America Measurement While Drilling Industry Revenue (Million), by Country 2024 & 2032
- Figure 29: South America Measurement While Drilling Industry Revenue Share (%), by Country 2024 & 2032
- Figure 30: Middle East Measurement While Drilling Industry Revenue (Million), by Location of Deployment 2024 & 2032
- Figure 31: Middle East Measurement While Drilling Industry Revenue Share (%), by Location of Deployment 2024 & 2032
- Figure 32: Middle East Measurement While Drilling Industry Revenue (Million), by Country 2024 & 2032
- Figure 33: Middle East Measurement While Drilling Industry Revenue Share (%), by Country 2024 & 2032
List of Tables
- Table 1: Global Measurement While Drilling Industry Revenue Million Forecast, by Region 2019 & 2032
- Table 2: Global Measurement While Drilling Industry Revenue Million Forecast, by Location of Deployment 2019 & 2032
- Table 3: Global Measurement While Drilling Industry Revenue Million Forecast, by Region 2019 & 2032
- Table 4: Global Measurement While Drilling Industry Revenue Million Forecast, by Country 2019 & 2032
- Table 5: United States Measurement While Drilling Industry Revenue (Million) Forecast, by Application 2019 & 2032
- Table 6: Canada Measurement While Drilling Industry Revenue (Million) Forecast, by Application 2019 & 2032
- Table 7: Mexico Measurement While Drilling Industry Revenue (Million) Forecast, by Application 2019 & 2032
- Table 8: Global Measurement While Drilling Industry Revenue Million Forecast, by Country 2019 & 2032
- Table 9: Germany Measurement While Drilling Industry Revenue (Million) Forecast, by Application 2019 & 2032
- Table 10: United Kingdom Measurement While Drilling Industry Revenue (Million) Forecast, by Application 2019 & 2032
- Table 11: France Measurement While Drilling Industry Revenue (Million) Forecast, by Application 2019 & 2032
- Table 12: Spain Measurement While Drilling Industry Revenue (Million) Forecast, by Application 2019 & 2032
- Table 13: Italy Measurement While Drilling Industry Revenue (Million) Forecast, by Application 2019 & 2032
- Table 14: Spain Measurement While Drilling Industry Revenue (Million) Forecast, by Application 2019 & 2032
- Table 15: Belgium Measurement While Drilling Industry Revenue (Million) Forecast, by Application 2019 & 2032
- Table 16: Netherland Measurement While Drilling Industry Revenue (Million) Forecast, by Application 2019 & 2032
- Table 17: Nordics Measurement While Drilling Industry Revenue (Million) Forecast, by Application 2019 & 2032
- Table 18: Rest of Europe Measurement While Drilling Industry Revenue (Million) Forecast, by Application 2019 & 2032
- Table 19: Global Measurement While Drilling Industry Revenue Million Forecast, by Country 2019 & 2032
- Table 20: China Measurement While Drilling Industry Revenue (Million) Forecast, by Application 2019 & 2032
- Table 21: Japan Measurement While Drilling Industry Revenue (Million) Forecast, by Application 2019 & 2032
- Table 22: India Measurement While Drilling Industry Revenue (Million) Forecast, by Application 2019 & 2032
- Table 23: South Korea Measurement While Drilling Industry Revenue (Million) Forecast, by Application 2019 & 2032
- Table 24: Southeast Asia Measurement While Drilling Industry Revenue (Million) Forecast, by Application 2019 & 2032
- Table 25: Australia Measurement While Drilling Industry Revenue (Million) Forecast, by Application 2019 & 2032
- Table 26: Indonesia Measurement While Drilling Industry Revenue (Million) Forecast, by Application 2019 & 2032
- Table 27: Phillipes Measurement While Drilling Industry Revenue (Million) Forecast, by Application 2019 & 2032
- Table 28: Singapore Measurement While Drilling Industry Revenue (Million) Forecast, by Application 2019 & 2032
- Table 29: Thailandc Measurement While Drilling Industry Revenue (Million) Forecast, by Application 2019 & 2032
- Table 30: Rest of Asia Pacific Measurement While Drilling Industry Revenue (Million) Forecast, by Application 2019 & 2032
- Table 31: Global Measurement While Drilling Industry Revenue Million Forecast, by Country 2019 & 2032
- Table 32: Brazil Measurement While Drilling Industry Revenue (Million) Forecast, by Application 2019 & 2032
- Table 33: Argentina Measurement While Drilling Industry Revenue (Million) Forecast, by Application 2019 & 2032
- Table 34: Peru Measurement While Drilling Industry Revenue (Million) Forecast, by Application 2019 & 2032
- Table 35: Chile Measurement While Drilling Industry Revenue (Million) Forecast, by Application 2019 & 2032
- Table 36: Colombia Measurement While Drilling Industry Revenue (Million) Forecast, by Application 2019 & 2032
- Table 37: Ecuador Measurement While Drilling Industry Revenue (Million) Forecast, by Application 2019 & 2032
- Table 38: Venezuela Measurement While Drilling Industry Revenue (Million) Forecast, by Application 2019 & 2032
- Table 39: Rest of South America Measurement While Drilling Industry Revenue (Million) Forecast, by Application 2019 & 2032
- Table 40: Global Measurement While Drilling Industry Revenue Million Forecast, by Country 2019 & 2032
- Table 41: United States Measurement While Drilling Industry Revenue (Million) Forecast, by Application 2019 & 2032
- Table 42: Canada Measurement While Drilling Industry Revenue (Million) Forecast, by Application 2019 & 2032
- Table 43: Mexico Measurement While Drilling Industry Revenue (Million) Forecast, by Application 2019 & 2032
- Table 44: Global Measurement While Drilling Industry Revenue Million Forecast, by Country 2019 & 2032
- Table 45: United Arab Emirates Measurement While Drilling Industry Revenue (Million) Forecast, by Application 2019 & 2032
- Table 46: Saudi Arabia Measurement While Drilling Industry Revenue (Million) Forecast, by Application 2019 & 2032
- Table 47: South Africa Measurement While Drilling Industry Revenue (Million) Forecast, by Application 2019 & 2032
- Table 48: Rest of Middle East and Africa Measurement While Drilling Industry Revenue (Million) Forecast, by Application 2019 & 2032
- Table 49: Global Measurement While Drilling Industry Revenue Million Forecast, by Location of Deployment 2019 & 2032
- Table 50: Global Measurement While Drilling Industry Revenue Million Forecast, by Country 2019 & 2032
- Table 51: Global Measurement While Drilling Industry Revenue Million Forecast, by Location of Deployment 2019 & 2032
- Table 52: Global Measurement While Drilling Industry Revenue Million Forecast, by Country 2019 & 2032
- Table 53: Global Measurement While Drilling Industry Revenue Million Forecast, by Location of Deployment 2019 & 2032
- Table 54: Global Measurement While Drilling Industry Revenue Million Forecast, by Country 2019 & 2032
- Table 55: Global Measurement While Drilling Industry Revenue Million Forecast, by Location of Deployment 2019 & 2032
- Table 56: Global Measurement While Drilling Industry Revenue Million Forecast, by Country 2019 & 2032
- Table 57: Global Measurement While Drilling Industry Revenue Million Forecast, by Location of Deployment 2019 & 2032
- Table 58: Global Measurement While Drilling Industry Revenue Million Forecast, by Country 2019 & 2032
Frequently Asked Questions
1. What is the projected Compound Annual Growth Rate (CAGR) of the Measurement While Drilling Industry?
The projected CAGR is approximately > 7.00%.
2. Which companies are prominent players in the Measurement While Drilling Industry?
Key companies in the market include Weatherford International Ltd*List Not Exhaustive, Calmena Energy Services Inc, Baker Hughes Co, National Oil Well Varco Inc, Schlumberger Ltd, Gyrodata Inc, China Oilfield Services Limited, Halliburton Company, Nabors Industries Limited, Scientific Drilling International Inc.
3. What are the main segments of the Measurement While Drilling Industry?
The market segments include Location of Deployment.
4. Can you provide details about the market size?
The market size is estimated to be USD XX Million as of 2022.
5. What are some drivers contributing to market growth?
4.; Presence of Strict Government Regulations to Control Air Pollution.
6. What are the notable trends driving market growth?
Offshore Oil and Gas to Dominate the Market.
7. Are there any restraints impacting market growth?
4.; Increasing Adoption of Renewable Energy.
8. Can you provide examples of recent developments in the market?
N/A
9. What pricing options are available for accessing the report?
Pricing options include single-user, multi-user, and enterprise licenses priced at USD 4750, USD 5250, and USD 8750 respectively.
10. Is the market size provided in terms of value or volume?
The market size is provided in terms of value, measured in Million.
11. Are there any specific market keywords associated with the report?
Yes, the market keyword associated with the report is "Measurement While Drilling Industry," which aids in identifying and referencing the specific market segment covered.
12. How do I determine which pricing option suits my needs best?
The pricing options vary based on user requirements and access needs. Individual users may opt for single-user licenses, while businesses requiring broader access may choose multi-user or enterprise licenses for cost-effective access to the report.
13. Are there any additional resources or data provided in the Measurement While Drilling Industry report?
While the report offers comprehensive insights, it's advisable to review the specific contents or supplementary materials provided to ascertain if additional resources or data are available.
14. How can I stay updated on further developments or reports in the Measurement While Drilling Industry?
To stay informed about further developments, trends, and reports in the Measurement While Drilling Industry, consider subscribing to industry newsletters, following relevant companies and organizations, or regularly checking reputable industry news sources and publications.
Methodology
Step 1 - Identification of Relevant Samples Size from Population Database


Step 2 - Approaches for Defining Global Market Size (Value, Volume* & Price*)

Note*: In applicable scenarios
Step 3 - Data Sources
Primary Research
- Web Analytics
- Survey Reports
- Research Institute
- Latest Research Reports
- Opinion Leaders
Secondary Research
- Annual Reports
- White Paper
- Latest Press Release
- Industry Association
- Paid Database
- Investor Presentations

Step 4 - Data Triangulation
Involves using different sources of information in order to increase the validity of a study
These sources are likely to be stakeholders in a program - participants, other researchers, program staff, other community members, and so on.
Then we put all data in single framework & apply various statistical tools to find out the dynamic on the market.
During the analysis stage, feedback from the stakeholder groups would be compared to determine areas of agreement as well as areas of divergence


