

Key Insights
The Middle East and Africa (MEA) travel retail market is poised for significant expansion, projected to achieve a Compound Annual Growth Rate (CAGR) of 5.4% between 2025 and 2033. This growth is propelled by rising air passenger traffic, driven by increasing disposable incomes and expanding tourism within the region. The growing middle class in MEA countries is a key demographic, contributing to higher spending on luxury goods and travel experiences. Strategic investments by key industry players, such as Dufry AG and Lagardere Travel Retail, in enhancing airport retail infrastructure and offerings are further fueling market dynamism. Innovations in product selection, personalized shopping experiences, and the increasing adoption of digital commerce and payment solutions are also key drivers of expansion.
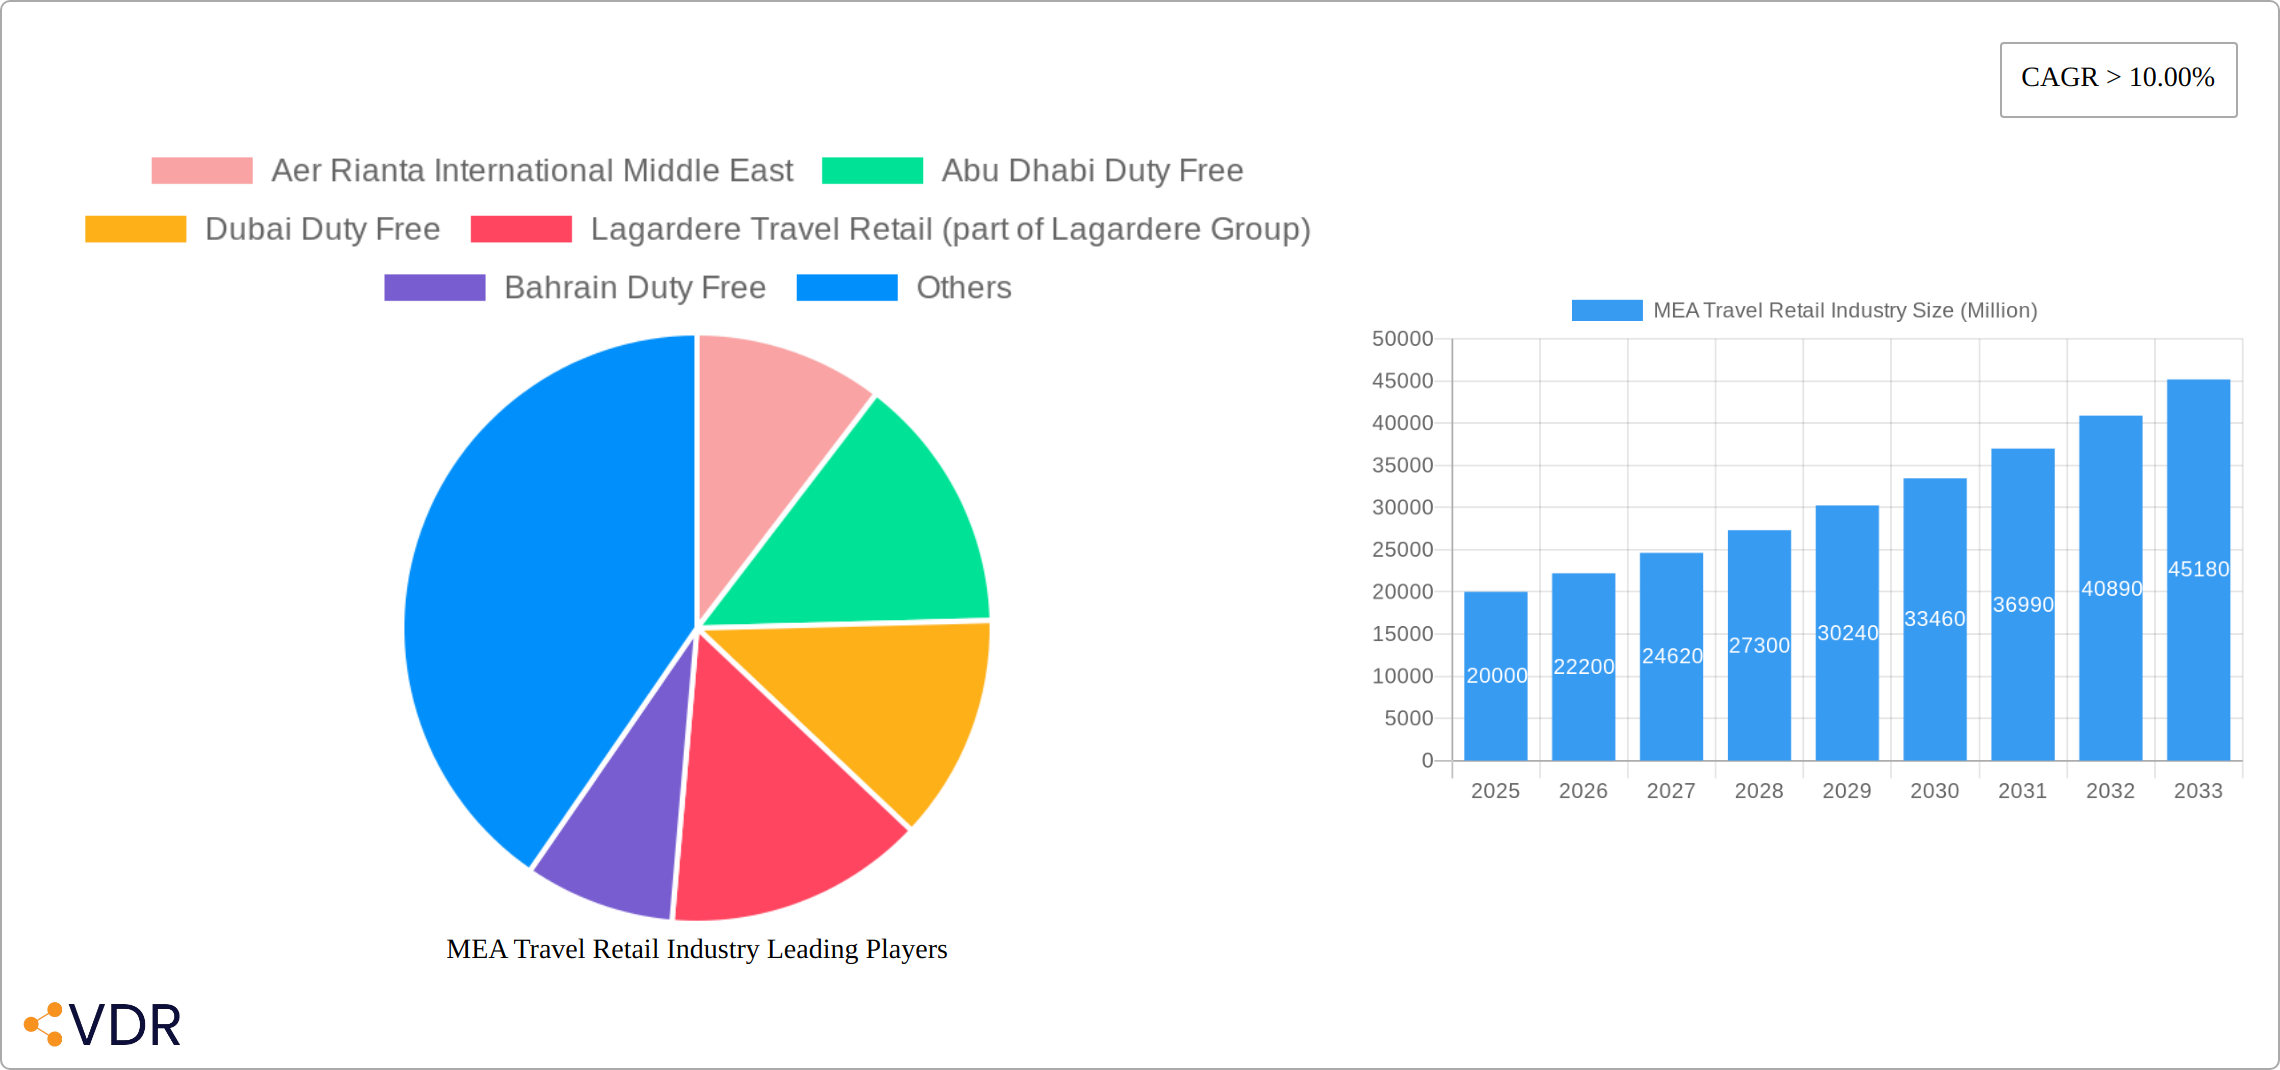
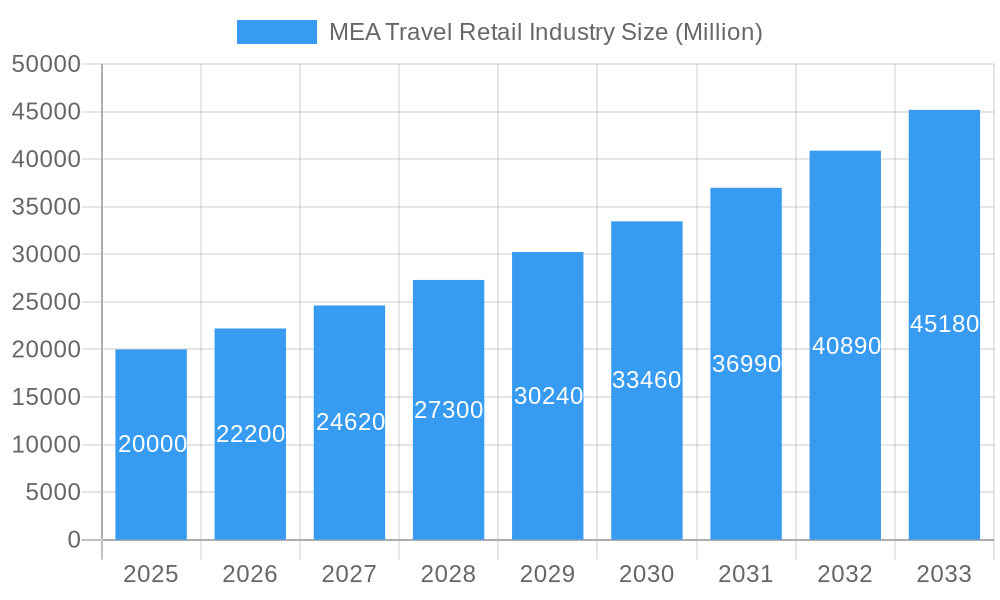
MEA Travel Retail Industry Market Size (In Billion)
However, the market faces challenges including geopolitical instability in select regions, currency exchange rate fluctuations, and potential economic downturns. The market is segmented by product categories, including perfumes, cosmetics, liquor, and confectionery, and by airport type, distinguishing between major hub airports and smaller regional facilities. Intense competition among established players like Dubai Duty Free, Abu Dhabi Duty Free, and international brands necessitates continuous innovation and strategic partnerships to secure market share.
MEA Travel Retail Industry Company Market Share
The long-term outlook for the MEA travel retail market remains robust, presenting substantial opportunities for both established and emerging businesses. Successful strategies will prioritize adaptation to evolving consumer preferences, leveraging technology for enhanced customer engagement, and adept navigation of the geopolitical landscape. Effective supply chain management and portfolio diversification are crucial for sustained success in this dynamic market. Continued development of regional tourism infrastructure and improved connectivity will further accelerate industry growth, fostering a lucrative business environment. The market size for 2025 is estimated at $72.57 billion.
MEA Travel Retail Industry Market Report: 2019-2033
This comprehensive report provides a detailed analysis of the Middle East and Africa (MEA) travel retail industry, offering invaluable insights for industry professionals, investors, and strategic planners. Covering the historical period (2019-2024), base year (2025), and forecast period (2025-2033), this report leverages extensive data and expert analysis to illuminate market dynamics, growth trends, and future opportunities within this dynamic sector. The report focuses on key segments, including duty-free shops and airport retail, with specific attention to parent markets (airport retail) and child markets (luxury goods, cosmetics & perfumes). The total market value is expected to reach xx Million by 2033.
Keywords: MEA Travel Retail, Duty Free, Airport Retail, Travel Retail Market, Middle East Africa, Dubai Duty Free, Abu Dhabi Duty Free, Dufry AG, Lagardere Travel Retail, Market Size, Market Share, CAGR, Growth Opportunities, Market Analysis, Industry Trends, Consumer Behavior, Competitive Landscape, M&A, Industry Development, Product Landscape.
MEA Travel Retail Industry Market Dynamics & Structure
The Middle East and Africa (MEA) travel retail market presents a dynamic landscape characterized by moderate concentration, with key players like Dubai Duty Free and Dufry AG holding substantial market share. This sector is undergoing a significant transformation driven by rapid technological advancements in e-commerce, personalized shopping experiences, and sophisticated data analytics. However, navigating the diverse regulatory frameworks across MEA nations presents a key challenge, influencing market access and operational consistency. Furthermore, the industry faces increasing competition from alternative retail channels, including the ever-expanding online shopping landscape and established domestic retailers. The evolving demographics of the MEA region, featuring a burgeoning young, affluent population, are significantly shaping consumer preferences and spending patterns, driving demand for luxury goods and premium experiences. Mergers and acquisitions (M&A) activity has remained robust in recent years, resulting in several significant deals that have reshaped the competitive landscape. The total market value is projected to reach [Insert Updated Market Value] by 2025.
- Market Concentration: Dubai Duty Free and Dufry AG maintain a significant market share, estimated at [Insert Updated Percentage]%.
- Technological Innovation: The adoption of mobile payment systems and personalized shopping experiences through dedicated apps are pivotal growth drivers. However, challenges remain, including upgrading legacy infrastructure and addressing data privacy concerns.
- Regulatory Framework: The inconsistencies in regulations across different MEA countries create complexities for seamless operations and expansion strategies.
- Competitive Substitutes: The competitive pressure from online retail channels and established domestic retailers is steadily intensifying.
- End-User Demographics: A rapidly expanding middle class and a young, affluent demographic are fueling the demand for luxury and premium goods.
- M&A Trends: Over the past five years, [Insert Updated Number] major M&A deals have been recorded, with an average deal value of [Insert Updated Average Deal Value] Million.
MEA Travel Retail Industry Growth Trends & Insights
The MEA travel retail market demonstrated robust growth during the period 2019-2024, achieving a Compound Annual Growth Rate (CAGR) of [Insert Updated CAGR]%. This growth trajectory was primarily fueled by increased air passenger traffic, rising disposable incomes, and the flourishing tourism sector within several MEA countries. The COVID-19 pandemic, however, significantly impacted the industry in 2020 and 2021, leading to a temporary decline in sales. Despite this disruption, the market is poised for a strong recovery, driven by the resurgence of air travel and a renewed focus on delivering elevated and engaging shopping experiences. The adoption of digital technologies is accelerating at a rapid pace, enabling personalized marketing campaigns, targeted promotions, and more effective customer engagement strategies. Furthermore, consumer behavior is undergoing a shift towards experiential retail, with a heightened emphasis on premium brands and unique product offerings.
- Market Size Evolution: From [Insert Updated 2019 Value] Million in 2019 to a projected [Insert Updated 2025 Value] Million in 2025, showcasing a remarkable recovery post-pandemic.
- Adoption Rates: Digital technologies, encompassing mobile payment systems and omnichannel retail strategies, are experiencing rapid adoption.
- Technological Disruptions: AI-powered personalization and data analytics are fundamentally reshaping the customer journey.
- Consumer Behavior Shifts: A noticeable increase in the demand for premium products and personalized shopping experiences is observed.
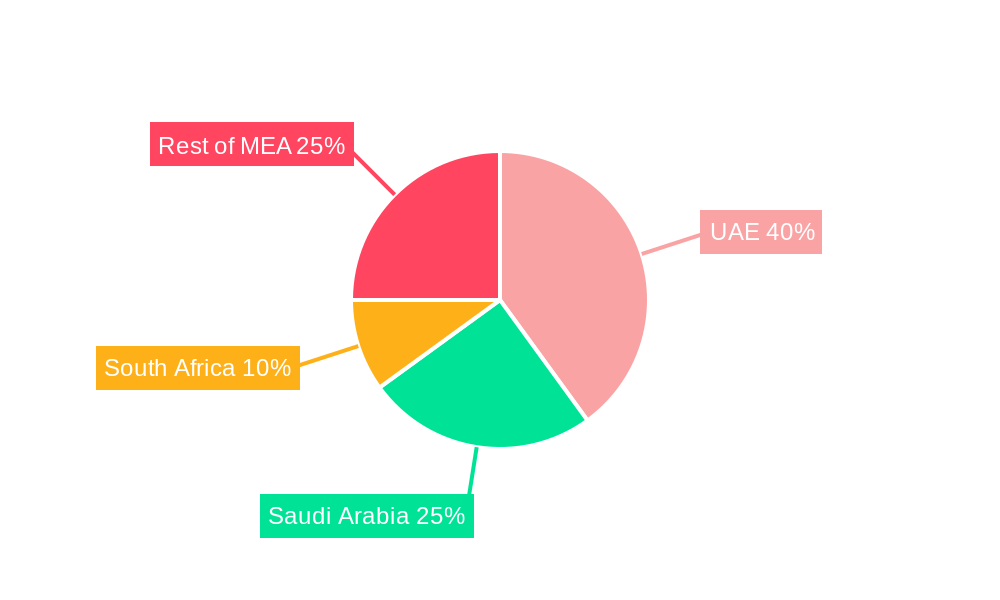
Dominant Regions, Countries, or Segments in MEA Travel Retail Industry
The United Arab Emirates (UAE), specifically Dubai and Abu Dhabi, dominate the MEA travel retail market, driven by the high volume of international air passengers passing through their major airports. These regions benefit from robust tourism infrastructure, favorable government policies, and a high concentration of luxury brands. Other key countries include Qatar, Saudi Arabia, and South Africa, which exhibit significant growth potential owing to increasing disposable incomes and infrastructural development. The luxury goods segment is a significant driver of market growth, followed by cosmetics & perfumes and spirits & tobacco.
- Key Drivers:
- UAE's strategic location and robust tourism industry: Strong air passenger traffic fuels high sales.
- Favorable government policies and infrastructure investments: Ease of doing business and airport developments.
- High concentration of luxury brands: Caters to affluent travellers’ preferences.
- Dominance Factors:
- Market Share: The UAE holds xx% of the total MEA market share, exceeding other regions significantly.
- Growth Potential: Ongoing investments in airports and tourism are expected to accelerate market expansion.
MEA Travel Retail Industry Product Landscape
The MEA travel retail industry boasts a diverse product portfolio, encompassing luxury goods, cosmetics and perfumes, spirits and tobacco, confectionery, and other travel essentials. Product innovation is a key focus, with an emphasis on creating unique and exclusive offerings through strategic collaborations with renowned brands to cater to the discerning preferences of travelers. Technological advancements, including augmented reality (AR) and virtual reality (VR), are being integrated to enhance the overall shopping experience. Key performance indicators (KPIs) used to gauge success include sales per square foot, conversion rates, and customer satisfaction scores.
Key Drivers, Barriers & Challenges in MEA Travel Retail Industry
Key Drivers:
- Growing air passenger traffic in the region.
- Increased disposable incomes and tourism.
- Expansion of airport infrastructure.
Challenges & Restraints:
- Fluctuations in currency exchange rates impact profitability.
- Regulatory changes and compliance costs.
- Intense competition from established players and new entrants.
Emerging Opportunities in MEA Travel Retail Industry
- Expansion into untapped markets within the MEA region.
- Leveraging digital technologies for personalized marketing.
- Development of sustainable and ethically sourced products.
Growth Accelerators in the MEA Travel Retail Industry
Strategic partnerships between retailers and brands will drive growth, alongside investments in enhancing the customer experience through technology and omnichannel strategies.
Key Players Shaping the MEA Travel Retail Industry Market
- Aer Rianta International Middle East
- Abu Dhabi Duty Free
- Dubai Duty Free
- Lagardere Travel Retail (part of Lagardere Group)
- Bahrain Duty Free
- Beirut Duty Free
- Big Five Duty Free Stores
- Hamila Duty Free
- Kreol Travel Retail
- Pernod Ricard Global Travel Retail
- Dufry AG
- EgyptAir for Tourism (El Karnak) and Duty Free Shops Company (EADFS)
Notable Milestones in MEA Travel Retail Industry Sector
- June 2021: Leading French luxury brand Louis Vuitton announced plans to open a boutique at Dubai International (DXB) in partnership with Dubai Duty-Free, highlighting the increasing importance of luxury brands within the MEA travel retail sector.
- June 2021: Dubai Duty Free launched the "Plant a Tree, Plant A Legacy" initiative, showcasing a commitment to environmental sustainability and reflecting the growing consumer demand for responsible and ethical brands. This initiative underlines the increasing importance of Corporate Social Responsibility (CSR) in the MEA travel retail sector.
- [Add other notable milestones with dates and brief descriptions. Include details of significant partnerships, new technologies implemented, or major industry awards. ]
In-Depth MEA Travel Retail Industry Market Outlook
The MEA travel retail market is poised for continued growth, driven by increasing air passenger traffic, rising disposable incomes, and the expansion of airport infrastructure. Strategic partnerships, technological innovation, and a focus on personalized customer experiences will be key to unlocking future market potential. The focus on sustainability and ethical practices will also significantly shape the future landscape of the industry.
MEA Travel Retail Industry Segmentation
-
1. Product Type
- 1.1. Fashion and Accessories
- 1.2. Jewellery and Watches
- 1.3. Wine and Spirits
- 1.4. Food and Confectionary
- 1.5. Fragnances and Cosmetics
- 1.6. Tobacco
- 1.7. Others (Stationery, Electronics, etc.)
-
2. Distribution Channel
- 2.1. Airports
- 2.2. Airlines
- 2.3. Ferries
- 2.4. Others (Railway Stations, Border, Downtown)
-
3. Geography
- 3.1. United Arab Emirates
- 3.2. Saudi Arabia
- 3.3. South Africa
- 3.4. Rest of Middle East and Africa
MEA Travel Retail Industry Segmentation By Geography
- 1. United Arab Emirates
- 2. Saudi Arabia
- 3. South Africa
- 4. Rest of Middle East and Africa
MEA Travel Retail Industry Regional Market Share
Geographic Coverage of MEA Travel Retail Industry
MEA Travel Retail Industry REPORT HIGHLIGHTS
| Aspects | Details |
|---|---|
| Study Period | 2020-2034 |
| Base Year | 2025 |
| Estimated Year | 2026 |
| Forecast Period | 2026-2034 |
| Historical Period | 2020-2025 |
| Growth Rate | CAGR of 5.4% from 2020-2034 |
| Segmentation |
|
Table of Contents
- 1. Introduction
- 1.1. Research Scope
- 1.2. Market Segmentation
- 1.3. Research Objective
- 1.4. Definitions and Assumptions
- 2. Executive Summary
- 2.1. Market Snapshot
- 3. Market Dynamics
- 3.1. Market Drivers
- 3.2. Market Restrains
- 3.3. Market Trends
- 3.4. Market Opportunities
- 4. Market Factor Analysis
- 4.1. Porters Five Forces
- 4.1.1. Bargaining Power of Suppliers
- 4.1.2. Bargaining Power of Buyers
- 4.1.3. Threat of New Entrants
- 4.1.4. Threat of Substitutes
- 4.1.5. Competitive Rivalry
- 4.2. PESTEL analysis
- 4.3. BCG Analysis
- 4.3.1. Stars (High Growth, High Market Share)
- 4.3.2. Cash Cows (Low Growth, High Market Share)
- 4.3.3. Question Mark (High Growth, Low Market Share)
- 4.3.4. Dogs (Low Growth, Low Market Share)
- 4.4. Ansoff Matrix Analysis
- 4.5. Supply Chain Analysis
- 4.6. Regulatory Landscape
- 4.7. Current Market Potential and Opportunity Assessment (TAM–SAM–SOM Framework)
- 4.8. VDR Analyst Note
- 4.1. Porters Five Forces
- 5. Market Analysis, Insights and Forecast 2021-2033
- 5.1. Market Analysis, Insights and Forecast - by Product Type
- 5.1.1. Fashion and Accessories
- 5.1.2. Jewellery and Watches
- 5.1.3. Wine and Spirits
- 5.1.4. Food and Confectionary
- 5.1.5. Fragnances and Cosmetics
- 5.1.6. Tobacco
- 5.1.7. Others (Stationery, Electronics, etc.)
- 5.2. Market Analysis, Insights and Forecast - by Distribution Channel
- 5.2.1. Airports
- 5.2.2. Airlines
- 5.2.3. Ferries
- 5.2.4. Others (Railway Stations, Border, Downtown)
- 5.3. Market Analysis, Insights and Forecast - by Geography
- 5.3.1. United Arab Emirates
- 5.3.2. Saudi Arabia
- 5.3.3. South Africa
- 5.3.4. Rest of Middle East and Africa
- 5.4. Market Analysis, Insights and Forecast - by Region
- 5.4.1. United Arab Emirates
- 5.4.2. Saudi Arabia
- 5.4.3. South Africa
- 5.4.4. Rest of Middle East and Africa
- 5.1. Market Analysis, Insights and Forecast - by Product Type
- 6. Global MEA Travel Retail Industry Analysis, Insights and Forecast, 2021-2033
- 6.1. Market Analysis, Insights and Forecast - by Product Type
- 6.1.1. Fashion and Accessories
- 6.1.2. Jewellery and Watches
- 6.1.3. Wine and Spirits
- 6.1.4. Food and Confectionary
- 6.1.5. Fragnances and Cosmetics
- 6.1.6. Tobacco
- 6.1.7. Others (Stationery, Electronics, etc.)
- 6.2. Market Analysis, Insights and Forecast - by Distribution Channel
- 6.2.1. Airports
- 6.2.2. Airlines
- 6.2.3. Ferries
- 6.2.4. Others (Railway Stations, Border, Downtown)
- 6.3. Market Analysis, Insights and Forecast - by Geography
- 6.3.1. United Arab Emirates
- 6.3.2. Saudi Arabia
- 6.3.3. South Africa
- 6.3.4. Rest of Middle East and Africa
- 6.1. Market Analysis, Insights and Forecast - by Product Type
- 7. United Arab Emirates MEA Travel Retail Industry Analysis, Insights and Forecast, 2021-2033
- 7.1. Market Analysis, Insights and Forecast - by Product Type
- 7.1.1. Fashion and Accessories
- 7.1.2. Jewellery and Watches
- 7.1.3. Wine and Spirits
- 7.1.4. Food and Confectionary
- 7.1.5. Fragnances and Cosmetics
- 7.1.6. Tobacco
- 7.1.7. Others (Stationery, Electronics, etc.)
- 7.2. Market Analysis, Insights and Forecast - by Distribution Channel
- 7.2.1. Airports
- 7.2.2. Airlines
- 7.2.3. Ferries
- 7.2.4. Others (Railway Stations, Border, Downtown)
- 7.3. Market Analysis, Insights and Forecast - by Geography
- 7.3.1. United Arab Emirates
- 7.3.2. Saudi Arabia
- 7.3.3. South Africa
- 7.3.4. Rest of Middle East and Africa
- 7.1. Market Analysis, Insights and Forecast - by Product Type
- 8. Saudi Arabia MEA Travel Retail Industry Analysis, Insights and Forecast, 2021-2033
- 8.1. Market Analysis, Insights and Forecast - by Product Type
- 8.1.1. Fashion and Accessories
- 8.1.2. Jewellery and Watches
- 8.1.3. Wine and Spirits
- 8.1.4. Food and Confectionary
- 8.1.5. Fragnances and Cosmetics
- 8.1.6. Tobacco
- 8.1.7. Others (Stationery, Electronics, etc.)
- 8.2. Market Analysis, Insights and Forecast - by Distribution Channel
- 8.2.1. Airports
- 8.2.2. Airlines
- 8.2.3. Ferries
- 8.2.4. Others (Railway Stations, Border, Downtown)
- 8.3. Market Analysis, Insights and Forecast - by Geography
- 8.3.1. United Arab Emirates
- 8.3.2. Saudi Arabia
- 8.3.3. South Africa
- 8.3.4. Rest of Middle East and Africa
- 8.1. Market Analysis, Insights and Forecast - by Product Type
- 9. South Africa MEA Travel Retail Industry Analysis, Insights and Forecast, 2021-2033
- 9.1. Market Analysis, Insights and Forecast - by Product Type
- 9.1.1. Fashion and Accessories
- 9.1.2. Jewellery and Watches
- 9.1.3. Wine and Spirits
- 9.1.4. Food and Confectionary
- 9.1.5. Fragnances and Cosmetics
- 9.1.6. Tobacco
- 9.1.7. Others (Stationery, Electronics, etc.)
- 9.2. Market Analysis, Insights and Forecast - by Distribution Channel
- 9.2.1. Airports
- 9.2.2. Airlines
- 9.2.3. Ferries
- 9.2.4. Others (Railway Stations, Border, Downtown)
- 9.3. Market Analysis, Insights and Forecast - by Geography
- 9.3.1. United Arab Emirates
- 9.3.2. Saudi Arabia
- 9.3.3. South Africa
- 9.3.4. Rest of Middle East and Africa
- 9.1. Market Analysis, Insights and Forecast - by Product Type
- 10. Rest of Middle East and Africa MEA Travel Retail Industry Analysis, Insights and Forecast, 2021-2033
- 10.1. Market Analysis, Insights and Forecast - by Product Type
- 10.1.1. Fashion and Accessories
- 10.1.2. Jewellery and Watches
- 10.1.3. Wine and Spirits
- 10.1.4. Food and Confectionary
- 10.1.5. Fragnances and Cosmetics
- 10.1.6. Tobacco
- 10.1.7. Others (Stationery, Electronics, etc.)
- 10.2. Market Analysis, Insights and Forecast - by Distribution Channel
- 10.2.1. Airports
- 10.2.2. Airlines
- 10.2.3. Ferries
- 10.2.4. Others (Railway Stations, Border, Downtown)
- 10.3. Market Analysis, Insights and Forecast - by Geography
- 10.3.1. United Arab Emirates
- 10.3.2. Saudi Arabia
- 10.3.3. South Africa
- 10.3.4. Rest of Middle East and Africa
- 10.1. Market Analysis, Insights and Forecast - by Product Type
- 11. Competitive Analysis
- 11.1. Company Profiles
- 11.1.1 Aer Rianta International Middle East
- 11.1.1.1. Company Overview
- 11.1.1.2. Products
- 11.1.1.3. Company Financials
- 11.1.1.4. SWOT Analysis
- 11.1.2 Abu Dhabi Duty Free
- 11.1.2.1. Company Overview
- 11.1.2.2. Products
- 11.1.2.3. Company Financials
- 11.1.2.4. SWOT Analysis
- 11.1.3 Dubai Duty Free
- 11.1.3.1. Company Overview
- 11.1.3.2. Products
- 11.1.3.3. Company Financials
- 11.1.3.4. SWOT Analysis
- 11.1.4 Lagardere Travel Retail (part of Lagardere Group)
- 11.1.4.1. Company Overview
- 11.1.4.2. Products
- 11.1.4.3. Company Financials
- 11.1.4.4. SWOT Analysis
- 11.1.5 Bahrain Duty Free
- 11.1.5.1. Company Overview
- 11.1.5.2. Products
- 11.1.5.3. Company Financials
- 11.1.5.4. SWOT Analysis
- 11.1.6 Beirut Duty Free
- 11.1.6.1. Company Overview
- 11.1.6.2. Products
- 11.1.6.3. Company Financials
- 11.1.6.4. SWOT Analysis
- 11.1.7 Big Five Duty Free Stores
- 11.1.7.1. Company Overview
- 11.1.7.2. Products
- 11.1.7.3. Company Financials
- 11.1.7.4. SWOT Analysis
- 11.1.8 Hamila Duty Free
- 11.1.8.1. Company Overview
- 11.1.8.2. Products
- 11.1.8.3. Company Financials
- 11.1.8.4. SWOT Analysis
- 11.1.9 Kreol Travel Retail
- 11.1.9.1. Company Overview
- 11.1.9.2. Products
- 11.1.9.3. Company Financials
- 11.1.9.4. SWOT Analysis
- 11.1.10 Pernod Ricard Global Travel Retail
- 11.1.10.1. Company Overview
- 11.1.10.2. Products
- 11.1.10.3. Company Financials
- 11.1.10.4. SWOT Analysis
- 11.1.11 Dufry AG
- 11.1.11.1. Company Overview
- 11.1.11.2. Products
- 11.1.11.3. Company Financials
- 11.1.11.4. SWOT Analysis
- 11.1.12 EgyptAir for Tourism (El Karnak) and Duty Free Shops Company (EADFS)**List Not Exhaustive
- 11.1.12.1. Company Overview
- 11.1.12.2. Products
- 11.1.12.3. Company Financials
- 11.1.12.4. SWOT Analysis
- 11.1.1 Aer Rianta International Middle East
- 11.2. Market Entropy
- 11.2.1 Company's Key Areas Served
- 11.2.2 Recent Developments
- 11.3. Company Market Share Analysis 2025
- 11.3.1 Top 5 Companies Market Share Analysis
- 11.3.2 Top 3 Companies Market Share Analysis
- 11.4. List of Potential Customers
- 12. Research Methodology
List of Figures
- Figure 1: Global MEA Travel Retail Industry Revenue Breakdown (billion, %) by Region 2025 & 2033
- Figure 2: United Arab Emirates MEA Travel Retail Industry Revenue (billion), by Product Type 2025 & 2033
- Figure 3: United Arab Emirates MEA Travel Retail Industry Revenue Share (%), by Product Type 2025 & 2033
- Figure 4: United Arab Emirates MEA Travel Retail Industry Revenue (billion), by Distribution Channel 2025 & 2033
- Figure 5: United Arab Emirates MEA Travel Retail Industry Revenue Share (%), by Distribution Channel 2025 & 2033
- Figure 6: United Arab Emirates MEA Travel Retail Industry Revenue (billion), by Geography 2025 & 2033
- Figure 7: United Arab Emirates MEA Travel Retail Industry Revenue Share (%), by Geography 2025 & 2033
- Figure 8: United Arab Emirates MEA Travel Retail Industry Revenue (billion), by Country 2025 & 2033
- Figure 9: United Arab Emirates MEA Travel Retail Industry Revenue Share (%), by Country 2025 & 2033
- Figure 10: Saudi Arabia MEA Travel Retail Industry Revenue (billion), by Product Type 2025 & 2033
- Figure 11: Saudi Arabia MEA Travel Retail Industry Revenue Share (%), by Product Type 2025 & 2033
- Figure 12: Saudi Arabia MEA Travel Retail Industry Revenue (billion), by Distribution Channel 2025 & 2033
- Figure 13: Saudi Arabia MEA Travel Retail Industry Revenue Share (%), by Distribution Channel 2025 & 2033
- Figure 14: Saudi Arabia MEA Travel Retail Industry Revenue (billion), by Geography 2025 & 2033
- Figure 15: Saudi Arabia MEA Travel Retail Industry Revenue Share (%), by Geography 2025 & 2033
- Figure 16: Saudi Arabia MEA Travel Retail Industry Revenue (billion), by Country 2025 & 2033
- Figure 17: Saudi Arabia MEA Travel Retail Industry Revenue Share (%), by Country 2025 & 2033
- Figure 18: South Africa MEA Travel Retail Industry Revenue (billion), by Product Type 2025 & 2033
- Figure 19: South Africa MEA Travel Retail Industry Revenue Share (%), by Product Type 2025 & 2033
- Figure 20: South Africa MEA Travel Retail Industry Revenue (billion), by Distribution Channel 2025 & 2033
- Figure 21: South Africa MEA Travel Retail Industry Revenue Share (%), by Distribution Channel 2025 & 2033
- Figure 22: South Africa MEA Travel Retail Industry Revenue (billion), by Geography 2025 & 2033
- Figure 23: South Africa MEA Travel Retail Industry Revenue Share (%), by Geography 2025 & 2033
- Figure 24: South Africa MEA Travel Retail Industry Revenue (billion), by Country 2025 & 2033
- Figure 25: South Africa MEA Travel Retail Industry Revenue Share (%), by Country 2025 & 2033
- Figure 26: Rest of Middle East and Africa MEA Travel Retail Industry Revenue (billion), by Product Type 2025 & 2033
- Figure 27: Rest of Middle East and Africa MEA Travel Retail Industry Revenue Share (%), by Product Type 2025 & 2033
- Figure 28: Rest of Middle East and Africa MEA Travel Retail Industry Revenue (billion), by Distribution Channel 2025 & 2033
- Figure 29: Rest of Middle East and Africa MEA Travel Retail Industry Revenue Share (%), by Distribution Channel 2025 & 2033
- Figure 30: Rest of Middle East and Africa MEA Travel Retail Industry Revenue (billion), by Geography 2025 & 2033
- Figure 31: Rest of Middle East and Africa MEA Travel Retail Industry Revenue Share (%), by Geography 2025 & 2033
- Figure 32: Rest of Middle East and Africa MEA Travel Retail Industry Revenue (billion), by Country 2025 & 2033
- Figure 33: Rest of Middle East and Africa MEA Travel Retail Industry Revenue Share (%), by Country 2025 & 2033
List of Tables
- Table 1: Global MEA Travel Retail Industry Revenue billion Forecast, by Product Type 2020 & 2033
- Table 2: Global MEA Travel Retail Industry Revenue billion Forecast, by Distribution Channel 2020 & 2033
- Table 3: Global MEA Travel Retail Industry Revenue billion Forecast, by Geography 2020 & 2033
- Table 4: Global MEA Travel Retail Industry Revenue billion Forecast, by Region 2020 & 2033
- Table 5: Global MEA Travel Retail Industry Revenue billion Forecast, by Product Type 2020 & 2033
- Table 6: Global MEA Travel Retail Industry Revenue billion Forecast, by Distribution Channel 2020 & 2033
- Table 7: Global MEA Travel Retail Industry Revenue billion Forecast, by Geography 2020 & 2033
- Table 8: Global MEA Travel Retail Industry Revenue billion Forecast, by Country 2020 & 2033
- Table 9: Global MEA Travel Retail Industry Revenue billion Forecast, by Product Type 2020 & 2033
- Table 10: Global MEA Travel Retail Industry Revenue billion Forecast, by Distribution Channel 2020 & 2033
- Table 11: Global MEA Travel Retail Industry Revenue billion Forecast, by Geography 2020 & 2033
- Table 12: Global MEA Travel Retail Industry Revenue billion Forecast, by Country 2020 & 2033
- Table 13: Global MEA Travel Retail Industry Revenue billion Forecast, by Product Type 2020 & 2033
- Table 14: Global MEA Travel Retail Industry Revenue billion Forecast, by Distribution Channel 2020 & 2033
- Table 15: Global MEA Travel Retail Industry Revenue billion Forecast, by Geography 2020 & 2033
- Table 16: Global MEA Travel Retail Industry Revenue billion Forecast, by Country 2020 & 2033
- Table 17: Global MEA Travel Retail Industry Revenue billion Forecast, by Product Type 2020 & 2033
- Table 18: Global MEA Travel Retail Industry Revenue billion Forecast, by Distribution Channel 2020 & 2033
- Table 19: Global MEA Travel Retail Industry Revenue billion Forecast, by Geography 2020 & 2033
- Table 20: Global MEA Travel Retail Industry Revenue billion Forecast, by Country 2020 & 2033
Frequently Asked Questions
1. What is the projected Compound Annual Growth Rate (CAGR) of the MEA Travel Retail Industry?
The projected CAGR is approximately 5.4%.
2. Which companies are prominent players in the MEA Travel Retail Industry?
Key companies in the market include Aer Rianta International Middle East, Abu Dhabi Duty Free, Dubai Duty Free, Lagardere Travel Retail (part of Lagardere Group), Bahrain Duty Free, Beirut Duty Free, Big Five Duty Free Stores, Hamila Duty Free, Kreol Travel Retail, Pernod Ricard Global Travel Retail, Dufry AG, EgyptAir for Tourism (El Karnak) and Duty Free Shops Company (EADFS)**List Not Exhaustive.
3. What are the main segments of the MEA Travel Retail Industry?
The market segments include Product Type, Distribution Channel, Geography.
4. Can you provide details about the market size?
The market size is estimated to be USD 72.57 billion as of 2022.
5. What are some drivers contributing to market growth?
N/A
6. What are the notable trends driving market growth?
The UAE has been Playing a Key Role in Attracting More Customers and thus Recording Year-on-Year Revenues.
7. Are there any restraints impacting market growth?
N/A
8. Can you provide examples of recent developments in the market?
June 2021, Leading French luxury brand Louis Vuitton announced plans to open a boutique at Dubai International (DXB) by the end of 2021 in partnership with Dubai Duty-Free.
9. What pricing options are available for accessing the report?
Pricing options include single-user, multi-user, and enterprise licenses priced at USD 4750, USD 5250, and USD 8750 respectively.
10. Is the market size provided in terms of value or volume?
The market size is provided in terms of value, measured in billion.
11. Are there any specific market keywords associated with the report?
Yes, the market keyword associated with the report is "MEA Travel Retail Industry," which aids in identifying and referencing the specific market segment covered.
12. How do I determine which pricing option suits my needs best?
The pricing options vary based on user requirements and access needs. Individual users may opt for single-user licenses, while businesses requiring broader access may choose multi-user or enterprise licenses for cost-effective access to the report.
13. Are there any additional resources or data provided in the MEA Travel Retail Industry report?
While the report offers comprehensive insights, it's advisable to review the specific contents or supplementary materials provided to ascertain if additional resources or data are available.
14. How can I stay updated on further developments or reports in the MEA Travel Retail Industry?
To stay informed about further developments, trends, and reports in the MEA Travel Retail Industry, consider subscribing to industry newsletters, following relevant companies and organizations, or regularly checking reputable industry news sources and publications.
Methodology
Step 1 - Identification of Relevant Samples Size from Population Database


Step 2 - Approaches for Defining Global Market Size (Value, Volume* & Price*)

Note*: In applicable scenarios
Step 3 - Data Sources
Primary Research
- Web Analytics
- Survey Reports
- Research Institute
- Latest Research Reports
- Opinion Leaders
Secondary Research
- Annual Reports
- White Paper
- Latest Press Release
- Industry Association
- Paid Database
- Investor Presentations

Step 4 - Data Triangulation
Involves using different sources of information in order to increase the validity of a study
These sources are likely to be stakeholders in a program - participants, other researchers, program staff, other community members, and so on.
Then we put all data in single framework & apply various statistical tools to find out the dynamic on the market.
During the analysis stage, feedback from the stakeholder groups would be compared to determine areas of agreement as well as areas of divergence