
Key Insights
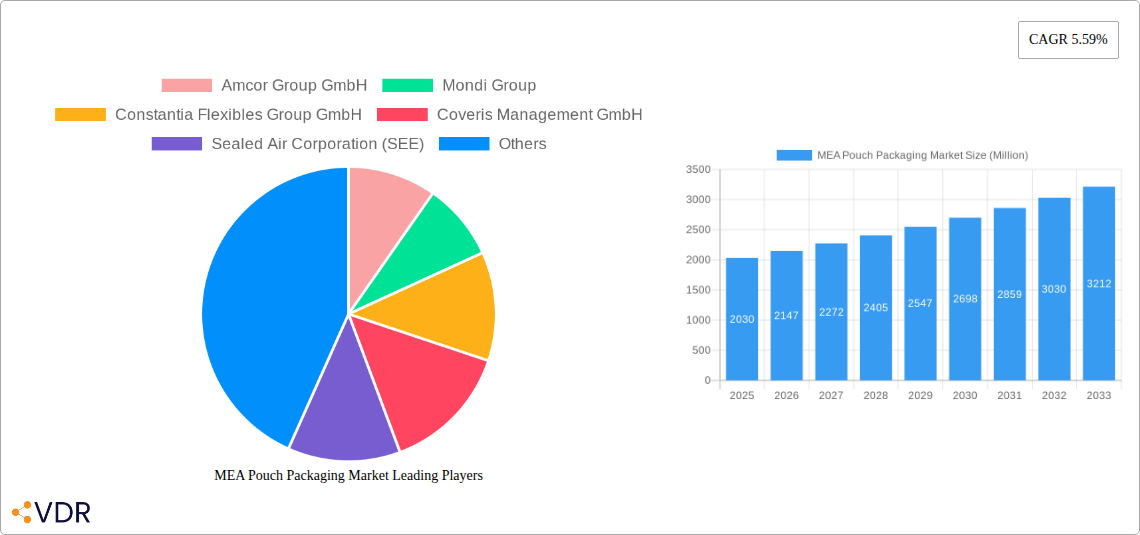
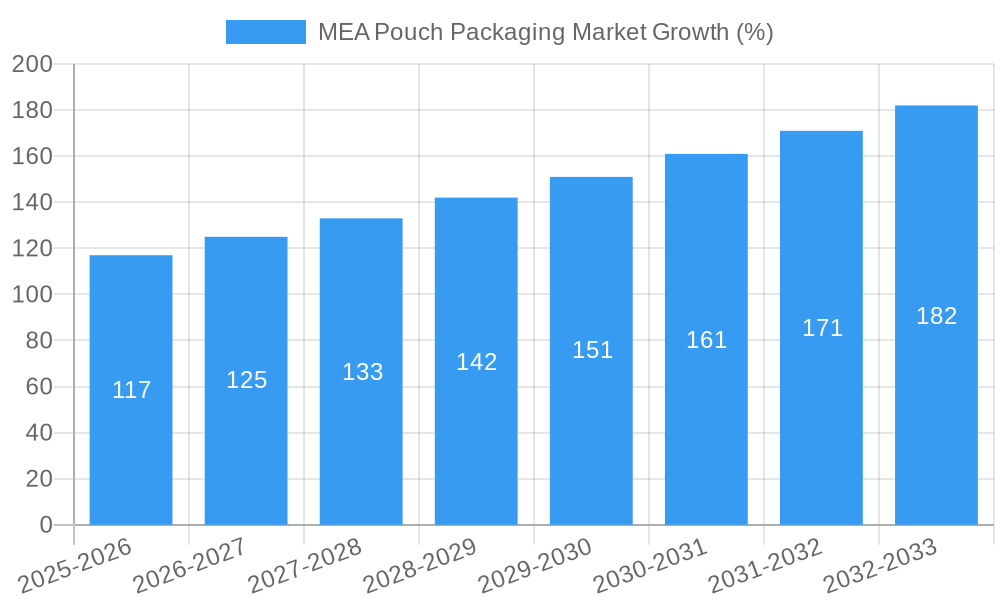
The MEA (Middle East and Africa) pouch packaging market, valued at approximately $2.03 billion in 2025, is poised for significant growth, exhibiting a Compound Annual Growth Rate (CAGR) of 5.59% from 2025 to 2033. This expansion is driven by several key factors. The rising popularity of flexible packaging formats, owing to their lightweight nature, cost-effectiveness, and improved product preservation, is a major catalyst. Furthermore, the increasing demand for convenient and ready-to-eat food products, particularly in urban areas across the MEA region, fuels the growth of pouch packaging. The booming e-commerce sector also contributes significantly, as pouches are ideal for online grocery delivery, requiring less packaging material and offering greater protection during transit. Growth within specific segments like stand-up pouches, spouted pouches, and retort pouches for food and beverage applications is particularly notable. Finally, advancements in flexible packaging technologies, such as barrier films and sustainable materials, are further stimulating market expansion.
However, certain challenges restrain market growth. Fluctuations in raw material prices, particularly polymers, pose a significant threat to profitability. Furthermore, concerns surrounding the environmental impact of plastic packaging are leading to increased demand for sustainable alternatives, requiring manufacturers to invest in eco-friendly solutions. Competitive pressures from established players like Amcor, Mondi, and Constantia Flexibles, coupled with the emergence of new local players, create a dynamic and competitive landscape. Despite these challenges, the overall outlook for the MEA pouch packaging market remains positive, with considerable potential for growth driven by evolving consumer preferences and industry innovations. The market is expected to experience substantial expansion across various segments and geographic locations within the MEA region over the forecast period.
MEA Pouch Packaging Market: A Comprehensive Market Report (2019-2033)
This in-depth report provides a comprehensive analysis of the Middle East and Africa (MEA) pouch packaging market, offering invaluable insights for industry professionals, investors, and strategic decision-makers. The report covers the period 2019-2033, with a focus on the forecast period 2025-2033 and a base year of 2025. The market is segmented by various factors, allowing for granular analysis and identification of key growth areas. The total market size is projected to reach xx Million units by 2033.
MEA Pouch Packaging Market Dynamics & Structure
This section delves into the intricate dynamics shaping the MEA pouch packaging market. We analyze market concentration, revealing the share held by major players and identifying emerging competitors. Technological innovation, driven by advancements in materials science and automation, is examined alongside the impact of regulatory frameworks and the presence of competitive product substitutes. The report also explores end-user demographics, pinpointing key industries driving demand and analyzing their evolving needs. Furthermore, we assess the landscape of mergers and acquisitions (M&A) activity, providing quantitative data on deal volumes and qualitative insights into their implications for market structure.
- Market Concentration: The MEA pouch packaging market exhibits a moderately concentrated structure, with the top five players holding an estimated xx% market share in 2025.
- Technological Innovation: Significant investments in automation and flexible packaging technologies are driving market growth. Barriers to innovation include high upfront investment costs and the need for skilled labor.
- Regulatory Landscape: Government regulations regarding food safety and sustainability are influencing packaging material choices and manufacturing practices.
- Competitive Substitutes: Alternative packaging formats, such as rigid containers and bottles, present competition, but pouches offer advantages in terms of cost and convenience.
- End-User Demographics: The food and beverage sector remains the dominant end-user segment, followed by personal care and pharmaceuticals. Growth in the e-commerce sector is fueling demand for pouches with enhanced barrier properties and tamper-evident features.
- M&A Activity: The past five years have witnessed xx M&A deals in the MEA pouch packaging market, reflecting consolidation and strategic expansion efforts by major players.
MEA Pouch Packaging Market Growth Trends & Insights
This section provides a detailed analysis of the MEA pouch packaging market's growth trajectory, leveraging extensive data and expert analysis. We examine market size evolution, adoption rates of new technologies, the impact of technological disruptions, and shifts in consumer behavior. Key performance indicators such as the Compound Annual Growth Rate (CAGR) and market penetration are provided to illuminate the growth dynamics. The market is expected to witness a CAGR of xx% during the forecast period (2025-2033). Factors influencing growth include rising disposable incomes, changing lifestyles, and increasing preference for convenient and portable products. Technological advancements in materials and machinery also contribute significantly to expansion. The report further assesses the impact of evolving consumer preferences, such as the growing demand for sustainable and eco-friendly packaging options, and the penetration of e-commerce across different demographics. We assess the impact of these macro-economic factors on the overall market trajectory, providing projections for the future.
Dominant Regions, Countries, or Segments in MEA Pouch Packaging Market
This section identifies the leading regions, countries, and segments within the MEA pouch packaging market that are driving its expansion. We present a detailed analysis of dominance factors, encompassing market share, growth potential, and key drivers. The analysis considers economic policies, infrastructural development, and consumer trends specific to each region and segment.
- Leading Region: xx (based on market size and growth rate).
- Key Drivers: Rapid urbanization, expanding middle class, and increasing demand for packaged foods and beverages are driving market growth in this region. Favorable government policies and investment in infrastructure further enhance the market's potential.
- Country-Specific Analysis: Further segmentation by country within the leading region will showcase market variations based on individual country-specific drivers.
- Dominant Segment: The food and beverage segment is the dominant segment within the MEA pouch packaging market, holding a share of xx% in 2025.
MEA Pouch Packaging Market Product Landscape
The MEA pouch packaging market showcases a diverse product landscape, with innovations in materials and designs constantly emerging. Stand-up pouches, doypacks, and flexible spouted pouches are particularly popular, offering enhanced convenience and shelf appeal. Technological advancements such as improved barrier properties, enhanced sealing technologies, and recyclable materials are driving product innovation and shaping the market's future. These advancements are aimed at improving product shelf life, enhancing convenience for consumers, and reducing environmental impact. Unique selling propositions include extended shelf life, easy dispensing, and reduced material usage, making pouches a compelling packaging option.
Key Drivers, Barriers & Challenges in MEA Pouch Packaging Market
Key Drivers:
- Growing demand for convenience: Consumer preference for convenient, single-serve packaging fuels growth.
- Rising disposable incomes: Increased purchasing power boosts demand for packaged goods.
- Technological advancements: Innovations in materials and machinery enhance efficiency and product quality.
- Government support for food processing industries: Investments and regulations foster expansion.
Challenges & Restraints:
- Fluctuating raw material prices: Increases in resin and other material costs impact profitability.
- Stringent regulatory requirements: Meeting food safety and environmental standards poses challenges.
- Intense competition: The market faces considerable competition from both established and emerging players.
- Supply chain disruptions: The dependence on global supply chains makes the industry vulnerable to disruptions.
Emerging Opportunities in MEA Pouch Packaging Market
Several significant opportunities are emerging within the MEA pouch packaging market. These include:
- Growth of the e-commerce sector: Increasing online shopping drives demand for robust and tamper-evident pouches.
- Rising demand for sustainable packaging: The push towards environmentally friendly solutions presents opportunities for eco-friendly pouch materials.
- Expansion into untapped markets: Significant growth potential exists in underserved rural and regional markets.
- Development of innovative pouch designs: New formats and features cater to emerging consumer preferences.
Growth Accelerators in the MEA Pouch Packaging Market Industry
Long-term growth in the MEA pouch packaging market is accelerated by several key factors. Technological advancements in flexible packaging materials and automation technologies continuously increase efficiency and reduce costs. Strategic partnerships between packaging manufacturers and food and beverage companies foster innovation and expansion. Market expansion into new geographic regions, coupled with tailored product offerings for specific market segments, further drives growth.
Key Players Shaping the MEA Pouch Packaging Market Market
- Amcor Group GmbH
- Mondi Group
- Constantia Flexibles Group GmbH
- Coveris Management GmbH
- Sealed Air Corporation (SEE)
- Huhtamaki Oyj
- Uflex Ltd
- Napco National
- Foster International Packaging
- Emirates Printing Press (LLC)
Notable Milestones in MEA Pouch Packaging Market Sector
- March 2024: Ishida Europe's acquisition of National Packaging Systems (NPS) expands its African footprint and boosts automation capabilities in the region.
- October 2023: ACMA and VOLPAK's strategic expansion into the MEA market introduces high-speed packaging solutions for liquid and semi-liquid products, catering to specific regional demands.
In-Depth MEA Pouch Packaging Market Outlook
The MEA pouch packaging market is poised for sustained growth, driven by technological advancements, increasing consumer demand for convenient packaging, and the expansion of key industries. Strategic partnerships, investments in automation, and the development of sustainable packaging solutions will shape the market's future. The market presents significant opportunities for innovation and expansion, offering attractive prospects for both established and emerging players.
MEA Pouch Packaging Market Segmentation
-
1. Material
-
1.1. Plastic
- 1.1.1. Polyethylene
- 1.1.2. Polypropylene
- 1.1.3. PET
- 1.1.4. PVC
- 1.1.5. EVOH
- 1.1.6. Other Resins
- 1.2. Paper
- 1.3. Aluminum
-
1.1. Plastic
-
2. Type
- 2.1. Standard
- 2.2. Aseptic
- 2.3. Retort
- 2.4. Hot Fill
-
3. Product
- 3.1. Flat (Pillow & Side-Seal)
- 3.2. Stand-up
-
4. End-User Industry
-
4.1. Food
- 4.1.1. Candy & Confectionery
- 4.1.2. Frozen Foods
- 4.1.3. Fresh Produce
- 4.1.4. Dairy Products
- 4.1.5. Dry Foods
- 4.1.6. Meat, Poultry, and Seafood
- 4.1.7. Pet Food
- 4.1.8. Other Fo
- 4.2. Medical and Pharmaceutical
- 4.3. Personal Care and Household Care
- 4.4. Other En
-
4.1. Food
MEA Pouch Packaging Market Segmentation By Geography
-
1. North America
- 1.1. United States
- 1.2. Canada
- 1.3. Mexico
-
2. South America
- 2.1. Brazil
- 2.2. Argentina
- 2.3. Rest of South America
-
3. Europe
- 3.1. United Kingdom
- 3.2. Germany
- 3.3. France
- 3.4. Italy
- 3.5. Spain
- 3.6. Russia
- 3.7. Benelux
- 3.8. Nordics
- 3.9. Rest of Europe
-
4. Middle East & Africa
- 4.1. Turkey
- 4.2. Israel
- 4.3. GCC
- 4.4. North Africa
- 4.5. South Africa
- 4.6. Rest of Middle East & Africa
-
5. Asia Pacific
- 5.1. China
- 5.2. India
- 5.3. Japan
- 5.4. South Korea
- 5.5. ASEAN
- 5.6. Oceania
- 5.7. Rest of Asia Pacific

MEA Pouch Packaging Market REPORT HIGHLIGHTS
| Aspects | Details |
|---|---|
| Study Period | 2019-2033 |
| Base Year | 2024 |
| Estimated Year | 2025 |
| Forecast Period | 2025-2033 |
| Historical Period | 2019-2024 |
| Growth Rate | CAGR of 5.59% from 2019-2033 |
| Segmentation |
|
Table of Contents
- 1. Introduction
- 1.1. Research Scope
- 1.2. Market Segmentation
- 1.3. Research Methodology
- 1.4. Definitions and Assumptions
- 2. Executive Summary
- 2.1. Introduction
- 3. Market Dynamics
- 3.1. Introduction
- 3.2. Market Drivers
- 3.2.1 Increasing Demand for Convenient
- 3.2.2 Ready-to-Eat Food Products; Increasing Demand for Lightweight Packaging Solution
- 3.3. Market Restrains
- 3.3.1 Increasing Demand for Convenient
- 3.3.2 Ready-to-Eat Food Products; Increasing Demand for Lightweight Packaging Solution
- 3.4. Market Trends
- 3.4.1. Aseptic Pouch Packaging Set to Witness the Fastest Growth
- 4. Market Factor Analysis
- 4.1. Porters Five Forces
- 4.2. Supply/Value Chain
- 4.3. PESTEL analysis
- 4.4. Market Entropy
- 4.5. Patent/Trademark Analysis
- 5. Global MEA Pouch Packaging Market Analysis, Insights and Forecast, 2019-2031
- 5.1. Market Analysis, Insights and Forecast - by Material
- 5.1.1. Plastic
- 5.1.1.1. Polyethylene
- 5.1.1.2. Polypropylene
- 5.1.1.3. PET
- 5.1.1.4. PVC
- 5.1.1.5. EVOH
- 5.1.1.6. Other Resins
- 5.1.2. Paper
- 5.1.3. Aluminum
- 5.1.1. Plastic
- 5.2. Market Analysis, Insights and Forecast - by Type
- 5.2.1. Standard
- 5.2.2. Aseptic
- 5.2.3. Retort
- 5.2.4. Hot Fill
- 5.3. Market Analysis, Insights and Forecast - by Product
- 5.3.1. Flat (Pillow & Side-Seal)
- 5.3.2. Stand-up
- 5.4. Market Analysis, Insights and Forecast - by End-User Industry
- 5.4.1. Food
- 5.4.1.1. Candy & Confectionery
- 5.4.1.2. Frozen Foods
- 5.4.1.3. Fresh Produce
- 5.4.1.4. Dairy Products
- 5.4.1.5. Dry Foods
- 5.4.1.6. Meat, Poultry, and Seafood
- 5.4.1.7. Pet Food
- 5.4.1.8. Other Fo
- 5.4.2. Medical and Pharmaceutical
- 5.4.3. Personal Care and Household Care
- 5.4.4. Other En
- 5.4.1. Food
- 5.5. Market Analysis, Insights and Forecast - by Region
- 5.5.1. North America
- 5.5.2. South America
- 5.5.3. Europe
- 5.5.4. Middle East & Africa
- 5.5.5. Asia Pacific
- 5.1. Market Analysis, Insights and Forecast - by Material
- 6. North America MEA Pouch Packaging Market Analysis, Insights and Forecast, 2019-2031
- 6.1. Market Analysis, Insights and Forecast - by Material
- 6.1.1. Plastic
- 6.1.1.1. Polyethylene
- 6.1.1.2. Polypropylene
- 6.1.1.3. PET
- 6.1.1.4. PVC
- 6.1.1.5. EVOH
- 6.1.1.6. Other Resins
- 6.1.2. Paper
- 6.1.3. Aluminum
- 6.1.1. Plastic
- 6.2. Market Analysis, Insights and Forecast - by Type
- 6.2.1. Standard
- 6.2.2. Aseptic
- 6.2.3. Retort
- 6.2.4. Hot Fill
- 6.3. Market Analysis, Insights and Forecast - by Product
- 6.3.1. Flat (Pillow & Side-Seal)
- 6.3.2. Stand-up
- 6.4. Market Analysis, Insights and Forecast - by End-User Industry
- 6.4.1. Food
- 6.4.1.1. Candy & Confectionery
- 6.4.1.2. Frozen Foods
- 6.4.1.3. Fresh Produce
- 6.4.1.4. Dairy Products
- 6.4.1.5. Dry Foods
- 6.4.1.6. Meat, Poultry, and Seafood
- 6.4.1.7. Pet Food
- 6.4.1.8. Other Fo
- 6.4.2. Medical and Pharmaceutical
- 6.4.3. Personal Care and Household Care
- 6.4.4. Other En
- 6.4.1. Food
- 6.1. Market Analysis, Insights and Forecast - by Material
- 7. South America MEA Pouch Packaging Market Analysis, Insights and Forecast, 2019-2031
- 7.1. Market Analysis, Insights and Forecast - by Material
- 7.1.1. Plastic
- 7.1.1.1. Polyethylene
- 7.1.1.2. Polypropylene
- 7.1.1.3. PET
- 7.1.1.4. PVC
- 7.1.1.5. EVOH
- 7.1.1.6. Other Resins
- 7.1.2. Paper
- 7.1.3. Aluminum
- 7.1.1. Plastic
- 7.2. Market Analysis, Insights and Forecast - by Type
- 7.2.1. Standard
- 7.2.2. Aseptic
- 7.2.3. Retort
- 7.2.4. Hot Fill
- 7.3. Market Analysis, Insights and Forecast - by Product
- 7.3.1. Flat (Pillow & Side-Seal)
- 7.3.2. Stand-up
- 7.4. Market Analysis, Insights and Forecast - by End-User Industry
- 7.4.1. Food
- 7.4.1.1. Candy & Confectionery
- 7.4.1.2. Frozen Foods
- 7.4.1.3. Fresh Produce
- 7.4.1.4. Dairy Products
- 7.4.1.5. Dry Foods
- 7.4.1.6. Meat, Poultry, and Seafood
- 7.4.1.7. Pet Food
- 7.4.1.8. Other Fo
- 7.4.2. Medical and Pharmaceutical
- 7.4.3. Personal Care and Household Care
- 7.4.4. Other En
- 7.4.1. Food
- 7.1. Market Analysis, Insights and Forecast - by Material
- 8. Europe MEA Pouch Packaging Market Analysis, Insights and Forecast, 2019-2031
- 8.1. Market Analysis, Insights and Forecast - by Material
- 8.1.1. Plastic
- 8.1.1.1. Polyethylene
- 8.1.1.2. Polypropylene
- 8.1.1.3. PET
- 8.1.1.4. PVC
- 8.1.1.5. EVOH
- 8.1.1.6. Other Resins
- 8.1.2. Paper
- 8.1.3. Aluminum
- 8.1.1. Plastic
- 8.2. Market Analysis, Insights and Forecast - by Type
- 8.2.1. Standard
- 8.2.2. Aseptic
- 8.2.3. Retort
- 8.2.4. Hot Fill
- 8.3. Market Analysis, Insights and Forecast - by Product
- 8.3.1. Flat (Pillow & Side-Seal)
- 8.3.2. Stand-up
- 8.4. Market Analysis, Insights and Forecast - by End-User Industry
- 8.4.1. Food
- 8.4.1.1. Candy & Confectionery
- 8.4.1.2. Frozen Foods
- 8.4.1.3. Fresh Produce
- 8.4.1.4. Dairy Products
- 8.4.1.5. Dry Foods
- 8.4.1.6. Meat, Poultry, and Seafood
- 8.4.1.7. Pet Food
- 8.4.1.8. Other Fo
- 8.4.2. Medical and Pharmaceutical
- 8.4.3. Personal Care and Household Care
- 8.4.4. Other En
- 8.4.1. Food
- 8.1. Market Analysis, Insights and Forecast - by Material
- 9. Middle East & Africa MEA Pouch Packaging Market Analysis, Insights and Forecast, 2019-2031
- 9.1. Market Analysis, Insights and Forecast - by Material
- 9.1.1. Plastic
- 9.1.1.1. Polyethylene
- 9.1.1.2. Polypropylene
- 9.1.1.3. PET
- 9.1.1.4. PVC
- 9.1.1.5. EVOH
- 9.1.1.6. Other Resins
- 9.1.2. Paper
- 9.1.3. Aluminum
- 9.1.1. Plastic
- 9.2. Market Analysis, Insights and Forecast - by Type
- 9.2.1. Standard
- 9.2.2. Aseptic
- 9.2.3. Retort
- 9.2.4. Hot Fill
- 9.3. Market Analysis, Insights and Forecast - by Product
- 9.3.1. Flat (Pillow & Side-Seal)
- 9.3.2. Stand-up
- 9.4. Market Analysis, Insights and Forecast - by End-User Industry
- 9.4.1. Food
- 9.4.1.1. Candy & Confectionery
- 9.4.1.2. Frozen Foods
- 9.4.1.3. Fresh Produce
- 9.4.1.4. Dairy Products
- 9.4.1.5. Dry Foods
- 9.4.1.6. Meat, Poultry, and Seafood
- 9.4.1.7. Pet Food
- 9.4.1.8. Other Fo
- 9.4.2. Medical and Pharmaceutical
- 9.4.3. Personal Care and Household Care
- 9.4.4. Other En
- 9.4.1. Food
- 9.1. Market Analysis, Insights and Forecast - by Material
- 10. Asia Pacific MEA Pouch Packaging Market Analysis, Insights and Forecast, 2019-2031
- 10.1. Market Analysis, Insights and Forecast - by Material
- 10.1.1. Plastic
- 10.1.1.1. Polyethylene
- 10.1.1.2. Polypropylene
- 10.1.1.3. PET
- 10.1.1.4. PVC
- 10.1.1.5. EVOH
- 10.1.1.6. Other Resins
- 10.1.2. Paper
- 10.1.3. Aluminum
- 10.1.1. Plastic
- 10.2. Market Analysis, Insights and Forecast - by Type
- 10.2.1. Standard
- 10.2.2. Aseptic
- 10.2.3. Retort
- 10.2.4. Hot Fill
- 10.3. Market Analysis, Insights and Forecast - by Product
- 10.3.1. Flat (Pillow & Side-Seal)
- 10.3.2. Stand-up
- 10.4. Market Analysis, Insights and Forecast - by End-User Industry
- 10.4.1. Food
- 10.4.1.1. Candy & Confectionery
- 10.4.1.2. Frozen Foods
- 10.4.1.3. Fresh Produce
- 10.4.1.4. Dairy Products
- 10.4.1.5. Dry Foods
- 10.4.1.6. Meat, Poultry, and Seafood
- 10.4.1.7. Pet Food
- 10.4.1.8. Other Fo
- 10.4.2. Medical and Pharmaceutical
- 10.4.3. Personal Care and Household Care
- 10.4.4. Other En
- 10.4.1. Food
- 10.1. Market Analysis, Insights and Forecast - by Material
- 11. Competitive Analysis
- 11.1. Global Market Share Analysis 2024
- 11.2. Company Profiles
- 11.2.1 Amcor Group GmbH
- 11.2.1.1. Overview
- 11.2.1.2. Products
- 11.2.1.3. SWOT Analysis
- 11.2.1.4. Recent Developments
- 11.2.1.5. Financials (Based on Availability)
- 11.2.2 Mondi Group
- 11.2.2.1. Overview
- 11.2.2.2. Products
- 11.2.2.3. SWOT Analysis
- 11.2.2.4. Recent Developments
- 11.2.2.5. Financials (Based on Availability)
- 11.2.3 Constantia Flexibles Group GmbH
- 11.2.3.1. Overview
- 11.2.3.2. Products
- 11.2.3.3. SWOT Analysis
- 11.2.3.4. Recent Developments
- 11.2.3.5. Financials (Based on Availability)
- 11.2.4 Coveris Management GmbH
- 11.2.4.1. Overview
- 11.2.4.2. Products
- 11.2.4.3. SWOT Analysis
- 11.2.4.4. Recent Developments
- 11.2.4.5. Financials (Based on Availability)
- 11.2.5 Sealed Air Corporation (SEE)
- 11.2.5.1. Overview
- 11.2.5.2. Products
- 11.2.5.3. SWOT Analysis
- 11.2.5.4. Recent Developments
- 11.2.5.5. Financials (Based on Availability)
- 11.2.6 Huhtamaki Oyj
- 11.2.6.1. Overview
- 11.2.6.2. Products
- 11.2.6.3. SWOT Analysis
- 11.2.6.4. Recent Developments
- 11.2.6.5. Financials (Based on Availability)
- 11.2.7 Uflex Ltd
- 11.2.7.1. Overview
- 11.2.7.2. Products
- 11.2.7.3. SWOT Analysis
- 11.2.7.4. Recent Developments
- 11.2.7.5. Financials (Based on Availability)
- 11.2.8 Napco National
- 11.2.8.1. Overview
- 11.2.8.2. Products
- 11.2.8.3. SWOT Analysis
- 11.2.8.4. Recent Developments
- 11.2.8.5. Financials (Based on Availability)
- 11.2.9 Foster International Packaging
- 11.2.9.1. Overview
- 11.2.9.2. Products
- 11.2.9.3. SWOT Analysis
- 11.2.9.4. Recent Developments
- 11.2.9.5. Financials (Based on Availability)
- 11.2.10 Emirates Printing Press (LLC
- 11.2.10.1. Overview
- 11.2.10.2. Products
- 11.2.10.3. SWOT Analysis
- 11.2.10.4. Recent Developments
- 11.2.10.5. Financials (Based on Availability)
- 11.2.1 Amcor Group GmbH
List of Figures
- Figure 1: Global MEA Pouch Packaging Market Revenue Breakdown (Million, %) by Region 2024 & 2032
- Figure 2: Global MEA Pouch Packaging Market Volume Breakdown (Billion, %) by Region 2024 & 2032
- Figure 3: North America MEA Pouch Packaging Market Revenue (Million), by Material 2024 & 2032
- Figure 4: North America MEA Pouch Packaging Market Volume (Billion), by Material 2024 & 2032
- Figure 5: North America MEA Pouch Packaging Market Revenue Share (%), by Material 2024 & 2032
- Figure 6: North America MEA Pouch Packaging Market Volume Share (%), by Material 2024 & 2032
- Figure 7: North America MEA Pouch Packaging Market Revenue (Million), by Type 2024 & 2032
- Figure 8: North America MEA Pouch Packaging Market Volume (Billion), by Type 2024 & 2032
- Figure 9: North America MEA Pouch Packaging Market Revenue Share (%), by Type 2024 & 2032
- Figure 10: North America MEA Pouch Packaging Market Volume Share (%), by Type 2024 & 2032
- Figure 11: North America MEA Pouch Packaging Market Revenue (Million), by Product 2024 & 2032
- Figure 12: North America MEA Pouch Packaging Market Volume (Billion), by Product 2024 & 2032
- Figure 13: North America MEA Pouch Packaging Market Revenue Share (%), by Product 2024 & 2032
- Figure 14: North America MEA Pouch Packaging Market Volume Share (%), by Product 2024 & 2032
- Figure 15: North America MEA Pouch Packaging Market Revenue (Million), by End-User Industry 2024 & 2032
- Figure 16: North America MEA Pouch Packaging Market Volume (Billion), by End-User Industry 2024 & 2032
- Figure 17: North America MEA Pouch Packaging Market Revenue Share (%), by End-User Industry 2024 & 2032
- Figure 18: North America MEA Pouch Packaging Market Volume Share (%), by End-User Industry 2024 & 2032
- Figure 19: North America MEA Pouch Packaging Market Revenue (Million), by Country 2024 & 2032
- Figure 20: North America MEA Pouch Packaging Market Volume (Billion), by Country 2024 & 2032
- Figure 21: North America MEA Pouch Packaging Market Revenue Share (%), by Country 2024 & 2032
- Figure 22: North America MEA Pouch Packaging Market Volume Share (%), by Country 2024 & 2032
- Figure 23: South America MEA Pouch Packaging Market Revenue (Million), by Material 2024 & 2032
- Figure 24: South America MEA Pouch Packaging Market Volume (Billion), by Material 2024 & 2032
- Figure 25: South America MEA Pouch Packaging Market Revenue Share (%), by Material 2024 & 2032
- Figure 26: South America MEA Pouch Packaging Market Volume Share (%), by Material 2024 & 2032
- Figure 27: South America MEA Pouch Packaging Market Revenue (Million), by Type 2024 & 2032
- Figure 28: South America MEA Pouch Packaging Market Volume (Billion), by Type 2024 & 2032
- Figure 29: South America MEA Pouch Packaging Market Revenue Share (%), by Type 2024 & 2032
- Figure 30: South America MEA Pouch Packaging Market Volume Share (%), by Type 2024 & 2032
- Figure 31: South America MEA Pouch Packaging Market Revenue (Million), by Product 2024 & 2032
- Figure 32: South America MEA Pouch Packaging Market Volume (Billion), by Product 2024 & 2032
- Figure 33: South America MEA Pouch Packaging Market Revenue Share (%), by Product 2024 & 2032
- Figure 34: South America MEA Pouch Packaging Market Volume Share (%), by Product 2024 & 2032
- Figure 35: South America MEA Pouch Packaging Market Revenue (Million), by End-User Industry 2024 & 2032
- Figure 36: South America MEA Pouch Packaging Market Volume (Billion), by End-User Industry 2024 & 2032
- Figure 37: South America MEA Pouch Packaging Market Revenue Share (%), by End-User Industry 2024 & 2032
- Figure 38: South America MEA Pouch Packaging Market Volume Share (%), by End-User Industry 2024 & 2032
- Figure 39: South America MEA Pouch Packaging Market Revenue (Million), by Country 2024 & 2032
- Figure 40: South America MEA Pouch Packaging Market Volume (Billion), by Country 2024 & 2032
- Figure 41: South America MEA Pouch Packaging Market Revenue Share (%), by Country 2024 & 2032
- Figure 42: South America MEA Pouch Packaging Market Volume Share (%), by Country 2024 & 2032
- Figure 43: Europe MEA Pouch Packaging Market Revenue (Million), by Material 2024 & 2032
- Figure 44: Europe MEA Pouch Packaging Market Volume (Billion), by Material 2024 & 2032
- Figure 45: Europe MEA Pouch Packaging Market Revenue Share (%), by Material 2024 & 2032
- Figure 46: Europe MEA Pouch Packaging Market Volume Share (%), by Material 2024 & 2032
- Figure 47: Europe MEA Pouch Packaging Market Revenue (Million), by Type 2024 & 2032
- Figure 48: Europe MEA Pouch Packaging Market Volume (Billion), by Type 2024 & 2032
- Figure 49: Europe MEA Pouch Packaging Market Revenue Share (%), by Type 2024 & 2032
- Figure 50: Europe MEA Pouch Packaging Market Volume Share (%), by Type 2024 & 2032
- Figure 51: Europe MEA Pouch Packaging Market Revenue (Million), by Product 2024 & 2032
- Figure 52: Europe MEA Pouch Packaging Market Volume (Billion), by Product 2024 & 2032
- Figure 53: Europe MEA Pouch Packaging Market Revenue Share (%), by Product 2024 & 2032
- Figure 54: Europe MEA Pouch Packaging Market Volume Share (%), by Product 2024 & 2032
- Figure 55: Europe MEA Pouch Packaging Market Revenue (Million), by End-User Industry 2024 & 2032
- Figure 56: Europe MEA Pouch Packaging Market Volume (Billion), by End-User Industry 2024 & 2032
- Figure 57: Europe MEA Pouch Packaging Market Revenue Share (%), by End-User Industry 2024 & 2032
- Figure 58: Europe MEA Pouch Packaging Market Volume Share (%), by End-User Industry 2024 & 2032
- Figure 59: Europe MEA Pouch Packaging Market Revenue (Million), by Country 2024 & 2032
- Figure 60: Europe MEA Pouch Packaging Market Volume (Billion), by Country 2024 & 2032
- Figure 61: Europe MEA Pouch Packaging Market Revenue Share (%), by Country 2024 & 2032
- Figure 62: Europe MEA Pouch Packaging Market Volume Share (%), by Country 2024 & 2032
- Figure 63: Middle East & Africa MEA Pouch Packaging Market Revenue (Million), by Material 2024 & 2032
- Figure 64: Middle East & Africa MEA Pouch Packaging Market Volume (Billion), by Material 2024 & 2032
- Figure 65: Middle East & Africa MEA Pouch Packaging Market Revenue Share (%), by Material 2024 & 2032
- Figure 66: Middle East & Africa MEA Pouch Packaging Market Volume Share (%), by Material 2024 & 2032
- Figure 67: Middle East & Africa MEA Pouch Packaging Market Revenue (Million), by Type 2024 & 2032
- Figure 68: Middle East & Africa MEA Pouch Packaging Market Volume (Billion), by Type 2024 & 2032
- Figure 69: Middle East & Africa MEA Pouch Packaging Market Revenue Share (%), by Type 2024 & 2032
- Figure 70: Middle East & Africa MEA Pouch Packaging Market Volume Share (%), by Type 2024 & 2032
- Figure 71: Middle East & Africa MEA Pouch Packaging Market Revenue (Million), by Product 2024 & 2032
- Figure 72: Middle East & Africa MEA Pouch Packaging Market Volume (Billion), by Product 2024 & 2032
- Figure 73: Middle East & Africa MEA Pouch Packaging Market Revenue Share (%), by Product 2024 & 2032
- Figure 74: Middle East & Africa MEA Pouch Packaging Market Volume Share (%), by Product 2024 & 2032
- Figure 75: Middle East & Africa MEA Pouch Packaging Market Revenue (Million), by End-User Industry 2024 & 2032
- Figure 76: Middle East & Africa MEA Pouch Packaging Market Volume (Billion), by End-User Industry 2024 & 2032
- Figure 77: Middle East & Africa MEA Pouch Packaging Market Revenue Share (%), by End-User Industry 2024 & 2032
- Figure 78: Middle East & Africa MEA Pouch Packaging Market Volume Share (%), by End-User Industry 2024 & 2032
- Figure 79: Middle East & Africa MEA Pouch Packaging Market Revenue (Million), by Country 2024 & 2032
- Figure 80: Middle East & Africa MEA Pouch Packaging Market Volume (Billion), by Country 2024 & 2032
- Figure 81: Middle East & Africa MEA Pouch Packaging Market Revenue Share (%), by Country 2024 & 2032
- Figure 82: Middle East & Africa MEA Pouch Packaging Market Volume Share (%), by Country 2024 & 2032
- Figure 83: Asia Pacific MEA Pouch Packaging Market Revenue (Million), by Material 2024 & 2032
- Figure 84: Asia Pacific MEA Pouch Packaging Market Volume (Billion), by Material 2024 & 2032
- Figure 85: Asia Pacific MEA Pouch Packaging Market Revenue Share (%), by Material 2024 & 2032
- Figure 86: Asia Pacific MEA Pouch Packaging Market Volume Share (%), by Material 2024 & 2032
- Figure 87: Asia Pacific MEA Pouch Packaging Market Revenue (Million), by Type 2024 & 2032
- Figure 88: Asia Pacific MEA Pouch Packaging Market Volume (Billion), by Type 2024 & 2032
- Figure 89: Asia Pacific MEA Pouch Packaging Market Revenue Share (%), by Type 2024 & 2032
- Figure 90: Asia Pacific MEA Pouch Packaging Market Volume Share (%), by Type 2024 & 2032
- Figure 91: Asia Pacific MEA Pouch Packaging Market Revenue (Million), by Product 2024 & 2032
- Figure 92: Asia Pacific MEA Pouch Packaging Market Volume (Billion), by Product 2024 & 2032
- Figure 93: Asia Pacific MEA Pouch Packaging Market Revenue Share (%), by Product 2024 & 2032
- Figure 94: Asia Pacific MEA Pouch Packaging Market Volume Share (%), by Product 2024 & 2032
- Figure 95: Asia Pacific MEA Pouch Packaging Market Revenue (Million), by End-User Industry 2024 & 2032
- Figure 96: Asia Pacific MEA Pouch Packaging Market Volume (Billion), by End-User Industry 2024 & 2032
- Figure 97: Asia Pacific MEA Pouch Packaging Market Revenue Share (%), by End-User Industry 2024 & 2032
- Figure 98: Asia Pacific MEA Pouch Packaging Market Volume Share (%), by End-User Industry 2024 & 2032
- Figure 99: Asia Pacific MEA Pouch Packaging Market Revenue (Million), by Country 2024 & 2032
- Figure 100: Asia Pacific MEA Pouch Packaging Market Volume (Billion), by Country 2024 & 2032
- Figure 101: Asia Pacific MEA Pouch Packaging Market Revenue Share (%), by Country 2024 & 2032
- Figure 102: Asia Pacific MEA Pouch Packaging Market Volume Share (%), by Country 2024 & 2032
List of Tables
- Table 1: Global MEA Pouch Packaging Market Revenue Million Forecast, by Region 2019 & 2032
- Table 2: Global MEA Pouch Packaging Market Volume Billion Forecast, by Region 2019 & 2032
- Table 3: Global MEA Pouch Packaging Market Revenue Million Forecast, by Material 2019 & 2032
- Table 4: Global MEA Pouch Packaging Market Volume Billion Forecast, by Material 2019 & 2032
- Table 5: Global MEA Pouch Packaging Market Revenue Million Forecast, by Type 2019 & 2032
- Table 6: Global MEA Pouch Packaging Market Volume Billion Forecast, by Type 2019 & 2032
- Table 7: Global MEA Pouch Packaging Market Revenue Million Forecast, by Product 2019 & 2032
- Table 8: Global MEA Pouch Packaging Market Volume Billion Forecast, by Product 2019 & 2032
- Table 9: Global MEA Pouch Packaging Market Revenue Million Forecast, by End-User Industry 2019 & 2032
- Table 10: Global MEA Pouch Packaging Market Volume Billion Forecast, by End-User Industry 2019 & 2032
- Table 11: Global MEA Pouch Packaging Market Revenue Million Forecast, by Region 2019 & 2032
- Table 12: Global MEA Pouch Packaging Market Volume Billion Forecast, by Region 2019 & 2032
- Table 13: Global MEA Pouch Packaging Market Revenue Million Forecast, by Material 2019 & 2032
- Table 14: Global MEA Pouch Packaging Market Volume Billion Forecast, by Material 2019 & 2032
- Table 15: Global MEA Pouch Packaging Market Revenue Million Forecast, by Type 2019 & 2032
- Table 16: Global MEA Pouch Packaging Market Volume Billion Forecast, by Type 2019 & 2032
- Table 17: Global MEA Pouch Packaging Market Revenue Million Forecast, by Product 2019 & 2032
- Table 18: Global MEA Pouch Packaging Market Volume Billion Forecast, by Product 2019 & 2032
- Table 19: Global MEA Pouch Packaging Market Revenue Million Forecast, by End-User Industry 2019 & 2032
- Table 20: Global MEA Pouch Packaging Market Volume Billion Forecast, by End-User Industry 2019 & 2032
- Table 21: Global MEA Pouch Packaging Market Revenue Million Forecast, by Country 2019 & 2032
- Table 22: Global MEA Pouch Packaging Market Volume Billion Forecast, by Country 2019 & 2032
- Table 23: United States MEA Pouch Packaging Market Revenue (Million) Forecast, by Application 2019 & 2032
- Table 24: United States MEA Pouch Packaging Market Volume (Billion) Forecast, by Application 2019 & 2032
- Table 25: Canada MEA Pouch Packaging Market Revenue (Million) Forecast, by Application 2019 & 2032
- Table 26: Canada MEA Pouch Packaging Market Volume (Billion) Forecast, by Application 2019 & 2032
- Table 27: Mexico MEA Pouch Packaging Market Revenue (Million) Forecast, by Application 2019 & 2032
- Table 28: Mexico MEA Pouch Packaging Market Volume (Billion) Forecast, by Application 2019 & 2032
- Table 29: Global MEA Pouch Packaging Market Revenue Million Forecast, by Material 2019 & 2032
- Table 30: Global MEA Pouch Packaging Market Volume Billion Forecast, by Material 2019 & 2032
- Table 31: Global MEA Pouch Packaging Market Revenue Million Forecast, by Type 2019 & 2032
- Table 32: Global MEA Pouch Packaging Market Volume Billion Forecast, by Type 2019 & 2032
- Table 33: Global MEA Pouch Packaging Market Revenue Million Forecast, by Product 2019 & 2032
- Table 34: Global MEA Pouch Packaging Market Volume Billion Forecast, by Product 2019 & 2032
- Table 35: Global MEA Pouch Packaging Market Revenue Million Forecast, by End-User Industry 2019 & 2032
- Table 36: Global MEA Pouch Packaging Market Volume Billion Forecast, by End-User Industry 2019 & 2032
- Table 37: Global MEA Pouch Packaging Market Revenue Million Forecast, by Country 2019 & 2032
- Table 38: Global MEA Pouch Packaging Market Volume Billion Forecast, by Country 2019 & 2032
- Table 39: Brazil MEA Pouch Packaging Market Revenue (Million) Forecast, by Application 2019 & 2032
- Table 40: Brazil MEA Pouch Packaging Market Volume (Billion) Forecast, by Application 2019 & 2032
- Table 41: Argentina MEA Pouch Packaging Market Revenue (Million) Forecast, by Application 2019 & 2032
- Table 42: Argentina MEA Pouch Packaging Market Volume (Billion) Forecast, by Application 2019 & 2032
- Table 43: Rest of South America MEA Pouch Packaging Market Revenue (Million) Forecast, by Application 2019 & 2032
- Table 44: Rest of South America MEA Pouch Packaging Market Volume (Billion) Forecast, by Application 2019 & 2032
- Table 45: Global MEA Pouch Packaging Market Revenue Million Forecast, by Material 2019 & 2032
- Table 46: Global MEA Pouch Packaging Market Volume Billion Forecast, by Material 2019 & 2032
- Table 47: Global MEA Pouch Packaging Market Revenue Million Forecast, by Type 2019 & 2032
- Table 48: Global MEA Pouch Packaging Market Volume Billion Forecast, by Type 2019 & 2032
- Table 49: Global MEA Pouch Packaging Market Revenue Million Forecast, by Product 2019 & 2032
- Table 50: Global MEA Pouch Packaging Market Volume Billion Forecast, by Product 2019 & 2032
- Table 51: Global MEA Pouch Packaging Market Revenue Million Forecast, by End-User Industry 2019 & 2032
- Table 52: Global MEA Pouch Packaging Market Volume Billion Forecast, by End-User Industry 2019 & 2032
- Table 53: Global MEA Pouch Packaging Market Revenue Million Forecast, by Country 2019 & 2032
- Table 54: Global MEA Pouch Packaging Market Volume Billion Forecast, by Country 2019 & 2032
- Table 55: United Kingdom MEA Pouch Packaging Market Revenue (Million) Forecast, by Application 2019 & 2032
- Table 56: United Kingdom MEA Pouch Packaging Market Volume (Billion) Forecast, by Application 2019 & 2032
- Table 57: Germany MEA Pouch Packaging Market Revenue (Million) Forecast, by Application 2019 & 2032
- Table 58: Germany MEA Pouch Packaging Market Volume (Billion) Forecast, by Application 2019 & 2032
- Table 59: France MEA Pouch Packaging Market Revenue (Million) Forecast, by Application 2019 & 2032
- Table 60: France MEA Pouch Packaging Market Volume (Billion) Forecast, by Application 2019 & 2032
- Table 61: Italy MEA Pouch Packaging Market Revenue (Million) Forecast, by Application 2019 & 2032
- Table 62: Italy MEA Pouch Packaging Market Volume (Billion) Forecast, by Application 2019 & 2032
- Table 63: Spain MEA Pouch Packaging Market Revenue (Million) Forecast, by Application 2019 & 2032
- Table 64: Spain MEA Pouch Packaging Market Volume (Billion) Forecast, by Application 2019 & 2032
- Table 65: Russia MEA Pouch Packaging Market Revenue (Million) Forecast, by Application 2019 & 2032
- Table 66: Russia MEA Pouch Packaging Market Volume (Billion) Forecast, by Application 2019 & 2032
- Table 67: Benelux MEA Pouch Packaging Market Revenue (Million) Forecast, by Application 2019 & 2032
- Table 68: Benelux MEA Pouch Packaging Market Volume (Billion) Forecast, by Application 2019 & 2032
- Table 69: Nordics MEA Pouch Packaging Market Revenue (Million) Forecast, by Application 2019 & 2032
- Table 70: Nordics MEA Pouch Packaging Market Volume (Billion) Forecast, by Application 2019 & 2032
- Table 71: Rest of Europe MEA Pouch Packaging Market Revenue (Million) Forecast, by Application 2019 & 2032
- Table 72: Rest of Europe MEA Pouch Packaging Market Volume (Billion) Forecast, by Application 2019 & 2032
- Table 73: Global MEA Pouch Packaging Market Revenue Million Forecast, by Material 2019 & 2032
- Table 74: Global MEA Pouch Packaging Market Volume Billion Forecast, by Material 2019 & 2032
- Table 75: Global MEA Pouch Packaging Market Revenue Million Forecast, by Type 2019 & 2032
- Table 76: Global MEA Pouch Packaging Market Volume Billion Forecast, by Type 2019 & 2032
- Table 77: Global MEA Pouch Packaging Market Revenue Million Forecast, by Product 2019 & 2032
- Table 78: Global MEA Pouch Packaging Market Volume Billion Forecast, by Product 2019 & 2032
- Table 79: Global MEA Pouch Packaging Market Revenue Million Forecast, by End-User Industry 2019 & 2032
- Table 80: Global MEA Pouch Packaging Market Volume Billion Forecast, by End-User Industry 2019 & 2032
- Table 81: Global MEA Pouch Packaging Market Revenue Million Forecast, by Country 2019 & 2032
- Table 82: Global MEA Pouch Packaging Market Volume Billion Forecast, by Country 2019 & 2032
- Table 83: Turkey MEA Pouch Packaging Market Revenue (Million) Forecast, by Application 2019 & 2032
- Table 84: Turkey MEA Pouch Packaging Market Volume (Billion) Forecast, by Application 2019 & 2032
- Table 85: Israel MEA Pouch Packaging Market Revenue (Million) Forecast, by Application 2019 & 2032
- Table 86: Israel MEA Pouch Packaging Market Volume (Billion) Forecast, by Application 2019 & 2032
- Table 87: GCC MEA Pouch Packaging Market Revenue (Million) Forecast, by Application 2019 & 2032
- Table 88: GCC MEA Pouch Packaging Market Volume (Billion) Forecast, by Application 2019 & 2032
- Table 89: North Africa MEA Pouch Packaging Market Revenue (Million) Forecast, by Application 2019 & 2032
- Table 90: North Africa MEA Pouch Packaging Market Volume (Billion) Forecast, by Application 2019 & 2032
- Table 91: South Africa MEA Pouch Packaging Market Revenue (Million) Forecast, by Application 2019 & 2032
- Table 92: South Africa MEA Pouch Packaging Market Volume (Billion) Forecast, by Application 2019 & 2032
- Table 93: Rest of Middle East & Africa MEA Pouch Packaging Market Revenue (Million) Forecast, by Application 2019 & 2032
- Table 94: Rest of Middle East & Africa MEA Pouch Packaging Market Volume (Billion) Forecast, by Application 2019 & 2032
- Table 95: Global MEA Pouch Packaging Market Revenue Million Forecast, by Material 2019 & 2032
- Table 96: Global MEA Pouch Packaging Market Volume Billion Forecast, by Material 2019 & 2032
- Table 97: Global MEA Pouch Packaging Market Revenue Million Forecast, by Type 2019 & 2032
- Table 98: Global MEA Pouch Packaging Market Volume Billion Forecast, by Type 2019 & 2032
- Table 99: Global MEA Pouch Packaging Market Revenue Million Forecast, by Product 2019 & 2032
- Table 100: Global MEA Pouch Packaging Market Volume Billion Forecast, by Product 2019 & 2032
- Table 101: Global MEA Pouch Packaging Market Revenue Million Forecast, by End-User Industry 2019 & 2032
- Table 102: Global MEA Pouch Packaging Market Volume Billion Forecast, by End-User Industry 2019 & 2032
- Table 103: Global MEA Pouch Packaging Market Revenue Million Forecast, by Country 2019 & 2032
- Table 104: Global MEA Pouch Packaging Market Volume Billion Forecast, by Country 2019 & 2032
- Table 105: China MEA Pouch Packaging Market Revenue (Million) Forecast, by Application 2019 & 2032
- Table 106: China MEA Pouch Packaging Market Volume (Billion) Forecast, by Application 2019 & 2032
- Table 107: India MEA Pouch Packaging Market Revenue (Million) Forecast, by Application 2019 & 2032
- Table 108: India MEA Pouch Packaging Market Volume (Billion) Forecast, by Application 2019 & 2032
- Table 109: Japan MEA Pouch Packaging Market Revenue (Million) Forecast, by Application 2019 & 2032
- Table 110: Japan MEA Pouch Packaging Market Volume (Billion) Forecast, by Application 2019 & 2032
- Table 111: South Korea MEA Pouch Packaging Market Revenue (Million) Forecast, by Application 2019 & 2032
- Table 112: South Korea MEA Pouch Packaging Market Volume (Billion) Forecast, by Application 2019 & 2032
- Table 113: ASEAN MEA Pouch Packaging Market Revenue (Million) Forecast, by Application 2019 & 2032
- Table 114: ASEAN MEA Pouch Packaging Market Volume (Billion) Forecast, by Application 2019 & 2032
- Table 115: Oceania MEA Pouch Packaging Market Revenue (Million) Forecast, by Application 2019 & 2032
- Table 116: Oceania MEA Pouch Packaging Market Volume (Billion) Forecast, by Application 2019 & 2032
- Table 117: Rest of Asia Pacific MEA Pouch Packaging Market Revenue (Million) Forecast, by Application 2019 & 2032
- Table 118: Rest of Asia Pacific MEA Pouch Packaging Market Volume (Billion) Forecast, by Application 2019 & 2032
Frequently Asked Questions
1. What is the projected Compound Annual Growth Rate (CAGR) of the MEA Pouch Packaging Market?
The projected CAGR is approximately 5.59%.
2. Which companies are prominent players in the MEA Pouch Packaging Market?
Key companies in the market include Amcor Group GmbH, Mondi Group, Constantia Flexibles Group GmbH, Coveris Management GmbH, Sealed Air Corporation (SEE), Huhtamaki Oyj, Uflex Ltd, Napco National, Foster International Packaging, Emirates Printing Press (LLC.
3. What are the main segments of the MEA Pouch Packaging Market?
The market segments include Material, Type, Product, End-User Industry.
4. Can you provide details about the market size?
The market size is estimated to be USD 2.03 Million as of 2022.
5. What are some drivers contributing to market growth?
Increasing Demand for Convenient. Ready-to-Eat Food Products; Increasing Demand for Lightweight Packaging Solution.
6. What are the notable trends driving market growth?
Aseptic Pouch Packaging Set to Witness the Fastest Growth.
7. Are there any restraints impacting market growth?
Increasing Demand for Convenient. Ready-to-Eat Food Products; Increasing Demand for Lightweight Packaging Solution.
8. Can you provide examples of recent developments in the market?
March 2024: Ishida Europe increased its footprint in Africa with the acquisition of South African packaging equipment manufacturer National Packaging Systems (NPS). NPS designs and manufactures vertical form, fill, and seal machines for sachets, stick packs, and pillow packs, as well as volumetric fillers, auger fillers, and feed systems. In addition to helping businesses increase levels of automation further, the new Ishida/NPS partnership should offer start-up operations the opportunity to take their first steps in automating their processes with the availability of high-quality and cost-effective entry-level weighing and packing systems.
9. What pricing options are available for accessing the report?
Pricing options include single-user, multi-user, and enterprise licenses priced at USD 4750, USD 4950, and USD 6800 respectively.
10. Is the market size provided in terms of value or volume?
The market size is provided in terms of value, measured in Million and volume, measured in Billion.
11. Are there any specific market keywords associated with the report?
Yes, the market keyword associated with the report is "MEA Pouch Packaging Market," which aids in identifying and referencing the specific market segment covered.
12. How do I determine which pricing option suits my needs best?
The pricing options vary based on user requirements and access needs. Individual users may opt for single-user licenses, while businesses requiring broader access may choose multi-user or enterprise licenses for cost-effective access to the report.
13. Are there any additional resources or data provided in the MEA Pouch Packaging Market report?
While the report offers comprehensive insights, it's advisable to review the specific contents or supplementary materials provided to ascertain if additional resources or data are available.
14. How can I stay updated on further developments or reports in the MEA Pouch Packaging Market?
To stay informed about further developments, trends, and reports in the MEA Pouch Packaging Market, consider subscribing to industry newsletters, following relevant companies and organizations, or regularly checking reputable industry news sources and publications.
Methodology
Step 1 - Identification of Relevant Samples Size from Population Database


Step 2 - Approaches for Defining Global Market Size (Value, Volume* & Price*)

Note*: In applicable scenarios
Step 3 - Data Sources
Primary Research
- Web Analytics
- Survey Reports
- Research Institute
- Latest Research Reports
- Opinion Leaders
Secondary Research
- Annual Reports
- White Paper
- Latest Press Release
- Industry Association
- Paid Database
- Investor Presentations

Step 4 - Data Triangulation
Involves using different sources of information in order to increase the validity of a study
These sources are likely to be stakeholders in a program - participants, other researchers, program staff, other community members, and so on.
Then we put all data in single framework & apply various statistical tools to find out the dynamic on the market.
During the analysis stage, feedback from the stakeholder groups would be compared to determine areas of agreement as well as areas of divergence


