
Key Insights
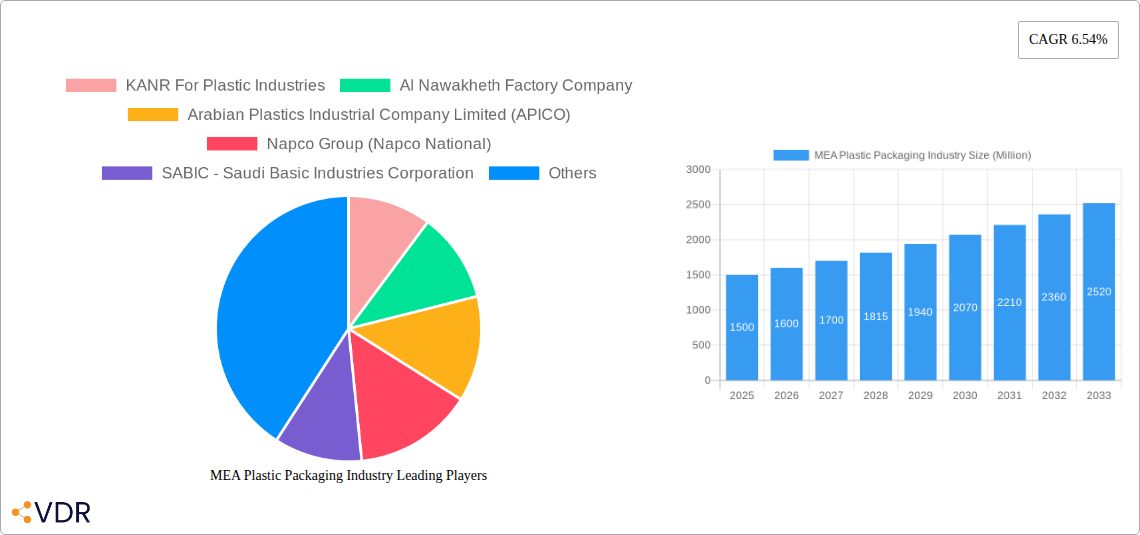
The MEA plastic packaging market, exhibiting a Compound Annual Growth Rate (CAGR) of 6.54%, presents a lucrative opportunity for investors and businesses. Driven by factors such as a burgeoning population, rising disposable incomes, and a shift towards packaged food and beverages, the market is projected to experience significant growth over the forecast period (2025-2033). The increasing demand for convenient and safe packaging across various sectors—food and beverage, healthcare, cosmetics, and personal care—fuels this expansion. Key segments within the market, such as polyethylene (PE) and polyethylene terephthalate (PET) packaging, are expected to show particularly strong growth, reflecting the preference for lightweight, durable, and recyclable materials. However, stringent government regulations regarding plastic waste management and growing environmental concerns pose potential restraints. To mitigate these challenges, companies are increasingly focusing on sustainable packaging solutions, including biodegradable and compostable alternatives, and exploring partnerships to improve recycling infrastructure. The market is characterized by a mix of established multinational corporations and local players, leading to intense competition and innovation.
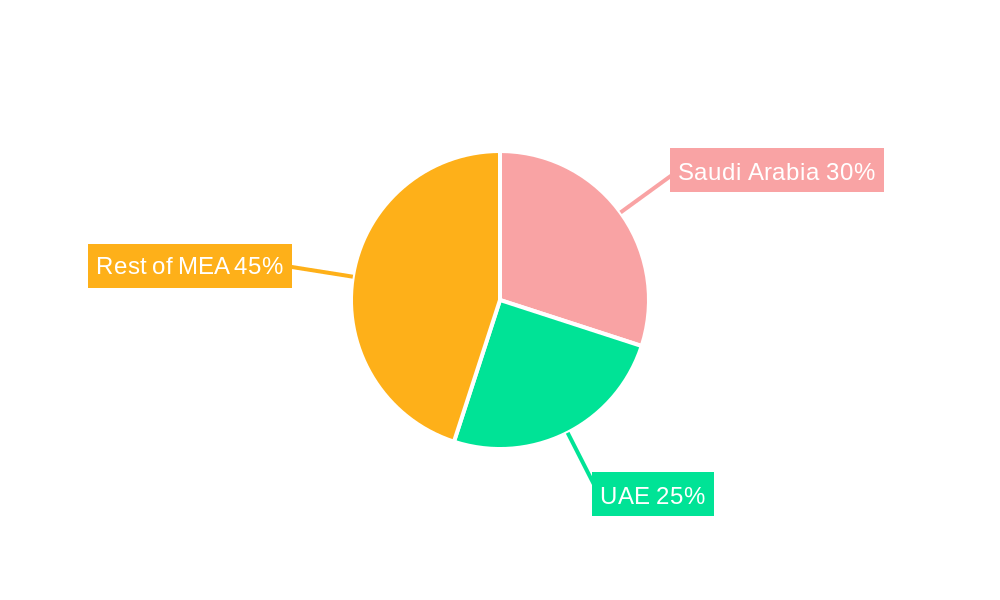
Within the MEA region, Saudi Arabia and the UAE are anticipated to be key contributors to market growth, owing to their robust economies and expanding consumer base. The development of advanced packaging technologies, including smart packaging and flexible packaging solutions, will further drive market expansion. The increasing adoption of e-commerce and online grocery delivery services is also expected to positively influence demand for efficient and reliable plastic packaging. The strategic focus on enhancing logistics and supply chain infrastructure within the region further supports the positive growth outlook. Companies are actively investing in research and development to improve product quality, explore cost-effective manufacturing processes, and adopt eco-friendly practices to gain a competitive edge in this dynamic market. Addressing the challenges of waste management through innovative solutions will be crucial for long-term sustainable growth within the MEA plastic packaging industry.
MEA Plastic Packaging Industry: A Comprehensive Market Report (2019-2033)
This in-depth report provides a comprehensive analysis of the Middle East and Africa (MEA) plastic packaging industry, offering invaluable insights for industry professionals, investors, and strategic decision-makers. Covering the period from 2019 to 2033, with a focus on 2025, this report meticulously examines market dynamics, growth trends, dominant segments, and key players, equipping you with the knowledge needed to navigate this dynamic sector. The report values are presented in Million units.
MEA Plastic Packaging Industry Market Dynamics & Structure
The MEA plastic packaging market is characterized by a moderately concentrated landscape, with several major players and a significant number of smaller regional players. Market concentration is estimated at xx%, with the top five players holding approximately yy% of the market share in 2025. Technological innovation, particularly in sustainable and recyclable packaging materials, is a key driver, although barriers such as high initial investment costs and limited access to advanced technologies exist. Stringent regulatory frameworks focused on environmental sustainability are shaping market practices, necessitating the adoption of eco-friendly solutions. Substitutes, such as paper and biodegradable packaging, are gaining traction, but plastic's cost-effectiveness and versatility maintain its dominant position. End-user demographics, characterized by a growing population and rising disposable incomes, fuel demand. M&A activity is relatively modest, with an estimated xx deals in the past five years, largely driven by consolidation efforts and the pursuit of technological advancements.
- Market Concentration: xx% (2025 estimate)
- Top 5 Players Market Share: yy% (2025 estimate)
- M&A Deal Volume (2019-2024): xx deals
- Key Innovation Barriers: High initial investment, technology access, skilled labor scarcity
MEA Plastic Packaging Industry Growth Trends & Insights
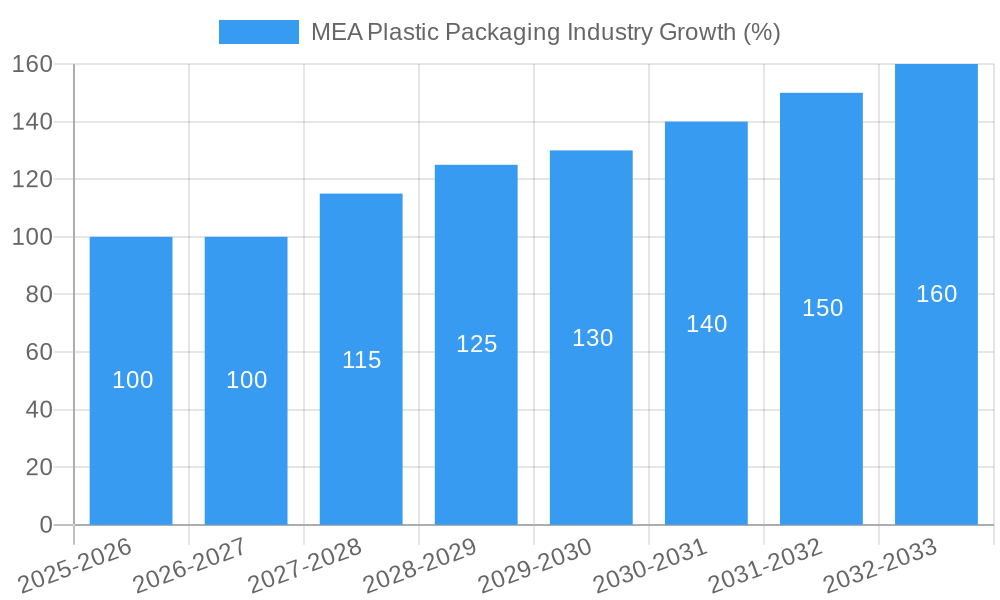
The MEA plastic packaging market is projected to experience robust growth throughout the forecast period (2025-2033). Driven by factors such as population growth, urbanization, rising disposable incomes, and increased consumer spending on packaged goods, the market is expected to witness a CAGR of xx% from 2025 to 2033. This growth is particularly evident in segments like flexible packaging and food & beverage applications. Technological disruptions, including the adoption of lightweight materials, smart packaging, and improved recycling technologies, are reshaping the market landscape. Consumer behavior shifts, including heightened awareness of environmental sustainability and a preference for convenience, are influencing packaging choices. Market penetration for sustainable packaging options is projected to reach xx% by 2033, reflecting a growing consumer demand for eco-friendly products.
Dominant Regions, Countries, or Segments in MEA Plastic Packaging Industry
The GCC region (Gulf Cooperation Council) dominates the MEA plastic packaging market, owing to its robust economic growth, advanced infrastructure, and substantial manufacturing base. Within the GCC, Saudi Arabia and the UAE are leading markets. Among product segments, bottles and jars hold the largest market share, driven by strong demand from the food and beverage industry. Polyethylene (PE) and Polyethylene Terephthalate (PET) are the most widely used materials, accounting for xx% and yy% of total material volume, respectively. The food and beverage industry remains the largest end-user sector, followed by cosmetics and personal care. The flexible packaging segment exhibits the highest growth potential due to its versatility and increasing consumer preference for convenient packaging options.
- Dominant Region: GCC
- Leading Countries: Saudi Arabia, UAE
- Largest Product Segment: Bottles and Jars
- Dominant Materials: PE (xx%), PET (yy%)
- Largest End-User: Food & Beverage
MEA Plastic Packaging Industry Product Landscape
The MEA plastic packaging market features a diverse range of products, including bottles, jars, tubs, pouches, and intermediate bulk containers (IBCs). Innovation focuses on lightweighting to reduce material usage, improved barrier properties to extend shelf life, and the incorporation of recycled content to meet sustainability goals. Product differentiation is driven by features such as tamper-evident seals, child-resistant closures, and convenient dispensing mechanisms. Technological advancements are centered around automation in packaging processes, the integration of smart technologies for traceability and consumer engagement, and the development of innovative, sustainable materials.
Key Drivers, Barriers & Challenges in MEA Plastic Packaging Industry
Key Drivers:
- Rapid urbanization and population growth.
- Rise in disposable incomes and consumer spending.
- Growing demand for packaged food and beverages.
- Technological advancements in packaging materials and processes.
Key Challenges:
- Fluctuating raw material prices.
- Stringent environmental regulations.
- Increasing competition from substitute packaging materials.
- Supply chain disruptions.
Emerging Opportunities in MEA Plastic Packaging Industry
- Growing demand for sustainable and eco-friendly packaging solutions.
- Expansion of e-commerce and the need for protective packaging.
- Increasing focus on food safety and hygiene.
- Development of innovative packaging designs and functionalities.
Growth Accelerators in the MEA Plastic Packaging Industry
The MEA plastic packaging market's long-term growth is fueled by strategic investments in sustainable packaging technologies, collaborations between packaging manufacturers and brand owners to develop innovative solutions, and the expansion of regional manufacturing capabilities to meet growing demand. Government initiatives promoting industrial diversification and investment in infrastructure further support market expansion. The increasing adoption of e-commerce will drive demand for protective and convenient packaging solutions.
Key Players Shaping the MEA Plastic Packaging Industry Market
- KANR For Plastic Industries
- Al Nawakheth Factory Company
- Arabian Plastics Industrial Company Limited (APICO)
- Napco Group (Napco National)
- SABIC - Saudi Basic Industries Corporation
- Zamil Plastic Industries Co
- Sealed Air Corporation (Sealed Air Saudi Arabia)
- Takween Advanced Industries
- AL-Ghandoura Co Manuf Plastic (GhanPlast)
- Saudi Arabian Packaging Industry WLL (SAPIN)
- Saudi Plastic Factory Company
- Arnon Plastic Industry Co Ltd
- Plastico SPS
- Coloredsun
- National Plastic Factory LLC
- Packaging Products Company (PPC)
Notable Milestones in MEA Plastic Packaging Industry Sector
- June 2022: SABIC partners with Heinz, Tesco, and Berry on a UK recycling trial using soft plastic packaging to create recycled polypropylene for Heinz Beanz Snap Pots.
In-Depth MEA Plastic Packaging Industry Market Outlook
The MEA plastic packaging market holds significant future potential, driven by ongoing economic growth, expanding consumer base, and technological advancements focused on sustainability. Strategic partnerships, investments in advanced manufacturing technologies, and the development of innovative packaging solutions will be critical factors in shaping the market's future trajectory. The focus on circular economy initiatives and sustainable packaging solutions will be key differentiators for success in the coming years.
MEA Plastic Packaging Industry Segmentation
-
1. Packaging Type
-
1.1. Rigid
-
1.1.1. By Material
- 1.1.1.1. Polyethylene (PE)
- 1.1.1.2. Polyethylene Terephthalate (PET)
- 1.1.1.3. Polypropylene (PP)
- 1.1.1.4. Polystyrene (PS) and Expanded Polystyrene (EPS)
- 1.1.1.5. Polyvinyl Chloride (PVC)
-
1.1.2. By End-user Industry
- 1.1.2.1. Food
- 1.1.2.2. Beverage
- 1.1.2.3. Healthcare and Pharmaceutical
- 1.1.2.4. Cosmetics and Personal Care
- 1.1.2.5. Other End-user Industries
-
1.1.1. By Material
-
1.2. Flexible
- 1.2.1. Polyethene (PE)
- 1.2.2. Bi-orientated Polypropylene (BOPP)
- 1.2.3. Cast Polypropylene (CPP)
- 1.2.4. Other Flexible Plastic Packaging Materials
-
1.1. Rigid
-
2. Product
- 2.1. Bottles and Jars
- 2.2. Tubs, Cups, Bowls, and Trays
- 2.3. Intermediate Bulk Containers
- 2.4. Pouches
- 2.5. Other Products
-
3. Geography
- 3.1. United Arab Emirates
- 3.2. Saudi Arabia
- 3.3. Egypt
- 3.4. South Africa
- 3.5. Rest of Middle East and Africa
MEA Plastic Packaging Industry Segmentation By Geography
- 1. United Arab Emirates
- 2. Saudi Arabia
- 3. Egypt
- 4. South Africa
- 5. Rest of Middle East and Africa
MEA Plastic Packaging Industry REPORT HIGHLIGHTS
| Aspects | Details |
|---|---|
| Study Period | 2019-2033 |
| Base Year | 2024 |
| Estimated Year | 2025 |
| Forecast Period | 2025-2033 |
| Historical Period | 2019-2024 |
| Growth Rate | CAGR of 6.54% from 2019-2033 |
| Segmentation |
|
Table of Contents
- 1. Introduction
- 1.1. Research Scope
- 1.2. Market Segmentation
- 1.3. Research Methodology
- 1.4. Definitions and Assumptions
- 2. Executive Summary
- 2.1. Introduction
- 3. Market Dynamics
- 3.1. Introduction
- 3.2. Market Drivers
- 3.2.1. Demand for Oxo-Degradable Plastics
- 3.3. Market Restrains
- 3.3.1. Environmental Concerns Over Recycling and Safe Disposal and Price Volatility of Raw Materials
- 3.4. Market Trends
- 3.4.1. Flexible Packaging is Expected to Witness Significant Growth
- 4. Market Factor Analysis
- 4.1. Porters Five Forces
- 4.2. Supply/Value Chain
- 4.3. PESTEL analysis
- 4.4. Market Entropy
- 4.5. Patent/Trademark Analysis
- 5. Global MEA Plastic Packaging Industry Analysis, Insights and Forecast, 2019-2031
- 5.1. Market Analysis, Insights and Forecast - by Packaging Type
- 5.1.1. Rigid
- 5.1.1.1. By Material
- 5.1.1.1.1. Polyethylene (PE)
- 5.1.1.1.2. Polyethylene Terephthalate (PET)
- 5.1.1.1.3. Polypropylene (PP)
- 5.1.1.1.4. Polystyrene (PS) and Expanded Polystyrene (EPS)
- 5.1.1.1.5. Polyvinyl Chloride (PVC)
- 5.1.1.2. By End-user Industry
- 5.1.1.2.1. Food
- 5.1.1.2.2. Beverage
- 5.1.1.2.3. Healthcare and Pharmaceutical
- 5.1.1.2.4. Cosmetics and Personal Care
- 5.1.1.2.5. Other End-user Industries
- 5.1.1.1. By Material
- 5.1.2. Flexible
- 5.1.2.1. Polyethene (PE)
- 5.1.2.2. Bi-orientated Polypropylene (BOPP)
- 5.1.2.3. Cast Polypropylene (CPP)
- 5.1.2.4. Other Flexible Plastic Packaging Materials
- 5.1.1. Rigid
- 5.2. Market Analysis, Insights and Forecast - by Product
- 5.2.1. Bottles and Jars
- 5.2.2. Tubs, Cups, Bowls, and Trays
- 5.2.3. Intermediate Bulk Containers
- 5.2.4. Pouches
- 5.2.5. Other Products
- 5.3. Market Analysis, Insights and Forecast - by Geography
- 5.3.1. United Arab Emirates
- 5.3.2. Saudi Arabia
- 5.3.3. Egypt
- 5.3.4. South Africa
- 5.3.5. Rest of Middle East and Africa
- 5.4. Market Analysis, Insights and Forecast - by Region
- 5.4.1. United Arab Emirates
- 5.4.2. Saudi Arabia
- 5.4.3. Egypt
- 5.4.4. South Africa
- 5.4.5. Rest of Middle East and Africa
- 5.1. Market Analysis, Insights and Forecast - by Packaging Type
- 6. United Arab Emirates MEA Plastic Packaging Industry Analysis, Insights and Forecast, 2019-2031
- 6.1. Market Analysis, Insights and Forecast - by Packaging Type
- 6.1.1. Rigid
- 6.1.1.1. By Material
- 6.1.1.1.1. Polyethylene (PE)
- 6.1.1.1.2. Polyethylene Terephthalate (PET)
- 6.1.1.1.3. Polypropylene (PP)
- 6.1.1.1.4. Polystyrene (PS) and Expanded Polystyrene (EPS)
- 6.1.1.1.5. Polyvinyl Chloride (PVC)
- 6.1.1.2. By End-user Industry
- 6.1.1.2.1. Food
- 6.1.1.2.2. Beverage
- 6.1.1.2.3. Healthcare and Pharmaceutical
- 6.1.1.2.4. Cosmetics and Personal Care
- 6.1.1.2.5. Other End-user Industries
- 6.1.1.1. By Material
- 6.1.2. Flexible
- 6.1.2.1. Polyethene (PE)
- 6.1.2.2. Bi-orientated Polypropylene (BOPP)
- 6.1.2.3. Cast Polypropylene (CPP)
- 6.1.2.4. Other Flexible Plastic Packaging Materials
- 6.1.1. Rigid
- 6.2. Market Analysis, Insights and Forecast - by Product
- 6.2.1. Bottles and Jars
- 6.2.2. Tubs, Cups, Bowls, and Trays
- 6.2.3. Intermediate Bulk Containers
- 6.2.4. Pouches
- 6.2.5. Other Products
- 6.3. Market Analysis, Insights and Forecast - by Geography
- 6.3.1. United Arab Emirates
- 6.3.2. Saudi Arabia
- 6.3.3. Egypt
- 6.3.4. South Africa
- 6.3.5. Rest of Middle East and Africa
- 6.1. Market Analysis, Insights and Forecast - by Packaging Type
- 7. Saudi Arabia MEA Plastic Packaging Industry Analysis, Insights and Forecast, 2019-2031
- 7.1. Market Analysis, Insights and Forecast - by Packaging Type
- 7.1.1. Rigid
- 7.1.1.1. By Material
- 7.1.1.1.1. Polyethylene (PE)
- 7.1.1.1.2. Polyethylene Terephthalate (PET)
- 7.1.1.1.3. Polypropylene (PP)
- 7.1.1.1.4. Polystyrene (PS) and Expanded Polystyrene (EPS)
- 7.1.1.1.5. Polyvinyl Chloride (PVC)
- 7.1.1.2. By End-user Industry
- 7.1.1.2.1. Food
- 7.1.1.2.2. Beverage
- 7.1.1.2.3. Healthcare and Pharmaceutical
- 7.1.1.2.4. Cosmetics and Personal Care
- 7.1.1.2.5. Other End-user Industries
- 7.1.1.1. By Material
- 7.1.2. Flexible
- 7.1.2.1. Polyethene (PE)
- 7.1.2.2. Bi-orientated Polypropylene (BOPP)
- 7.1.2.3. Cast Polypropylene (CPP)
- 7.1.2.4. Other Flexible Plastic Packaging Materials
- 7.1.1. Rigid
- 7.2. Market Analysis, Insights and Forecast - by Product
- 7.2.1. Bottles and Jars
- 7.2.2. Tubs, Cups, Bowls, and Trays
- 7.2.3. Intermediate Bulk Containers
- 7.2.4. Pouches
- 7.2.5. Other Products
- 7.3. Market Analysis, Insights and Forecast - by Geography
- 7.3.1. United Arab Emirates
- 7.3.2. Saudi Arabia
- 7.3.3. Egypt
- 7.3.4. South Africa
- 7.3.5. Rest of Middle East and Africa
- 7.1. Market Analysis, Insights and Forecast - by Packaging Type
- 8. Egypt MEA Plastic Packaging Industry Analysis, Insights and Forecast, 2019-2031
- 8.1. Market Analysis, Insights and Forecast - by Packaging Type
- 8.1.1. Rigid
- 8.1.1.1. By Material
- 8.1.1.1.1. Polyethylene (PE)
- 8.1.1.1.2. Polyethylene Terephthalate (PET)
- 8.1.1.1.3. Polypropylene (PP)
- 8.1.1.1.4. Polystyrene (PS) and Expanded Polystyrene (EPS)
- 8.1.1.1.5. Polyvinyl Chloride (PVC)
- 8.1.1.2. By End-user Industry
- 8.1.1.2.1. Food
- 8.1.1.2.2. Beverage
- 8.1.1.2.3. Healthcare and Pharmaceutical
- 8.1.1.2.4. Cosmetics and Personal Care
- 8.1.1.2.5. Other End-user Industries
- 8.1.1.1. By Material
- 8.1.2. Flexible
- 8.1.2.1. Polyethene (PE)
- 8.1.2.2. Bi-orientated Polypropylene (BOPP)
- 8.1.2.3. Cast Polypropylene (CPP)
- 8.1.2.4. Other Flexible Plastic Packaging Materials
- 8.1.1. Rigid
- 8.2. Market Analysis, Insights and Forecast - by Product
- 8.2.1. Bottles and Jars
- 8.2.2. Tubs, Cups, Bowls, and Trays
- 8.2.3. Intermediate Bulk Containers
- 8.2.4. Pouches
- 8.2.5. Other Products
- 8.3. Market Analysis, Insights and Forecast - by Geography
- 8.3.1. United Arab Emirates
- 8.3.2. Saudi Arabia
- 8.3.3. Egypt
- 8.3.4. South Africa
- 8.3.5. Rest of Middle East and Africa
- 8.1. Market Analysis, Insights and Forecast - by Packaging Type
- 9. South Africa MEA Plastic Packaging Industry Analysis, Insights and Forecast, 2019-2031
- 9.1. Market Analysis, Insights and Forecast - by Packaging Type
- 9.1.1. Rigid
- 9.1.1.1. By Material
- 9.1.1.1.1. Polyethylene (PE)
- 9.1.1.1.2. Polyethylene Terephthalate (PET)
- 9.1.1.1.3. Polypropylene (PP)
- 9.1.1.1.4. Polystyrene (PS) and Expanded Polystyrene (EPS)
- 9.1.1.1.5. Polyvinyl Chloride (PVC)
- 9.1.1.2. By End-user Industry
- 9.1.1.2.1. Food
- 9.1.1.2.2. Beverage
- 9.1.1.2.3. Healthcare and Pharmaceutical
- 9.1.1.2.4. Cosmetics and Personal Care
- 9.1.1.2.5. Other End-user Industries
- 9.1.1.1. By Material
- 9.1.2. Flexible
- 9.1.2.1. Polyethene (PE)
- 9.1.2.2. Bi-orientated Polypropylene (BOPP)
- 9.1.2.3. Cast Polypropylene (CPP)
- 9.1.2.4. Other Flexible Plastic Packaging Materials
- 9.1.1. Rigid
- 9.2. Market Analysis, Insights and Forecast - by Product
- 9.2.1. Bottles and Jars
- 9.2.2. Tubs, Cups, Bowls, and Trays
- 9.2.3. Intermediate Bulk Containers
- 9.2.4. Pouches
- 9.2.5. Other Products
- 9.3. Market Analysis, Insights and Forecast - by Geography
- 9.3.1. United Arab Emirates
- 9.3.2. Saudi Arabia
- 9.3.3. Egypt
- 9.3.4. South Africa
- 9.3.5. Rest of Middle East and Africa
- 9.1. Market Analysis, Insights and Forecast - by Packaging Type
- 10. Rest of Middle East and Africa MEA Plastic Packaging Industry Analysis, Insights and Forecast, 2019-2031
- 10.1. Market Analysis, Insights and Forecast - by Packaging Type
- 10.1.1. Rigid
- 10.1.1.1. By Material
- 10.1.1.1.1. Polyethylene (PE)
- 10.1.1.1.2. Polyethylene Terephthalate (PET)
- 10.1.1.1.3. Polypropylene (PP)
- 10.1.1.1.4. Polystyrene (PS) and Expanded Polystyrene (EPS)
- 10.1.1.1.5. Polyvinyl Chloride (PVC)
- 10.1.1.2. By End-user Industry
- 10.1.1.2.1. Food
- 10.1.1.2.2. Beverage
- 10.1.1.2.3. Healthcare and Pharmaceutical
- 10.1.1.2.4. Cosmetics and Personal Care
- 10.1.1.2.5. Other End-user Industries
- 10.1.1.1. By Material
- 10.1.2. Flexible
- 10.1.2.1. Polyethene (PE)
- 10.1.2.2. Bi-orientated Polypropylene (BOPP)
- 10.1.2.3. Cast Polypropylene (CPP)
- 10.1.2.4. Other Flexible Plastic Packaging Materials
- 10.1.1. Rigid
- 10.2. Market Analysis, Insights and Forecast - by Product
- 10.2.1. Bottles and Jars
- 10.2.2. Tubs, Cups, Bowls, and Trays
- 10.2.3. Intermediate Bulk Containers
- 10.2.4. Pouches
- 10.2.5. Other Products
- 10.3. Market Analysis, Insights and Forecast - by Geography
- 10.3.1. United Arab Emirates
- 10.3.2. Saudi Arabia
- 10.3.3. Egypt
- 10.3.4. South Africa
- 10.3.5. Rest of Middle East and Africa
- 10.1. Market Analysis, Insights and Forecast - by Packaging Type
- 11. North America MEA Plastic Packaging Industry Analysis, Insights and Forecast, 2019-2031
- 11.1. Market Analysis, Insights and Forecast - By Country/Sub-region
- 11.1.1 United States
- 11.1.2 Canada
- 11.1.3 Mexico
- 12. Europe MEA Plastic Packaging Industry Analysis, Insights and Forecast, 2019-2031
- 12.1. Market Analysis, Insights and Forecast - By Country/Sub-region
- 12.1.1 Germany
- 12.1.2 United Kingdom
- 12.1.3 France
- 12.1.4 Spain
- 12.1.5 Italy
- 12.1.6 Spain
- 12.1.7 Belgium
- 12.1.8 Netherland
- 12.1.9 Nordics
- 12.1.10 Rest of Europe
- 13. Asia Pacific MEA Plastic Packaging Industry Analysis, Insights and Forecast, 2019-2031
- 13.1. Market Analysis, Insights and Forecast - By Country/Sub-region
- 13.1.1 China
- 13.1.2 Japan
- 13.1.3 India
- 13.1.4 South Korea
- 13.1.5 Southeast Asia
- 13.1.6 Australia
- 13.1.7 Indonesia
- 13.1.8 Phillipes
- 13.1.9 Singapore
- 13.1.10 Thailandc
- 13.1.11 Rest of Asia Pacific
- 14. South America MEA Plastic Packaging Industry Analysis, Insights and Forecast, 2019-2031
- 14.1. Market Analysis, Insights and Forecast - By Country/Sub-region
- 14.1.1 Brazil
- 14.1.2 Argentina
- 14.1.3 Peru
- 14.1.4 Chile
- 14.1.5 Colombia
- 14.1.6 Ecuador
- 14.1.7 Venezuela
- 14.1.8 Rest of South America
- 15. North America MEA Plastic Packaging Industry Analysis, Insights and Forecast, 2019-2031
- 15.1. Market Analysis, Insights and Forecast - By Country/Sub-region
- 15.1.1 United States
- 15.1.2 Canada
- 15.1.3 Mexico
- 16. MEA MEA Plastic Packaging Industry Analysis, Insights and Forecast, 2019-2031
- 16.1. Market Analysis, Insights and Forecast - By Country/Sub-region
- 16.1.1 United Arab Emirates
- 16.1.2 Saudi Arabia
- 16.1.3 South Africa
- 16.1.4 Rest of Middle East and Africa
- 17. Competitive Analysis
- 17.1. Global Market Share Analysis 2024
- 17.2. Company Profiles
- 17.2.1 KANR For Plastic Industries
- 17.2.1.1. Overview
- 17.2.1.2. Products
- 17.2.1.3. SWOT Analysis
- 17.2.1.4. Recent Developments
- 17.2.1.5. Financials (Based on Availability)
- 17.2.2 Al Nawakheth Factory Company
- 17.2.2.1. Overview
- 17.2.2.2. Products
- 17.2.2.3. SWOT Analysis
- 17.2.2.4. Recent Developments
- 17.2.2.5. Financials (Based on Availability)
- 17.2.3 Arabian Plastics Industrial Company Limited (APICO)
- 17.2.3.1. Overview
- 17.2.3.2. Products
- 17.2.3.3. SWOT Analysis
- 17.2.3.4. Recent Developments
- 17.2.3.5. Financials (Based on Availability)
- 17.2.4 Napco Group (Napco National)
- 17.2.4.1. Overview
- 17.2.4.2. Products
- 17.2.4.3. SWOT Analysis
- 17.2.4.4. Recent Developments
- 17.2.4.5. Financials (Based on Availability)
- 17.2.5 SABIC - Saudi Basic Industries Corporation
- 17.2.5.1. Overview
- 17.2.5.2. Products
- 17.2.5.3. SWOT Analysis
- 17.2.5.4. Recent Developments
- 17.2.5.5. Financials (Based on Availability)
- 17.2.6 Zamil Plastic Industries Co
- 17.2.6.1. Overview
- 17.2.6.2. Products
- 17.2.6.3. SWOT Analysis
- 17.2.6.4. Recent Developments
- 17.2.6.5. Financials (Based on Availability)
- 17.2.7 Sealed Air Corporation (Sealed Air Saudi Arabia)*List Not Exhaustive
- 17.2.7.1. Overview
- 17.2.7.2. Products
- 17.2.7.3. SWOT Analysis
- 17.2.7.4. Recent Developments
- 17.2.7.5. Financials (Based on Availability)
- 17.2.8 Takween Advanced Industries
- 17.2.8.1. Overview
- 17.2.8.2. Products
- 17.2.8.3. SWOT Analysis
- 17.2.8.4. Recent Developments
- 17.2.8.5. Financials (Based on Availability)
- 17.2.9 AL-Ghandoura Co Manuf Plastic GhanPlast)
- 17.2.9.1. Overview
- 17.2.9.2. Products
- 17.2.9.3. SWOT Analysis
- 17.2.9.4. Recent Developments
- 17.2.9.5. Financials (Based on Availability)
- 17.2.10 Saudi Arabian Packaging Industry WLL (SAPIN)
- 17.2.10.1. Overview
- 17.2.10.2. Products
- 17.2.10.3. SWOT Analysis
- 17.2.10.4. Recent Developments
- 17.2.10.5. Financials (Based on Availability)
- 17.2.11 Saudi Plastic Factory Company
- 17.2.11.1. Overview
- 17.2.11.2. Products
- 17.2.11.3. SWOT Analysis
- 17.2.11.4. Recent Developments
- 17.2.11.5. Financials (Based on Availability)
- 17.2.12 Arnon Plastic Industry Co Ltd
- 17.2.12.1. Overview
- 17.2.12.2. Products
- 17.2.12.3. SWOT Analysis
- 17.2.12.4. Recent Developments
- 17.2.12.5. Financials (Based on Availability)
- 17.2.13 Plastico SPS
- 17.2.13.1. Overview
- 17.2.13.2. Products
- 17.2.13.3. SWOT Analysis
- 17.2.13.4. Recent Developments
- 17.2.13.5. Financials (Based on Availability)
- 17.2.14 Coloredsun
- 17.2.14.1. Overview
- 17.2.14.2. Products
- 17.2.14.3. SWOT Analysis
- 17.2.14.4. Recent Developments
- 17.2.14.5. Financials (Based on Availability)
- 17.2.15 National Plastic Factory LLC
- 17.2.15.1. Overview
- 17.2.15.2. Products
- 17.2.15.3. SWOT Analysis
- 17.2.15.4. Recent Developments
- 17.2.15.5. Financials (Based on Availability)
- 17.2.16 Packaging Products Company (PPC)
- 17.2.16.1. Overview
- 17.2.16.2. Products
- 17.2.16.3. SWOT Analysis
- 17.2.16.4. Recent Developments
- 17.2.16.5. Financials (Based on Availability)
- 17.2.1 KANR For Plastic Industries
List of Figures
- Figure 1: Global MEA Plastic Packaging Industry Revenue Breakdown (Million, %) by Region 2024 & 2032
- Figure 2: North America MEA Plastic Packaging Industry Revenue (Million), by Country 2024 & 2032
- Figure 3: North America MEA Plastic Packaging Industry Revenue Share (%), by Country 2024 & 2032
- Figure 4: Europe MEA Plastic Packaging Industry Revenue (Million), by Country 2024 & 2032
- Figure 5: Europe MEA Plastic Packaging Industry Revenue Share (%), by Country 2024 & 2032
- Figure 6: Asia Pacific MEA Plastic Packaging Industry Revenue (Million), by Country 2024 & 2032
- Figure 7: Asia Pacific MEA Plastic Packaging Industry Revenue Share (%), by Country 2024 & 2032
- Figure 8: South America MEA Plastic Packaging Industry Revenue (Million), by Country 2024 & 2032
- Figure 9: South America MEA Plastic Packaging Industry Revenue Share (%), by Country 2024 & 2032
- Figure 10: North America MEA Plastic Packaging Industry Revenue (Million), by Country 2024 & 2032
- Figure 11: North America MEA Plastic Packaging Industry Revenue Share (%), by Country 2024 & 2032
- Figure 12: MEA MEA Plastic Packaging Industry Revenue (Million), by Country 2024 & 2032
- Figure 13: MEA MEA Plastic Packaging Industry Revenue Share (%), by Country 2024 & 2032
- Figure 14: United Arab Emirates MEA Plastic Packaging Industry Revenue (Million), by Packaging Type 2024 & 2032
- Figure 15: United Arab Emirates MEA Plastic Packaging Industry Revenue Share (%), by Packaging Type 2024 & 2032
- Figure 16: United Arab Emirates MEA Plastic Packaging Industry Revenue (Million), by Product 2024 & 2032
- Figure 17: United Arab Emirates MEA Plastic Packaging Industry Revenue Share (%), by Product 2024 & 2032
- Figure 18: United Arab Emirates MEA Plastic Packaging Industry Revenue (Million), by Geography 2024 & 2032
- Figure 19: United Arab Emirates MEA Plastic Packaging Industry Revenue Share (%), by Geography 2024 & 2032
- Figure 20: United Arab Emirates MEA Plastic Packaging Industry Revenue (Million), by Country 2024 & 2032
- Figure 21: United Arab Emirates MEA Plastic Packaging Industry Revenue Share (%), by Country 2024 & 2032
- Figure 22: Saudi Arabia MEA Plastic Packaging Industry Revenue (Million), by Packaging Type 2024 & 2032
- Figure 23: Saudi Arabia MEA Plastic Packaging Industry Revenue Share (%), by Packaging Type 2024 & 2032
- Figure 24: Saudi Arabia MEA Plastic Packaging Industry Revenue (Million), by Product 2024 & 2032
- Figure 25: Saudi Arabia MEA Plastic Packaging Industry Revenue Share (%), by Product 2024 & 2032
- Figure 26: Saudi Arabia MEA Plastic Packaging Industry Revenue (Million), by Geography 2024 & 2032
- Figure 27: Saudi Arabia MEA Plastic Packaging Industry Revenue Share (%), by Geography 2024 & 2032
- Figure 28: Saudi Arabia MEA Plastic Packaging Industry Revenue (Million), by Country 2024 & 2032
- Figure 29: Saudi Arabia MEA Plastic Packaging Industry Revenue Share (%), by Country 2024 & 2032
- Figure 30: Egypt MEA Plastic Packaging Industry Revenue (Million), by Packaging Type 2024 & 2032
- Figure 31: Egypt MEA Plastic Packaging Industry Revenue Share (%), by Packaging Type 2024 & 2032
- Figure 32: Egypt MEA Plastic Packaging Industry Revenue (Million), by Product 2024 & 2032
- Figure 33: Egypt MEA Plastic Packaging Industry Revenue Share (%), by Product 2024 & 2032
- Figure 34: Egypt MEA Plastic Packaging Industry Revenue (Million), by Geography 2024 & 2032
- Figure 35: Egypt MEA Plastic Packaging Industry Revenue Share (%), by Geography 2024 & 2032
- Figure 36: Egypt MEA Plastic Packaging Industry Revenue (Million), by Country 2024 & 2032
- Figure 37: Egypt MEA Plastic Packaging Industry Revenue Share (%), by Country 2024 & 2032
- Figure 38: South Africa MEA Plastic Packaging Industry Revenue (Million), by Packaging Type 2024 & 2032
- Figure 39: South Africa MEA Plastic Packaging Industry Revenue Share (%), by Packaging Type 2024 & 2032
- Figure 40: South Africa MEA Plastic Packaging Industry Revenue (Million), by Product 2024 & 2032
- Figure 41: South Africa MEA Plastic Packaging Industry Revenue Share (%), by Product 2024 & 2032
- Figure 42: South Africa MEA Plastic Packaging Industry Revenue (Million), by Geography 2024 & 2032
- Figure 43: South Africa MEA Plastic Packaging Industry Revenue Share (%), by Geography 2024 & 2032
- Figure 44: South Africa MEA Plastic Packaging Industry Revenue (Million), by Country 2024 & 2032
- Figure 45: South Africa MEA Plastic Packaging Industry Revenue Share (%), by Country 2024 & 2032
- Figure 46: Rest of Middle East and Africa MEA Plastic Packaging Industry Revenue (Million), by Packaging Type 2024 & 2032
- Figure 47: Rest of Middle East and Africa MEA Plastic Packaging Industry Revenue Share (%), by Packaging Type 2024 & 2032
- Figure 48: Rest of Middle East and Africa MEA Plastic Packaging Industry Revenue (Million), by Product 2024 & 2032
- Figure 49: Rest of Middle East and Africa MEA Plastic Packaging Industry Revenue Share (%), by Product 2024 & 2032
- Figure 50: Rest of Middle East and Africa MEA Plastic Packaging Industry Revenue (Million), by Geography 2024 & 2032
- Figure 51: Rest of Middle East and Africa MEA Plastic Packaging Industry Revenue Share (%), by Geography 2024 & 2032
- Figure 52: Rest of Middle East and Africa MEA Plastic Packaging Industry Revenue (Million), by Country 2024 & 2032
- Figure 53: Rest of Middle East and Africa MEA Plastic Packaging Industry Revenue Share (%), by Country 2024 & 2032
List of Tables
- Table 1: Global MEA Plastic Packaging Industry Revenue Million Forecast, by Region 2019 & 2032
- Table 2: Global MEA Plastic Packaging Industry Revenue Million Forecast, by Packaging Type 2019 & 2032
- Table 3: Global MEA Plastic Packaging Industry Revenue Million Forecast, by Product 2019 & 2032
- Table 4: Global MEA Plastic Packaging Industry Revenue Million Forecast, by Geography 2019 & 2032
- Table 5: Global MEA Plastic Packaging Industry Revenue Million Forecast, by Region 2019 & 2032
- Table 6: Global MEA Plastic Packaging Industry Revenue Million Forecast, by Country 2019 & 2032
- Table 7: United States MEA Plastic Packaging Industry Revenue (Million) Forecast, by Application 2019 & 2032
- Table 8: Canada MEA Plastic Packaging Industry Revenue (Million) Forecast, by Application 2019 & 2032
- Table 9: Mexico MEA Plastic Packaging Industry Revenue (Million) Forecast, by Application 2019 & 2032
- Table 10: Global MEA Plastic Packaging Industry Revenue Million Forecast, by Country 2019 & 2032
- Table 11: Germany MEA Plastic Packaging Industry Revenue (Million) Forecast, by Application 2019 & 2032
- Table 12: United Kingdom MEA Plastic Packaging Industry Revenue (Million) Forecast, by Application 2019 & 2032
- Table 13: France MEA Plastic Packaging Industry Revenue (Million) Forecast, by Application 2019 & 2032
- Table 14: Spain MEA Plastic Packaging Industry Revenue (Million) Forecast, by Application 2019 & 2032
- Table 15: Italy MEA Plastic Packaging Industry Revenue (Million) Forecast, by Application 2019 & 2032
- Table 16: Spain MEA Plastic Packaging Industry Revenue (Million) Forecast, by Application 2019 & 2032
- Table 17: Belgium MEA Plastic Packaging Industry Revenue (Million) Forecast, by Application 2019 & 2032
- Table 18: Netherland MEA Plastic Packaging Industry Revenue (Million) Forecast, by Application 2019 & 2032
- Table 19: Nordics MEA Plastic Packaging Industry Revenue (Million) Forecast, by Application 2019 & 2032
- Table 20: Rest of Europe MEA Plastic Packaging Industry Revenue (Million) Forecast, by Application 2019 & 2032
- Table 21: Global MEA Plastic Packaging Industry Revenue Million Forecast, by Country 2019 & 2032
- Table 22: China MEA Plastic Packaging Industry Revenue (Million) Forecast, by Application 2019 & 2032
- Table 23: Japan MEA Plastic Packaging Industry Revenue (Million) Forecast, by Application 2019 & 2032
- Table 24: India MEA Plastic Packaging Industry Revenue (Million) Forecast, by Application 2019 & 2032
- Table 25: South Korea MEA Plastic Packaging Industry Revenue (Million) Forecast, by Application 2019 & 2032
- Table 26: Southeast Asia MEA Plastic Packaging Industry Revenue (Million) Forecast, by Application 2019 & 2032
- Table 27: Australia MEA Plastic Packaging Industry Revenue (Million) Forecast, by Application 2019 & 2032
- Table 28: Indonesia MEA Plastic Packaging Industry Revenue (Million) Forecast, by Application 2019 & 2032
- Table 29: Phillipes MEA Plastic Packaging Industry Revenue (Million) Forecast, by Application 2019 & 2032
- Table 30: Singapore MEA Plastic Packaging Industry Revenue (Million) Forecast, by Application 2019 & 2032
- Table 31: Thailandc MEA Plastic Packaging Industry Revenue (Million) Forecast, by Application 2019 & 2032
- Table 32: Rest of Asia Pacific MEA Plastic Packaging Industry Revenue (Million) Forecast, by Application 2019 & 2032
- Table 33: Global MEA Plastic Packaging Industry Revenue Million Forecast, by Country 2019 & 2032
- Table 34: Brazil MEA Plastic Packaging Industry Revenue (Million) Forecast, by Application 2019 & 2032
- Table 35: Argentina MEA Plastic Packaging Industry Revenue (Million) Forecast, by Application 2019 & 2032
- Table 36: Peru MEA Plastic Packaging Industry Revenue (Million) Forecast, by Application 2019 & 2032
- Table 37: Chile MEA Plastic Packaging Industry Revenue (Million) Forecast, by Application 2019 & 2032
- Table 38: Colombia MEA Plastic Packaging Industry Revenue (Million) Forecast, by Application 2019 & 2032
- Table 39: Ecuador MEA Plastic Packaging Industry Revenue (Million) Forecast, by Application 2019 & 2032
- Table 40: Venezuela MEA Plastic Packaging Industry Revenue (Million) Forecast, by Application 2019 & 2032
- Table 41: Rest of South America MEA Plastic Packaging Industry Revenue (Million) Forecast, by Application 2019 & 2032
- Table 42: Global MEA Plastic Packaging Industry Revenue Million Forecast, by Country 2019 & 2032
- Table 43: United States MEA Plastic Packaging Industry Revenue (Million) Forecast, by Application 2019 & 2032
- Table 44: Canada MEA Plastic Packaging Industry Revenue (Million) Forecast, by Application 2019 & 2032
- Table 45: Mexico MEA Plastic Packaging Industry Revenue (Million) Forecast, by Application 2019 & 2032
- Table 46: Global MEA Plastic Packaging Industry Revenue Million Forecast, by Country 2019 & 2032
- Table 47: United Arab Emirates MEA Plastic Packaging Industry Revenue (Million) Forecast, by Application 2019 & 2032
- Table 48: Saudi Arabia MEA Plastic Packaging Industry Revenue (Million) Forecast, by Application 2019 & 2032
- Table 49: South Africa MEA Plastic Packaging Industry Revenue (Million) Forecast, by Application 2019 & 2032
- Table 50: Rest of Middle East and Africa MEA Plastic Packaging Industry Revenue (Million) Forecast, by Application 2019 & 2032
- Table 51: Global MEA Plastic Packaging Industry Revenue Million Forecast, by Packaging Type 2019 & 2032
- Table 52: Global MEA Plastic Packaging Industry Revenue Million Forecast, by Product 2019 & 2032
- Table 53: Global MEA Plastic Packaging Industry Revenue Million Forecast, by Geography 2019 & 2032
- Table 54: Global MEA Plastic Packaging Industry Revenue Million Forecast, by Country 2019 & 2032
- Table 55: Global MEA Plastic Packaging Industry Revenue Million Forecast, by Packaging Type 2019 & 2032
- Table 56: Global MEA Plastic Packaging Industry Revenue Million Forecast, by Product 2019 & 2032
- Table 57: Global MEA Plastic Packaging Industry Revenue Million Forecast, by Geography 2019 & 2032
- Table 58: Global MEA Plastic Packaging Industry Revenue Million Forecast, by Country 2019 & 2032
- Table 59: Global MEA Plastic Packaging Industry Revenue Million Forecast, by Packaging Type 2019 & 2032
- Table 60: Global MEA Plastic Packaging Industry Revenue Million Forecast, by Product 2019 & 2032
- Table 61: Global MEA Plastic Packaging Industry Revenue Million Forecast, by Geography 2019 & 2032
- Table 62: Global MEA Plastic Packaging Industry Revenue Million Forecast, by Country 2019 & 2032
- Table 63: Global MEA Plastic Packaging Industry Revenue Million Forecast, by Packaging Type 2019 & 2032
- Table 64: Global MEA Plastic Packaging Industry Revenue Million Forecast, by Product 2019 & 2032
- Table 65: Global MEA Plastic Packaging Industry Revenue Million Forecast, by Geography 2019 & 2032
- Table 66: Global MEA Plastic Packaging Industry Revenue Million Forecast, by Country 2019 & 2032
- Table 67: Global MEA Plastic Packaging Industry Revenue Million Forecast, by Packaging Type 2019 & 2032
- Table 68: Global MEA Plastic Packaging Industry Revenue Million Forecast, by Product 2019 & 2032
- Table 69: Global MEA Plastic Packaging Industry Revenue Million Forecast, by Geography 2019 & 2032
- Table 70: Global MEA Plastic Packaging Industry Revenue Million Forecast, by Country 2019 & 2032
Frequently Asked Questions
1. What is the projected Compound Annual Growth Rate (CAGR) of the MEA Plastic Packaging Industry?
The projected CAGR is approximately 6.54%.
2. Which companies are prominent players in the MEA Plastic Packaging Industry?
Key companies in the market include KANR For Plastic Industries, Al Nawakheth Factory Company, Arabian Plastics Industrial Company Limited (APICO), Napco Group (Napco National), SABIC - Saudi Basic Industries Corporation, Zamil Plastic Industries Co, Sealed Air Corporation (Sealed Air Saudi Arabia)*List Not Exhaustive, Takween Advanced Industries, AL-Ghandoura Co Manuf Plastic GhanPlast), Saudi Arabian Packaging Industry WLL (SAPIN), Saudi Plastic Factory Company, Arnon Plastic Industry Co Ltd, Plastico SPS, Coloredsun, National Plastic Factory LLC, Packaging Products Company (PPC).
3. What are the main segments of the MEA Plastic Packaging Industry?
The market segments include Packaging Type, Product, Geography.
4. Can you provide details about the market size?
The market size is estimated to be USD XX Million as of 2022.
5. What are some drivers contributing to market growth?
Demand for Oxo-Degradable Plastics.
6. What are the notable trends driving market growth?
Flexible Packaging is Expected to Witness Significant Growth.
7. Are there any restraints impacting market growth?
Environmental Concerns Over Recycling and Safe Disposal and Price Volatility of Raw Materials.
8. Can you provide examples of recent developments in the market?
June 2022: Sabic, a global leader in the chemical industry, joined forces with Heinz, Tesco, and Berry in an innovative recycling trial in the United Kingdom designed to close the loop on soft plastic food packaging. Flexible plastic packaging collected from Tesco stores has been used to produce certified circular polypropylene (PP) from Sabic's Trucircle portfolio for microwavable Heinz Beanz Snap Pots, made from 39% recycled soft plastic. Consumers are encouraged to return the soft plastic packaging to collection points at Tesco stores.
9. What pricing options are available for accessing the report?
Pricing options include single-user, multi-user, and enterprise licenses priced at USD 4750, USD 5250, and USD 8750 respectively.
10. Is the market size provided in terms of value or volume?
The market size is provided in terms of value, measured in Million.
11. Are there any specific market keywords associated with the report?
Yes, the market keyword associated with the report is "MEA Plastic Packaging Industry," which aids in identifying and referencing the specific market segment covered.
12. How do I determine which pricing option suits my needs best?
The pricing options vary based on user requirements and access needs. Individual users may opt for single-user licenses, while businesses requiring broader access may choose multi-user or enterprise licenses for cost-effective access to the report.
13. Are there any additional resources or data provided in the MEA Plastic Packaging Industry report?
While the report offers comprehensive insights, it's advisable to review the specific contents or supplementary materials provided to ascertain if additional resources or data are available.
14. How can I stay updated on further developments or reports in the MEA Plastic Packaging Industry?
To stay informed about further developments, trends, and reports in the MEA Plastic Packaging Industry, consider subscribing to industry newsletters, following relevant companies and organizations, or regularly checking reputable industry news sources and publications.
Methodology
Step 1 - Identification of Relevant Samples Size from Population Database


Step 2 - Approaches for Defining Global Market Size (Value, Volume* & Price*)

Note*: In applicable scenarios
Step 3 - Data Sources
Primary Research
- Web Analytics
- Survey Reports
- Research Institute
- Latest Research Reports
- Opinion Leaders
Secondary Research
- Annual Reports
- White Paper
- Latest Press Release
- Industry Association
- Paid Database
- Investor Presentations

Step 4 - Data Triangulation
Involves using different sources of information in order to increase the validity of a study
These sources are likely to be stakeholders in a program - participants, other researchers, program staff, other community members, and so on.
Then we put all data in single framework & apply various statistical tools to find out the dynamic on the market.
During the analysis stage, feedback from the stakeholder groups would be compared to determine areas of agreement as well as areas of divergence


