

Key Insights
The Returnable Transit Packaging (RTP) market is poised for substantial growth, driven by increasing environmental consciousness, stringent regulations regarding waste reduction, and the inherent cost-effectiveness of reusable solutions. With a current market size estimated at $257.7 billion in 2025, the industry is projected to expand at a robust Compound Annual Growth Rate (CAGR) of 7.19% through 2033. This upward trajectory is significantly influenced by the automotive sector's demand for durable and secure packaging, alongside the rapidly growing food and beverage industry's need for hygienic and compliant transport solutions. The adoption of RTP is further propelled by evolving consumer goods markets and the industrial sector's pursuit of operational efficiency. Key materials like plastic and metal are dominating the market due to their durability, reusability, and recyclability, with containers, drums, pallets, and intermediate bulk containers (IBCs) emerging as the most sought-after product types.
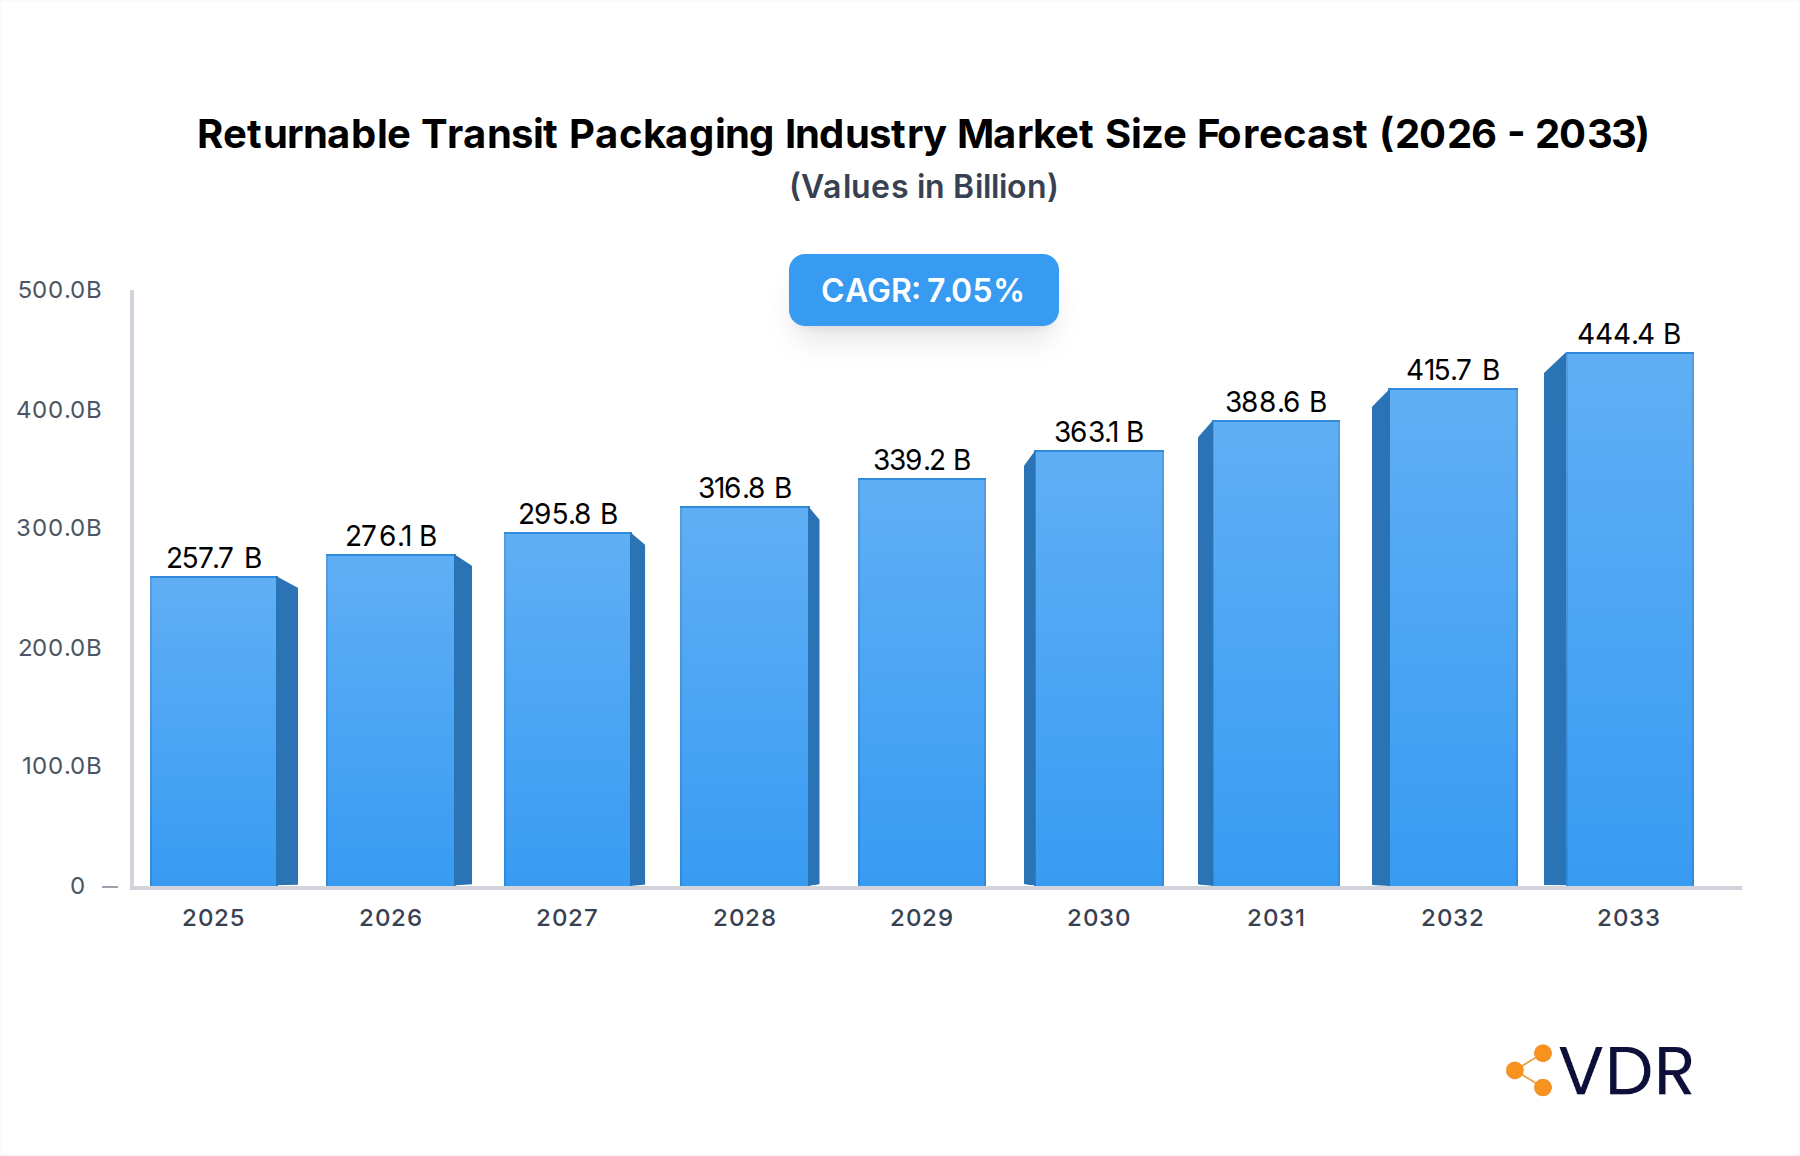
Returnable Transit Packaging Industry Market Size (In Billion)
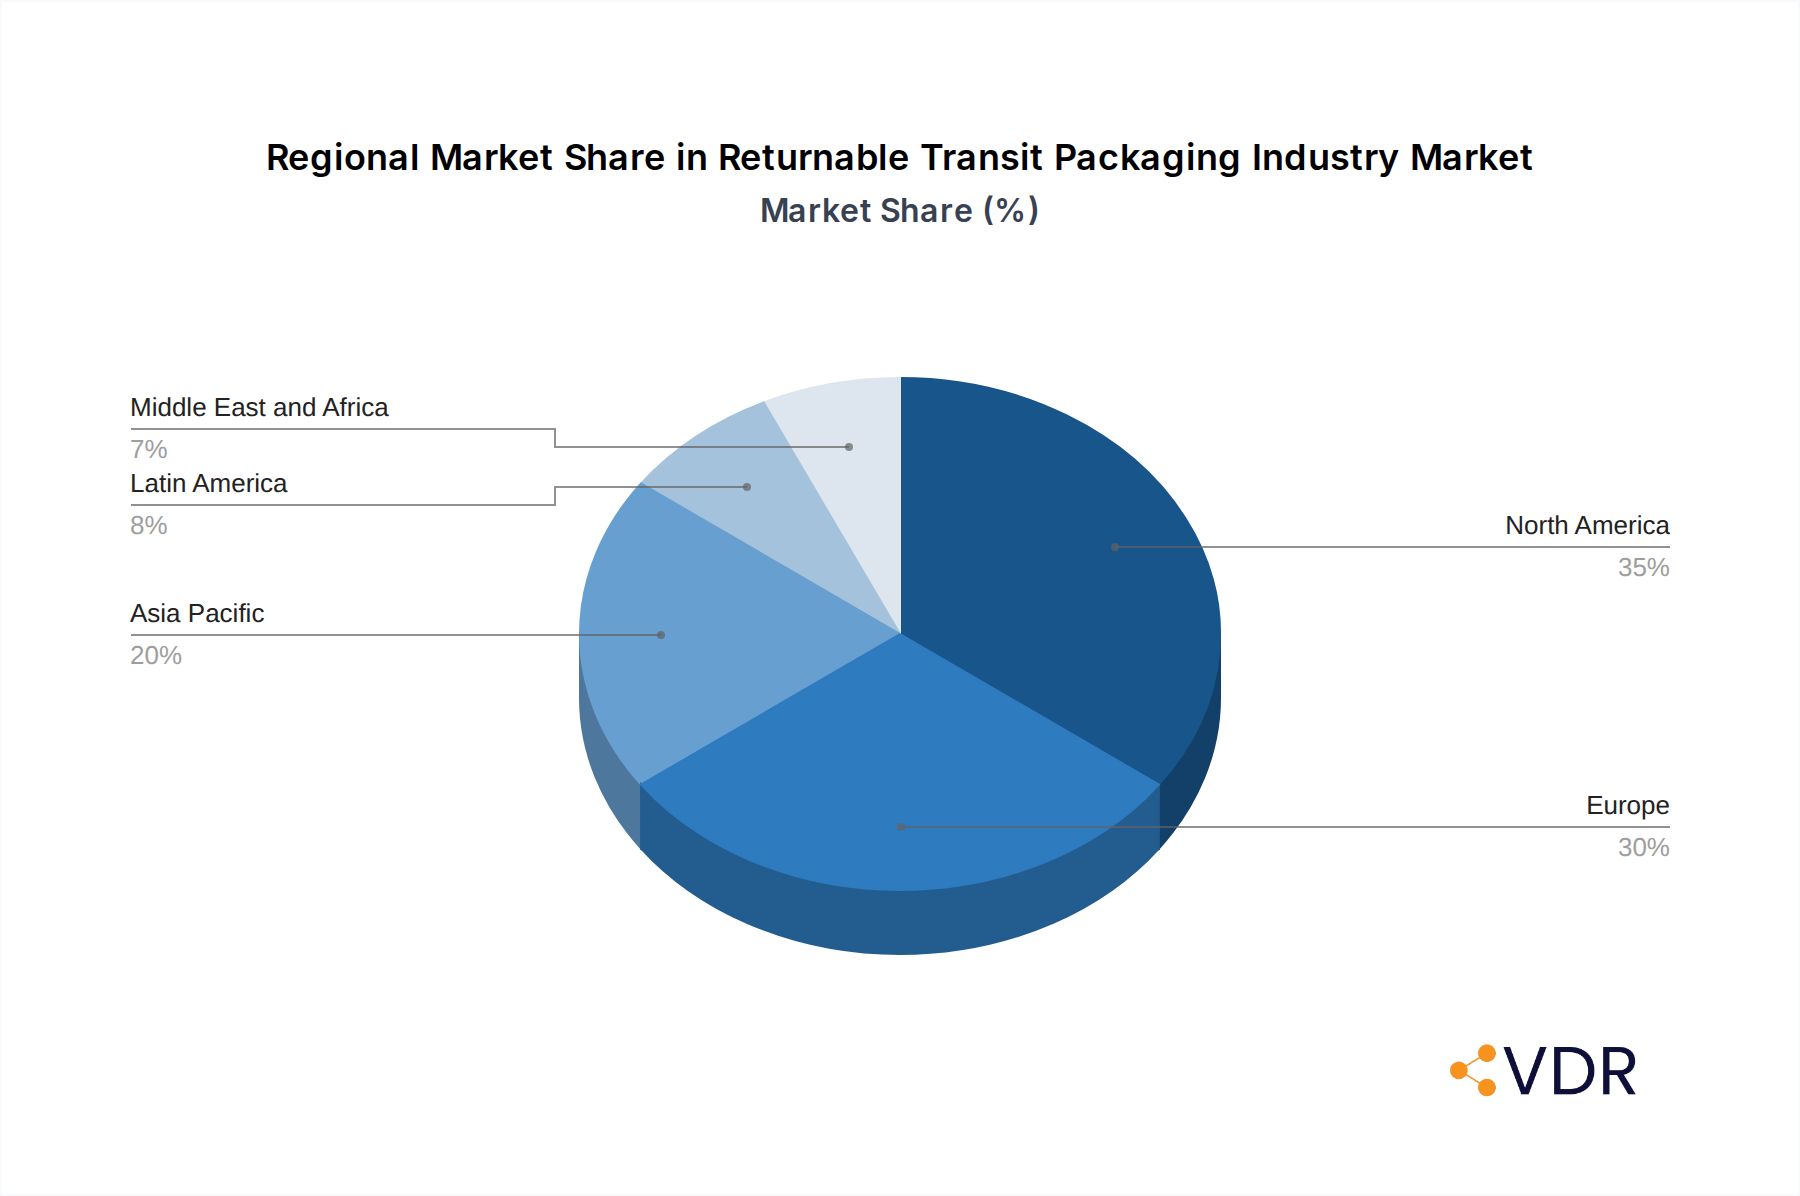
Despite the strong growth drivers, certain restraints, such as the initial capital investment for RTP systems and the complexity of reverse logistics management in some regions, can pose challenges. However, the long-term economic and environmental benefits, including reduced material consumption and waste disposal costs, are increasingly outweighing these initial hurdles. Geographically, North America and Europe are expected to lead the market, owing to well-established infrastructure and strong regulatory frameworks promoting sustainable packaging. The Asia Pacific region, with its burgeoning industrial base and increasing focus on supply chain optimization, presents a significant growth opportunity. Innovations in material science and smart packaging solutions incorporating tracking and monitoring capabilities are expected to further accelerate market penetration and redefine the RTP landscape in the coming years.

Returnable Transit Packaging Industry Company Market Share
Maximize your strategic advantage with this comprehensive Returnable Transit Packaging Industry report. Uncover critical insights into market dynamics, growth trends, and competitive landscapes from 2019 to 2033, with a base year of 2025. This in-depth analysis provides actionable intelligence for manufacturers, suppliers, and end-users navigating the evolving world of sustainable and efficient logistics.
Returnable Transit Packaging Industry Market Dynamics & Structure
The global Returnable Transit Packaging (RTP) industry is characterized by a moderately concentrated market, with key players like Polymer Logistics NV, SSI Schaefer Group, Rehrig Pacific Company, CSI Sertapak Inc, Schoeller Allibert Group BV, Nefab AB, IFCO Systems, Mugele Group, Lamar Packaging Systems, Brambles Limited (CHEP), and Orbis Corporation holding significant market share. Technological innovation is a primary driver, focusing on advanced material science for lighter, more durable RTP solutions and smart tracking technologies for enhanced supply chain visibility. Regulatory frameworks, particularly those promoting sustainability and waste reduction, are increasingly shaping market adoption. Competitive product substitutes, such as single-use packaging, are being challenged by the long-term cost-effectiveness and environmental benefits of RTP. End-user demographics are shifting towards industries prioritizing supply chain efficiency and corporate social responsibility. Mergers and acquisitions (M&A) are a notable trend, facilitating market consolidation and expansion of product portfolios.
- Market Concentration: Moderately concentrated with leading players investing in R&D and global expansion.
- Technological Innovation: Focus on smart RTP, advanced material compositions (e.g., reinforced plastics), and automated handling solutions.
- Regulatory Frameworks: Growing influence of environmental regulations and circular economy initiatives.
- Competitive Substitutes: Declining appeal of single-use packaging due to cost and sustainability concerns.
- End-User Demographics: Increasing demand from sectors with complex supply chains and a focus on sustainability.
- M&A Trends: Strategic acquisitions to enhance product offerings and geographical reach.
Returnable Transit Packaging Industry Growth Trends & Insights
The Returnable Transit Packaging (RTP) industry is poised for significant expansion, driven by a confluence of economic, environmental, and technological factors. From 2019 to 2033, the market size is projected to witness a robust Compound Annual Growth Rate (CAGR) of approximately 7.5%, reaching an estimated value of over $100 billion units by 2033. The base year of 2025 sets the stage for this accelerated growth, with initial market penetration already exceeding 40% in key developed economies. Adoption rates are escalating across various sectors, propelled by the demonstrable cost savings associated with reduced packaging waste, fewer logistics disruptions, and enhanced product protection. Technological disruptions, including the integration of IoT sensors for real-time tracking and condition monitoring of RTP assets, are revolutionizing supply chain management. Consumer behavior shifts towards environmentally conscious purchasing are indirectly influencing businesses to adopt sustainable packaging solutions, further boosting RTP demand. The transition from linear to circular economy models is a fundamental driver, with RTP forming a cornerstone of efficient reusable packaging loops. Furthermore, advancements in material science are leading to the development of lighter, stronger, and more cost-effective RTP solutions, enhancing their appeal across a broader range of applications. The optimization of logistics networks through the use of standardized RTP units is also contributing to greater operational efficiency for businesses. The increasing emphasis on supply chain resilience, especially in light of global disruptions, further underscores the strategic importance of reliable and reusable transit packaging. The projected market penetration is expected to surpass 65% in developed regions and show significant growth in emerging markets by 2033.
Dominant Regions, Countries, or Segments in Returnable Transit Packaging Industry
North America and Europe currently lead the global Returnable Transit Packaging (RTP) industry, driven by stringent environmental regulations, established supply chain infrastructure, and a strong emphasis on sustainability. Within these regions, the Plastic segment for Totes, Trays & Bins dominates, accounting for an estimated 55% of the total market value in 2025. This dominance is attributed to the versatility, durability, and cost-effectiveness of plastic RTP solutions in diverse applications.
Key Drivers in Dominant Segments:
- Plastic Segment:
- High Durability and Longevity: Resists moisture, chemicals, and physical damage, leading to lower replacement costs over time.
- Lightweight Properties: Reduces transportation costs and carbon footprint.
- Hygienic Properties: Ideal for food and beverage and pharmaceutical applications.
- Design Flexibility: Can be molded into various shapes and sizes to meet specific application needs.
- Recyclability: Growing focus on closed-loop recycling programs for plastic RTP.
- Totes, Trays & Bins Product Category:
- Ubiquitous Use: Essential for handling, storage, and transportation of a vast array of goods, from consumer products to industrial components.
- Stackability and Nestability: Optimizes warehouse space and transportation efficiency.
- Compatibility with Automation: Designed for seamless integration with automated warehousing and sorting systems.
- Enhanced Product Protection: Offers superior protection against damage during transit compared to traditional packaging.
- Food and Beverages Application:
- Stringent Hygiene Requirements: Plastic RTP meets the highest standards for cleanliness and food safety.
- Temperature Control: Specialized RTP solutions can maintain optimal temperature for perishable goods.
- Reduced Spoilage: Efficient handling and protection minimize product loss.
- Automotive Application:
- Component Protection: Securely transports sensitive automotive parts, reducing damage and returns.
- Inventory Management: Facilitates efficient Just-In-Time (JIT) delivery systems.
- Cost Savings: Reusable nature significantly cuts down packaging expenses.
The market share for plastic totes, trays, and bins in the food and beverage and automotive sectors alone is projected to represent over 60% of the total RTP market by 2025, with strong growth potential expected in Asia-Pacific as these industries expand. The Metal segment, particularly for pallets and IBCs, also holds a significant share in heavy industrial applications, while Wood RTP continues to find niche uses where cost is a primary concern.
Returnable Transit Packaging Industry Product Landscape
The product landscape of the Returnable Transit Packaging (RTP) industry is characterized by continuous innovation in material science and design. Advanced polymers are enabling the creation of lighter yet more robust containers, drums, barrels, pallets, crates, totes, trays, bins, and Intermediate Bulk Containers (IBCs). Smart features, such as integrated RFID tags and GPS trackers, are becoming standard, offering unparalleled supply chain visibility and asset management. Performance metrics are constantly improving, with enhanced resistance to impact, temperature fluctuations, and chemical exposure. Unique selling propositions often lie in customizability, foldability for space-saving storage, and compatibility with automated handling systems, thereby driving efficiency and reducing operational costs across diverse applications.
Key Drivers, Barriers & Challenges in Returnable Transit Packaging Industry
Key Drivers:
- Environmental Regulations: Government mandates and corporate sustainability goals are pushing for the adoption of reusable packaging.
- Cost Savings: Long-term reduction in packaging and waste disposal expenses.
- Supply Chain Efficiency: Improved handling, reduced damage, and optimized storage.
- Technological Advancements: Smart RTP with tracking and monitoring capabilities.
- Circular Economy Initiatives: Growing emphasis on resource conservation and waste reduction.
Barriers & Challenges:
- Initial Capital Investment: Higher upfront costs compared to single-use packaging.
- Reverse Logistics Complexity: Efficient collection, cleaning, and redistribution of RTP assets.
- Standardization Issues: Lack of universal standards can hinder interoperability.
- Customer Adoption Hesitation: Resistance to change and perceived operational hurdles.
- Contamination Risks: Ensuring proper cleaning and sanitization, particularly in food and healthcare sectors.
Emerging Opportunities in Returnable Transit Packaging Industry
Emerging opportunities in the Returnable Transit Packaging (RTP) industry lie in the expansion of RTP solutions for e-commerce logistics, where robust and reusable packaging can mitigate the environmental impact of increased online retail. The development of specialized RTP for the pharmaceutical and healthcare sectors, focusing on temperature-controlled and sterile solutions, presents significant growth potential. Furthermore, the integration of advanced analytics and AI in RTP management systems can offer predictive maintenance and optimized asset utilization. The burgeoning adoption of RTP in emerging economies, driven by a growing awareness of sustainability and the need for efficient supply chains, represents a vast untapped market. Innovations in biodegradable or bio-based RTP materials also present a promising avenue for environmentally conscious businesses.
Growth Accelerators in the Returnable Transit Packaging Industry Industry
Technological breakthroughs in material science, leading to lighter, more durable, and cost-effective RTP solutions, are significant growth accelerators. Strategic partnerships between RTP manufacturers and logistics providers are enhancing service offerings and expanding market reach. The increasing global focus on circular economy principles and government incentives for sustainable packaging are also powerfully accelerating market growth. Furthermore, market expansion into developing regions, coupled with the rise of advanced automation in warehousing and distribution, is creating new avenues for widespread RTP adoption.
Key Players Shaping the Returnable Transit Packaging Industry Market
- Polymer Logistics NV
- SSI Schaefer Group
- Rehrig Pacific Company
- CSI Sertapak Inc
- Schoeller Allibert Group BV
- Nefab AB
- IFCO Systems
- Mugele Group
- Lamar Packaging Systems
- Brambles Limited (CHEP)
- Orbis Corporation
Notable Milestones in Returnable Transit Packaging Industry Sector
- 2019: Schoeller Allibert Group BV launches its new range of heavy-duty stackable crates designed for enhanced durability and automation.
- 2020: IFCO Systems expands its operations in Asia, introducing its reusable plastic container (RPC) system to new markets.
- 2021: Brambles Limited (CHEP) invests in advanced tracking technology for its pallet pool, enhancing supply chain visibility.
- 2022: Polymer Logistics NV introduces a new line of foldable and nestable crates, optimizing storage and transport efficiency.
- 2023: SSI Schaefer Group announces significant advancements in smart container technology, integrating IoT sensors for real-time data.
- 2024: Rehrig Pacific Company unveils innovative design enhancements for its beverage crates, focusing on improved ergonomics and hygiene.
In-Depth Returnable Transit Packaging Industry Market Outlook
The future outlook for the Returnable Transit Packaging (RTP) industry is exceptionally bright, driven by ongoing global sustainability initiatives and the relentless pursuit of supply chain efficiency. Growth accelerators, including advancements in smart packaging technologies and the expansion of circular economy models, will continue to fuel market expansion. Strategic alliances and market penetration in emerging economies present substantial untapped potential. The industry is set to witness a sustained period of robust growth, transforming how goods are transported and managed across global supply chains.
Returnable Transit Packaging Industry Segmentation
-
1. Material
- 1.1. Plastic
- 1.2. Metal
- 1.3. Wood
-
2. Product
- 2.1. Containers
- 2.2. Drums & Barrels
- 2.3. Pallets
- 2.4. Crates, Totes, Trays & Bins
- 2.5. Intermediate Bulk Containers (IBC's)
- 2.6. Other Product Types
-
3. Application
- 3.1. Automotive
- 3.2. Food and Beverages
- 3.3. Consumer Goods
- 3.4. Industrial
- 3.5. Others
Returnable Transit Packaging Industry Segmentation By Geography
- 1. North America
- 2. Europe
- 3. Asia Pacific
- 4. Latin America
- 5. Middle East and Africa
Returnable Transit Packaging Industry Regional Market Share
Geographic Coverage of Returnable Transit Packaging Industry
Returnable Transit Packaging Industry REPORT HIGHLIGHTS
| Aspects | Details |
|---|---|
| Study Period | 2020-2034 |
| Base Year | 2025 |
| Estimated Year | 2026 |
| Forecast Period | 2026-2034 |
| Historical Period | 2020-2025 |
| Growth Rate | CAGR of 7.19% from 2020-2034 |
| Segmentation |
|
Table of Contents
- 1. Introduction
- 1.1. Research Scope
- 1.2. Market Segmentation
- 1.3. Research Objective
- 1.4. Definitions and Assumptions
- 2. Executive Summary
- 2.1. Market Snapshot
- 3. Market Dynamics
- 3.1. Market Drivers
- 3.2. Market Restrains
- 3.3. Market Trends
- 3.4. Market Opportunities
- 4. Market Factor Analysis
- 4.1. Porters Five Forces
- 4.1.1. Bargaining Power of Suppliers
- 4.1.2. Bargaining Power of Buyers
- 4.1.3. Threat of New Entrants
- 4.1.4. Threat of Substitutes
- 4.1.5. Competitive Rivalry
- 4.2. PESTEL analysis
- 4.3. BCG Analysis
- 4.3.1. Stars (High Growth, High Market Share)
- 4.3.2. Cash Cows (Low Growth, High Market Share)
- 4.3.3. Question Mark (High Growth, Low Market Share)
- 4.3.4. Dogs (Low Growth, Low Market Share)
- 4.4. Ansoff Matrix Analysis
- 4.5. Supply Chain Analysis
- 4.6. Regulatory Landscape
- 4.7. Current Market Potential and Opportunity Assessment (TAM–SAM–SOM Framework)
- 4.8. VDR Analyst Note
- 4.1. Porters Five Forces
- 5. Market Analysis, Insights and Forecast 2021-2033
- 5.1. Market Analysis, Insights and Forecast - by Material
- 5.1.1. Plastic
- 5.1.2. Metal
- 5.1.3. Wood
- 5.2. Market Analysis, Insights and Forecast - by Product
- 5.2.1. Containers
- 5.2.2. Drums & Barrels
- 5.2.3. Pallets
- 5.2.4. Crates, Totes, Trays & Bins
- 5.2.5. Intermediate Bulk Containers (IBC's)
- 5.2.6. Other Product Types
- 5.3. Market Analysis, Insights and Forecast - by Application
- 5.3.1. Automotive
- 5.3.2. Food and Beverages
- 5.3.3. Consumer Goods
- 5.3.4. Industrial
- 5.3.5. Others
- 5.4. Market Analysis, Insights and Forecast - by Region
- 5.4.1. North America
- 5.4.2. Europe
- 5.4.3. Asia Pacific
- 5.4.4. Latin America
- 5.4.5. Middle East and Africa
- 5.1. Market Analysis, Insights and Forecast - by Material
- 6. Global Returnable Transit Packaging Industry Analysis, Insights and Forecast, 2021-2033
- 6.1. Market Analysis, Insights and Forecast - by Material
- 6.1.1. Plastic
- 6.1.2. Metal
- 6.1.3. Wood
- 6.2. Market Analysis, Insights and Forecast - by Product
- 6.2.1. Containers
- 6.2.2. Drums & Barrels
- 6.2.3. Pallets
- 6.2.4. Crates, Totes, Trays & Bins
- 6.2.5. Intermediate Bulk Containers (IBC's)
- 6.2.6. Other Product Types
- 6.3. Market Analysis, Insights and Forecast - by Application
- 6.3.1. Automotive
- 6.3.2. Food and Beverages
- 6.3.3. Consumer Goods
- 6.3.4. Industrial
- 6.3.5. Others
- 6.1. Market Analysis, Insights and Forecast - by Material
- 7. North America Returnable Transit Packaging Industry Analysis, Insights and Forecast, 2021-2033
- 7.1. Market Analysis, Insights and Forecast - by Material
- 7.1.1. Plastic
- 7.1.2. Metal
- 7.1.3. Wood
- 7.2. Market Analysis, Insights and Forecast - by Product
- 7.2.1. Containers
- 7.2.2. Drums & Barrels
- 7.2.3. Pallets
- 7.2.4. Crates, Totes, Trays & Bins
- 7.2.5. Intermediate Bulk Containers (IBC's)
- 7.2.6. Other Product Types
- 7.3. Market Analysis, Insights and Forecast - by Application
- 7.3.1. Automotive
- 7.3.2. Food and Beverages
- 7.3.3. Consumer Goods
- 7.3.4. Industrial
- 7.3.5. Others
- 7.1. Market Analysis, Insights and Forecast - by Material
- 8. Europe Returnable Transit Packaging Industry Analysis, Insights and Forecast, 2021-2033
- 8.1. Market Analysis, Insights and Forecast - by Material
- 8.1.1. Plastic
- 8.1.2. Metal
- 8.1.3. Wood
- 8.2. Market Analysis, Insights and Forecast - by Product
- 8.2.1. Containers
- 8.2.2. Drums & Barrels
- 8.2.3. Pallets
- 8.2.4. Crates, Totes, Trays & Bins
- 8.2.5. Intermediate Bulk Containers (IBC's)
- 8.2.6. Other Product Types
- 8.3. Market Analysis, Insights and Forecast - by Application
- 8.3.1. Automotive
- 8.3.2. Food and Beverages
- 8.3.3. Consumer Goods
- 8.3.4. Industrial
- 8.3.5. Others
- 8.1. Market Analysis, Insights and Forecast - by Material
- 9. Asia Pacific Returnable Transit Packaging Industry Analysis, Insights and Forecast, 2021-2033
- 9.1. Market Analysis, Insights and Forecast - by Material
- 9.1.1. Plastic
- 9.1.2. Metal
- 9.1.3. Wood
- 9.2. Market Analysis, Insights and Forecast - by Product
- 9.2.1. Containers
- 9.2.2. Drums & Barrels
- 9.2.3. Pallets
- 9.2.4. Crates, Totes, Trays & Bins
- 9.2.5. Intermediate Bulk Containers (IBC's)
- 9.2.6. Other Product Types
- 9.3. Market Analysis, Insights and Forecast - by Application
- 9.3.1. Automotive
- 9.3.2. Food and Beverages
- 9.3.3. Consumer Goods
- 9.3.4. Industrial
- 9.3.5. Others
- 9.1. Market Analysis, Insights and Forecast - by Material
- 10. Latin America Returnable Transit Packaging Industry Analysis, Insights and Forecast, 2021-2033
- 10.1. Market Analysis, Insights and Forecast - by Material
- 10.1.1. Plastic
- 10.1.2. Metal
- 10.1.3. Wood
- 10.2. Market Analysis, Insights and Forecast - by Product
- 10.2.1. Containers
- 10.2.2. Drums & Barrels
- 10.2.3. Pallets
- 10.2.4. Crates, Totes, Trays & Bins
- 10.2.5. Intermediate Bulk Containers (IBC's)
- 10.2.6. Other Product Types
- 10.3. Market Analysis, Insights and Forecast - by Application
- 10.3.1. Automotive
- 10.3.2. Food and Beverages
- 10.3.3. Consumer Goods
- 10.3.4. Industrial
- 10.3.5. Others
- 10.1. Market Analysis, Insights and Forecast - by Material
- 11. Middle East and Africa Returnable Transit Packaging Industry Analysis, Insights and Forecast, 2021-2033
- 11.1. Market Analysis, Insights and Forecast - by Material
- 11.1.1. Plastic
- 11.1.2. Metal
- 11.1.3. Wood
- 11.2. Market Analysis, Insights and Forecast - by Product
- 11.2.1. Containers
- 11.2.2. Drums & Barrels
- 11.2.3. Pallets
- 11.2.4. Crates, Totes, Trays & Bins
- 11.2.5. Intermediate Bulk Containers (IBC's)
- 11.2.6. Other Product Types
- 11.3. Market Analysis, Insights and Forecast - by Application
- 11.3.1. Automotive
- 11.3.2. Food and Beverages
- 11.3.3. Consumer Goods
- 11.3.4. Industrial
- 11.3.5. Others
- 11.1. Market Analysis, Insights and Forecast - by Material
- 12. Competitive Analysis
- 12.1. Company Profiles
- 12.1.1 Polymer Logistics NV
- 12.1.1.1. Company Overview
- 12.1.1.2. Products
- 12.1.1.3. Company Financials
- 12.1.1.4. SWOT Analysis
- 12.1.2 SSI Schaefer Group
- 12.1.2.1. Company Overview
- 12.1.2.2. Products
- 12.1.2.3. Company Financials
- 12.1.2.4. SWOT Analysis
- 12.1.3 Rehrig Pacific Company
- 12.1.3.1. Company Overview
- 12.1.3.2. Products
- 12.1.3.3. Company Financials
- 12.1.3.4. SWOT Analysis
- 12.1.4 CSI Sertapak Inc
- 12.1.4.1. Company Overview
- 12.1.4.2. Products
- 12.1.4.3. Company Financials
- 12.1.4.4. SWOT Analysis
- 12.1.5 Schoeller Allibert Group BV
- 12.1.5.1. Company Overview
- 12.1.5.2. Products
- 12.1.5.3. Company Financials
- 12.1.5.4. SWOT Analysis
- 12.1.6 Nefab AB
- 12.1.6.1. Company Overview
- 12.1.6.2. Products
- 12.1.6.3. Company Financials
- 12.1.6.4. SWOT Analysis
- 12.1.7 IFCO Systems
- 12.1.7.1. Company Overview
- 12.1.7.2. Products
- 12.1.7.3. Company Financials
- 12.1.7.4. SWOT Analysis
- 12.1.8 Mugele Group
- 12.1.8.1. Company Overview
- 12.1.8.2. Products
- 12.1.8.3. Company Financials
- 12.1.8.4. SWOT Analysis
- 12.1.9 Lamar Packaging Systems
- 12.1.9.1. Company Overview
- 12.1.9.2. Products
- 12.1.9.3. Company Financials
- 12.1.9.4. SWOT Analysis
- 12.1.10 Brambles Limited (CHEP
- 12.1.10.1. Company Overview
- 12.1.10.2. Products
- 12.1.10.3. Company Financials
- 12.1.10.4. SWOT Analysis
- 12.1.11 Orbis Corporation
- 12.1.11.1. Company Overview
- 12.1.11.2. Products
- 12.1.11.3. Company Financials
- 12.1.11.4. SWOT Analysis
- 12.1.1 Polymer Logistics NV
- 12.2. Market Entropy
- 12.2.1 Company's Key Areas Served
- 12.2.2 Recent Developments
- 12.3. Company Market Share Analysis 2025
- 12.3.1 Top 5 Companies Market Share Analysis
- 12.3.2 Top 3 Companies Market Share Analysis
- 12.4. List of Potential Customers
- 13. Research Methodology
List of Figures
- Figure 1: Global Returnable Transit Packaging Industry Revenue Breakdown (billion, %) by Region 2025 & 2033
- Figure 2: North America Returnable Transit Packaging Industry Revenue (billion), by Material 2025 & 2033
- Figure 3: North America Returnable Transit Packaging Industry Revenue Share (%), by Material 2025 & 2033
- Figure 4: North America Returnable Transit Packaging Industry Revenue (billion), by Product 2025 & 2033
- Figure 5: North America Returnable Transit Packaging Industry Revenue Share (%), by Product 2025 & 2033
- Figure 6: North America Returnable Transit Packaging Industry Revenue (billion), by Application 2025 & 2033
- Figure 7: North America Returnable Transit Packaging Industry Revenue Share (%), by Application 2025 & 2033
- Figure 8: North America Returnable Transit Packaging Industry Revenue (billion), by Country 2025 & 2033
- Figure 9: North America Returnable Transit Packaging Industry Revenue Share (%), by Country 2025 & 2033
- Figure 10: Europe Returnable Transit Packaging Industry Revenue (billion), by Material 2025 & 2033
- Figure 11: Europe Returnable Transit Packaging Industry Revenue Share (%), by Material 2025 & 2033
- Figure 12: Europe Returnable Transit Packaging Industry Revenue (billion), by Product 2025 & 2033
- Figure 13: Europe Returnable Transit Packaging Industry Revenue Share (%), by Product 2025 & 2033
- Figure 14: Europe Returnable Transit Packaging Industry Revenue (billion), by Application 2025 & 2033
- Figure 15: Europe Returnable Transit Packaging Industry Revenue Share (%), by Application 2025 & 2033
- Figure 16: Europe Returnable Transit Packaging Industry Revenue (billion), by Country 2025 & 2033
- Figure 17: Europe Returnable Transit Packaging Industry Revenue Share (%), by Country 2025 & 2033
- Figure 18: Asia Pacific Returnable Transit Packaging Industry Revenue (billion), by Material 2025 & 2033
- Figure 19: Asia Pacific Returnable Transit Packaging Industry Revenue Share (%), by Material 2025 & 2033
- Figure 20: Asia Pacific Returnable Transit Packaging Industry Revenue (billion), by Product 2025 & 2033
- Figure 21: Asia Pacific Returnable Transit Packaging Industry Revenue Share (%), by Product 2025 & 2033
- Figure 22: Asia Pacific Returnable Transit Packaging Industry Revenue (billion), by Application 2025 & 2033
- Figure 23: Asia Pacific Returnable Transit Packaging Industry Revenue Share (%), by Application 2025 & 2033
- Figure 24: Asia Pacific Returnable Transit Packaging Industry Revenue (billion), by Country 2025 & 2033
- Figure 25: Asia Pacific Returnable Transit Packaging Industry Revenue Share (%), by Country 2025 & 2033
- Figure 26: Latin America Returnable Transit Packaging Industry Revenue (billion), by Material 2025 & 2033
- Figure 27: Latin America Returnable Transit Packaging Industry Revenue Share (%), by Material 2025 & 2033
- Figure 28: Latin America Returnable Transit Packaging Industry Revenue (billion), by Product 2025 & 2033
- Figure 29: Latin America Returnable Transit Packaging Industry Revenue Share (%), by Product 2025 & 2033
- Figure 30: Latin America Returnable Transit Packaging Industry Revenue (billion), by Application 2025 & 2033
- Figure 31: Latin America Returnable Transit Packaging Industry Revenue Share (%), by Application 2025 & 2033
- Figure 32: Latin America Returnable Transit Packaging Industry Revenue (billion), by Country 2025 & 2033
- Figure 33: Latin America Returnable Transit Packaging Industry Revenue Share (%), by Country 2025 & 2033
- Figure 34: Middle East and Africa Returnable Transit Packaging Industry Revenue (billion), by Material 2025 & 2033
- Figure 35: Middle East and Africa Returnable Transit Packaging Industry Revenue Share (%), by Material 2025 & 2033
- Figure 36: Middle East and Africa Returnable Transit Packaging Industry Revenue (billion), by Product 2025 & 2033
- Figure 37: Middle East and Africa Returnable Transit Packaging Industry Revenue Share (%), by Product 2025 & 2033
- Figure 38: Middle East and Africa Returnable Transit Packaging Industry Revenue (billion), by Application 2025 & 2033
- Figure 39: Middle East and Africa Returnable Transit Packaging Industry Revenue Share (%), by Application 2025 & 2033
- Figure 40: Middle East and Africa Returnable Transit Packaging Industry Revenue (billion), by Country 2025 & 2033
- Figure 41: Middle East and Africa Returnable Transit Packaging Industry Revenue Share (%), by Country 2025 & 2033
List of Tables
- Table 1: Global Returnable Transit Packaging Industry Revenue billion Forecast, by Material 2020 & 2033
- Table 2: Global Returnable Transit Packaging Industry Revenue billion Forecast, by Product 2020 & 2033
- Table 3: Global Returnable Transit Packaging Industry Revenue billion Forecast, by Application 2020 & 2033
- Table 4: Global Returnable Transit Packaging Industry Revenue billion Forecast, by Region 2020 & 2033
- Table 5: Global Returnable Transit Packaging Industry Revenue billion Forecast, by Material 2020 & 2033
- Table 6: Global Returnable Transit Packaging Industry Revenue billion Forecast, by Product 2020 & 2033
- Table 7: Global Returnable Transit Packaging Industry Revenue billion Forecast, by Application 2020 & 2033
- Table 8: Global Returnable Transit Packaging Industry Revenue billion Forecast, by Country 2020 & 2033
- Table 9: Global Returnable Transit Packaging Industry Revenue billion Forecast, by Material 2020 & 2033
- Table 10: Global Returnable Transit Packaging Industry Revenue billion Forecast, by Product 2020 & 2033
- Table 11: Global Returnable Transit Packaging Industry Revenue billion Forecast, by Application 2020 & 2033
- Table 12: Global Returnable Transit Packaging Industry Revenue billion Forecast, by Country 2020 & 2033
- Table 13: Global Returnable Transit Packaging Industry Revenue billion Forecast, by Material 2020 & 2033
- Table 14: Global Returnable Transit Packaging Industry Revenue billion Forecast, by Product 2020 & 2033
- Table 15: Global Returnable Transit Packaging Industry Revenue billion Forecast, by Application 2020 & 2033
- Table 16: Global Returnable Transit Packaging Industry Revenue billion Forecast, by Country 2020 & 2033
- Table 17: Global Returnable Transit Packaging Industry Revenue billion Forecast, by Material 2020 & 2033
- Table 18: Global Returnable Transit Packaging Industry Revenue billion Forecast, by Product 2020 & 2033
- Table 19: Global Returnable Transit Packaging Industry Revenue billion Forecast, by Application 2020 & 2033
- Table 20: Global Returnable Transit Packaging Industry Revenue billion Forecast, by Country 2020 & 2033
- Table 21: Global Returnable Transit Packaging Industry Revenue billion Forecast, by Material 2020 & 2033
- Table 22: Global Returnable Transit Packaging Industry Revenue billion Forecast, by Product 2020 & 2033
- Table 23: Global Returnable Transit Packaging Industry Revenue billion Forecast, by Application 2020 & 2033
- Table 24: Global Returnable Transit Packaging Industry Revenue billion Forecast, by Country 2020 & 2033
Frequently Asked Questions
1. What is the projected Compound Annual Growth Rate (CAGR) of the Returnable Transit Packaging Industry?
The projected CAGR is approximately 7.19%.
2. Which companies are prominent players in the Returnable Transit Packaging Industry?
Key companies in the market include Polymer Logistics NV, SSI Schaefer Group, Rehrig Pacific Company, CSI Sertapak Inc, Schoeller Allibert Group BV, Nefab AB, IFCO Systems, Mugele Group, Lamar Packaging Systems, Brambles Limited (CHEP, Orbis Corporation.
3. What are the main segments of the Returnable Transit Packaging Industry?
The market segments include Material, Product, Application.
4. Can you provide details about the market size?
The market size is estimated to be USD 257.7 billion as of 2022.
5. What are some drivers contributing to market growth?
; Demand for RTP from F&B. and Textile Industries; Stringent Government Regulations by the Government.
6. What are the notable trends driving market growth?
Drums and Barrels to Witness Significant Market Growth.
7. Are there any restraints impacting market growth?
; High Initial Costs to Setup and Buying all Kinds of Matericals.
8. Can you provide examples of recent developments in the market?
N/A
9. What pricing options are available for accessing the report?
Pricing options include single-user, multi-user, and enterprise licenses priced at USD 4750, USD 5250, and USD 8750 respectively.
10. Is the market size provided in terms of value or volume?
The market size is provided in terms of value, measured in billion.
11. Are there any specific market keywords associated with the report?
Yes, the market keyword associated with the report is "Returnable Transit Packaging Industry," which aids in identifying and referencing the specific market segment covered.
12. How do I determine which pricing option suits my needs best?
The pricing options vary based on user requirements and access needs. Individual users may opt for single-user licenses, while businesses requiring broader access may choose multi-user or enterprise licenses for cost-effective access to the report.
13. Are there any additional resources or data provided in the Returnable Transit Packaging Industry report?
While the report offers comprehensive insights, it's advisable to review the specific contents or supplementary materials provided to ascertain if additional resources or data are available.
14. How can I stay updated on further developments or reports in the Returnable Transit Packaging Industry?
To stay informed about further developments, trends, and reports in the Returnable Transit Packaging Industry, consider subscribing to industry newsletters, following relevant companies and organizations, or regularly checking reputable industry news sources and publications.
Methodology
Step 1 - Identification of Relevant Samples Size from Population Database


Step 2 - Approaches for Defining Global Market Size (Value, Volume* & Price*)

Note*: In applicable scenarios
Step 3 - Data Sources
Primary Research
- Web Analytics
- Survey Reports
- Research Institute
- Latest Research Reports
- Opinion Leaders
Secondary Research
- Annual Reports
- White Paper
- Latest Press Release
- Industry Association
- Paid Database
- Investor Presentations

Step 4 - Data Triangulation
Involves using different sources of information in order to increase the validity of a study
These sources are likely to be stakeholders in a program - participants, other researchers, program staff, other community members, and so on.
Then we put all data in single framework & apply various statistical tools to find out the dynamic on the market.
During the analysis stage, feedback from the stakeholder groups would be compared to determine areas of agreement as well as areas of divergence