
Key Insights
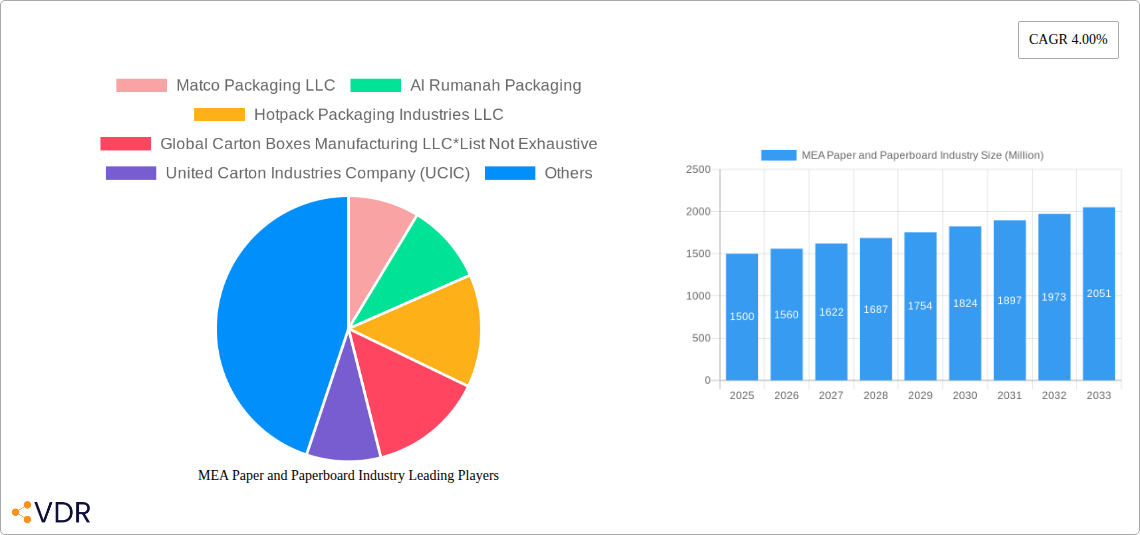
The Middle East and Africa (MEA) paper and paperboard industry is experiencing steady growth, projected at a 4.00% CAGR from 2025 to 2033. This expansion is fueled by several key factors. The burgeoning processed food and beverage sectors in the region are driving significant demand for packaging materials, contributing substantially to market growth. Increased consumer spending, particularly in rapidly urbanizing areas like the UAE and Saudi Arabia, further fuels this demand. Furthermore, the growing e-commerce sector necessitates more packaging solutions, bolstering industry growth. While the industry faces challenges such as fluctuating raw material prices and competition from alternative packaging materials like plastics, the overall market outlook remains positive. Government initiatives promoting sustainable packaging and waste management in countries like Turkey are also creating opportunities for environmentally friendly paper and paperboard solutions. The segmentation by end-user industry reveals that processed foods, fresh produce, and beverages are major consumers, indicating a close correlation between food consumption trends and packaging demand. The regional breakdown highlights the UAE, Saudi Arabia, and Turkey as key markets within the MEA region, reflecting their higher levels of economic development and consumer spending.
The competitive landscape is characterized by a mix of both established international players and regional manufacturers. International Paper and other global firms leverage their established distribution networks and technological expertise, while local companies like Matco Packaging LLC and Al Rumanah Packaging cater to specific regional needs and preferences. The ongoing investment in advanced packaging technologies and sustainability initiatives within the industry signals a commitment to meeting evolving consumer demands and environmental regulations. This, in conjunction with the consistent growth of key sectors like food and beverage, and the expansion of e-commerce, positions the MEA paper and paperboard industry for continued growth in the coming years. Given the predicted growth rate, the market size in 2033 is estimated to be significantly larger than its 2025 value, reflecting the cumulative impact of the drivers mentioned above. Precise figures, however, would require more detailed initial market size data.
MEA Paper and Paperboard Industry Market Report: 2019-2033
This comprehensive report provides an in-depth analysis of the Middle East and Africa (MEA) paper and paperboard industry, covering market dynamics, growth trends, dominant segments, and key players. The report utilizes data from the historical period (2019-2024), base year (2025), and estimated year (2025) to forecast market performance from 2025 to 2033. This insightful resource is essential for industry professionals, investors, and strategic decision-makers seeking to understand and capitalize on opportunities within this dynamic market.
MEA Paper and Paperboard Industry Market Dynamics & Structure
This section analyzes the MEA paper and paperboard market's competitive landscape, technological advancements, regulatory environment, and market trends. The market size in 2025 is estimated at XX Million, with a projected CAGR of XX% from 2025 to 2033.
- Market Concentration: The MEA paper and paperboard market exhibits a moderately concentrated structure, with key players holding significant market share. The top five players account for approximately XX% of the total market in 2025.
- Technological Innovation: Technological advancements, such as improved paper production techniques and sustainable packaging solutions, are driving market growth. However, the high capital investment required for new technologies presents a barrier to entry for smaller players.
- Regulatory Framework: Government regulations focusing on sustainability and environmental protection significantly influence the industry. Compliance with these regulations drives innovation in eco-friendly packaging materials.
- Competitive Product Substitutes: Plastic and other alternative packaging materials pose a competitive threat, although increasing environmental concerns are boosting demand for paper-based alternatives.
- End-User Demographics: The growing population and rising disposable incomes across the MEA region fuel demand for packaged goods, thereby increasing paper and paperboard consumption. Shifting consumer preferences towards convenient and sustainable packaging also contribute to growth.
- M&A Trends: The MEA paper and paperboard industry has witnessed a moderate level of mergers and acquisitions activity in recent years. The number of M&A deals is estimated at XX in the period 2019-2024, driven by strategies to expand market reach and enhance product offerings.
MEA Paper and Paperboard Industry Growth Trends & Insights
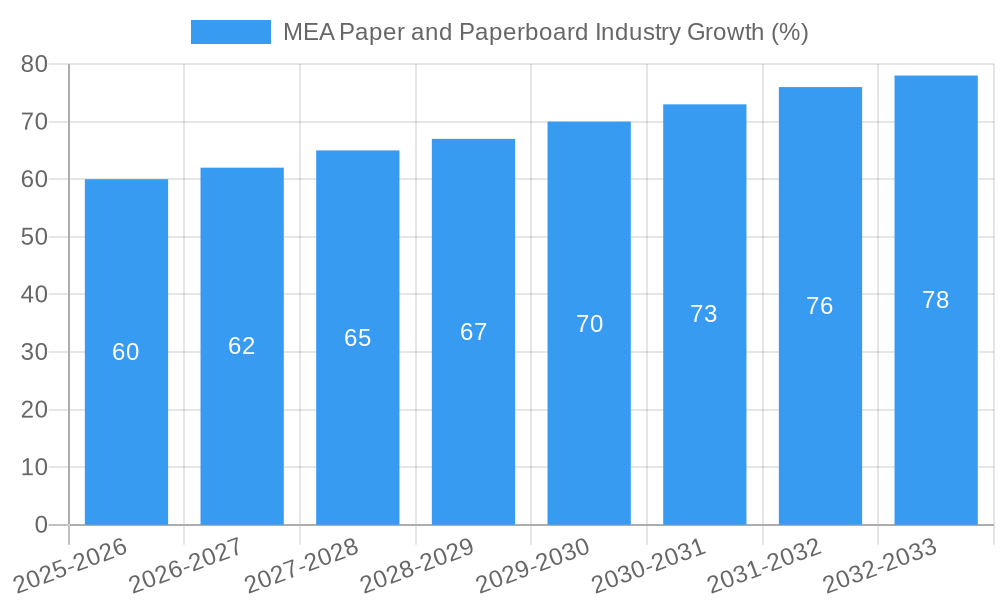
The MEA paper and paperboard market demonstrates strong growth potential driven by factors such as rising urbanization, increasing consumer spending, and expanding industrial sectors. The market witnessed substantial growth during the historical period (2019-2024), with a CAGR of XX%. This upward trajectory is expected to continue throughout the forecast period (2025-2033), fueled by robust demand from various end-user industries. Technological disruptions, such as the adoption of advanced printing techniques and automation in manufacturing, are also contributing to market growth. Consumer behavior shifts towards environmentally friendly packaging are reshaping the product landscape and pushing innovation in sustainable packaging solutions. The market penetration of recycled paperboard is also increasing, further driving sustainable practices within the industry.
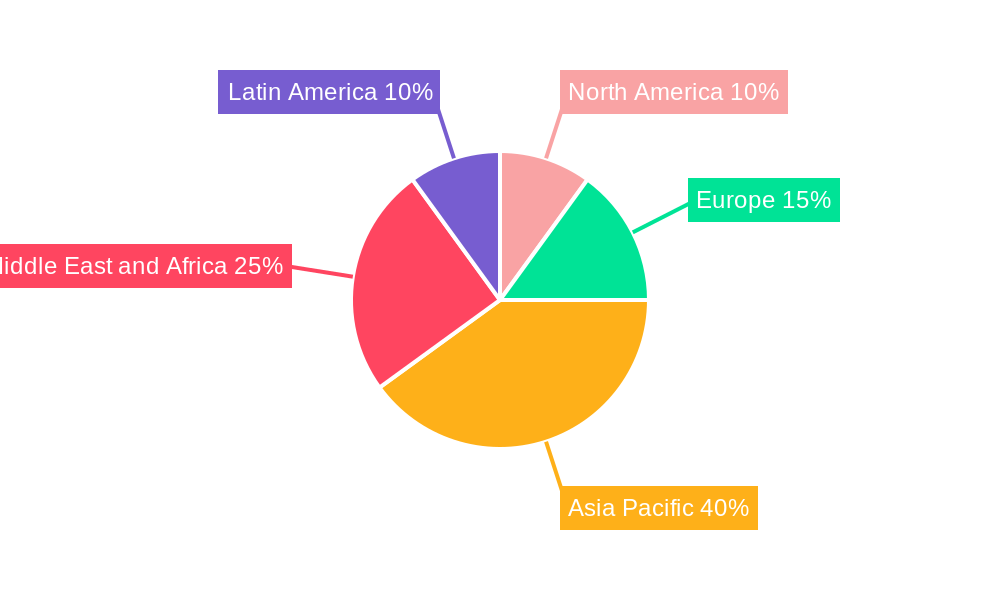
Dominant Regions, Countries, or Segments in MEA Paper and Paperboard Industry
The United Arab Emirates (UAE) and Saudi Arabia dominate the MEA paper and paperboard market, followed by Turkey and the Rest of MEA.
- UAE: The UAE's well-established infrastructure, robust economy, and high per capita consumption drive market growth. The high concentration of major food and beverage companies also contributes to the demand for packaging materials.
- Saudi Arabia: Saudi Arabia's growing population and expanding food processing industry significantly contribute to the region's high demand for paper and paperboard products. Government initiatives aimed at promoting economic diversification further stimulate growth.
- Turkey: Turkey's significant industrial base and its position as a major exporter of paper and paperboard products contribute to its prominent position in the market.
- Rest of MEA: The Rest of MEA region shows steady growth, although at a lower rate than the leading countries.
By end-user industry, the processed food and beverage segments are the largest consumers of paper and paperboard, owing to the increased demand for packaged food and beverages.
MEA Paper and Paperboard Industry Product Landscape
The MEA paper and paperboard market offers a diverse range of products, including corrugated boxes, folding cartons, paper bags, and specialty paper. Innovation focuses on enhancing product performance (e.g., improved strength and durability), sustainability (e.g., recycled content), and cost-effectiveness. The growing demand for customized packaging solutions and eco-friendly options is driving product diversification and development. Advancements in printing technologies are also contributing to the aesthetic appeal and functionality of paperboard products.
Key Drivers, Barriers & Challenges in MEA Paper and Paperboard Industry
Key Drivers:
- Rising disposable incomes and population growth.
- Expanding food processing, beverage, and consumer goods industries.
- Government initiatives promoting industrial growth and infrastructure development.
Key Challenges:
- Fluctuations in raw material prices (e.g., pulp) impact profitability.
- Stringent environmental regulations increase production costs.
- Competition from substitute materials, such as plastics. This accounts for approximately XX% of the market share.
Emerging Opportunities in MEA Paper and Paperboard Industry
Emerging opportunities include:
- Growing demand for sustainable and eco-friendly packaging solutions.
- Expanding e-commerce sector boosting demand for shipping materials.
- Increasing adoption of customized and value-added packaging.
Growth Accelerators in the MEA Paper and Paperboard Industry Industry
Technological advancements, strategic partnerships, and market expansion into untapped segments are key growth catalysts. Investments in sustainable production processes and the development of innovative packaging solutions are further driving industry growth.
Key Players Shaping the MEA Paper and Paperboard Industry Market
- Matco Packaging LLC
- Al Rumanah Packaging
- Hotpack Packaging Industries LLC
- Global Carton Boxes Manufacturing LLC
- United Carton Industries Company (UCIC)
- IFFCO
- Tarboosh Packaging Co LLC
- Green Packaging Boxes Ind LLC
- Arabian Packaging Co LLC
- International Paper
Notable Milestones in MEA Paper and Paperboard Industry Sector
- 2022: Introduction of a new recycled paperboard product by a major player.
- 2021: Successful merger between two regional packaging companies.
- 2020: Implementation of new environmental regulations impacting the industry.
(Further milestones to be added based on available data)
In-Depth MEA Paper and Paperboard Industry Market Outlook
The MEA paper and paperboard market presents substantial long-term growth prospects. Continued economic growth, expanding consumer base, and increasing demand for sustainable packaging solutions will fuel market expansion. Strategic partnerships, technological innovations, and aggressive market penetration strategies will be crucial for players seeking to capitalize on this growth potential. The market is projected to reach XX Million by 2033.
MEA Paper and Paperboard Industry Segmentation
-
1. Type
- 1.1. Printing and Writing
- 1.2. Newsprint
- 1.3. Tissue
- 1.4. Cartonboard
- 1.5. Containerboard
- 1.6. Other Types
-
2. End-user Industry
- 2.1. Processed Foods
- 2.2. Fresh Food and Produces
- 2.3. Beverages
- 2.4. Paper Products
- 2.5. Electrical Products
- 2.6. Other End-user Industries
MEA Paper and Paperboard Industry Segmentation By Geography
-
1. North America
- 1.1. United States
- 1.2. Canada
- 1.3. Mexico
-
2. South America
- 2.1. Brazil
- 2.2. Argentina
- 2.3. Rest of South America
-
3. Europe
- 3.1. United Kingdom
- 3.2. Germany
- 3.3. France
- 3.4. Italy
- 3.5. Spain
- 3.6. Russia
- 3.7. Benelux
- 3.8. Nordics
- 3.9. Rest of Europe
-
4. Middle East & Africa
- 4.1. Turkey
- 4.2. Israel
- 4.3. GCC
- 4.4. North Africa
- 4.5. South Africa
- 4.6. Rest of Middle East & Africa
-
5. Asia Pacific
- 5.1. China
- 5.2. India
- 5.3. Japan
- 5.4. South Korea
- 5.5. ASEAN
- 5.6. Oceania
- 5.7. Rest of Asia Pacific
MEA Paper and Paperboard Industry REPORT HIGHLIGHTS
| Aspects | Details |
|---|---|
| Study Period | 2019-2033 |
| Base Year | 2024 |
| Estimated Year | 2025 |
| Forecast Period | 2025-2033 |
| Historical Period | 2019-2024 |
| Growth Rate | CAGR of 4.00% from 2019-2033 |
| Segmentation |
|
Table of Contents
- 1. Introduction
- 1.1. Research Scope
- 1.2. Market Segmentation
- 1.3. Research Methodology
- 1.4. Definitions and Assumptions
- 2. Executive Summary
- 2.1. Introduction
- 3. Market Dynamics
- 3.1. Introduction
- 3.2. Market Drivers
- 3.2.1. Introduction of Advanced Packaging Technologies to Increase Sales; Increasing Demand for Packaging from Logistics and Transportation
- 3.3. Market Restrains
- 3.3.1. High Costs and Import Duties Pose a Challenge for New Customers; Fluctuations in Raw Material Prices
- 3.4. Market Trends
- 3.4.1. Container Board to Witness the Fastest Market Growth
- 4. Market Factor Analysis
- 4.1. Porters Five Forces
- 4.2. Supply/Value Chain
- 4.3. PESTEL analysis
- 4.4. Market Entropy
- 4.5. Patent/Trademark Analysis
- 5. Global MEA Paper and Paperboard Industry Analysis, Insights and Forecast, 2019-2031
- 5.1. Market Analysis, Insights and Forecast - by Type
- 5.1.1. Printing and Writing
- 5.1.2. Newsprint
- 5.1.3. Tissue
- 5.1.4. Cartonboard
- 5.1.5. Containerboard
- 5.1.6. Other Types
- 5.2. Market Analysis, Insights and Forecast - by End-user Industry
- 5.2.1. Processed Foods
- 5.2.2. Fresh Food and Produces
- 5.2.3. Beverages
- 5.2.4. Paper Products
- 5.2.5. Electrical Products
- 5.2.6. Other End-user Industries
- 5.3. Market Analysis, Insights and Forecast - by Region
- 5.3.1. North America
- 5.3.2. South America
- 5.3.3. Europe
- 5.3.4. Middle East & Africa
- 5.3.5. Asia Pacific
- 5.1. Market Analysis, Insights and Forecast - by Type
- 6. North America MEA Paper and Paperboard Industry Analysis, Insights and Forecast, 2019-2031
- 6.1. Market Analysis, Insights and Forecast - by Type
- 6.1.1. Printing and Writing
- 6.1.2. Newsprint
- 6.1.3. Tissue
- 6.1.4. Cartonboard
- 6.1.5. Containerboard
- 6.1.6. Other Types
- 6.2. Market Analysis, Insights and Forecast - by End-user Industry
- 6.2.1. Processed Foods
- 6.2.2. Fresh Food and Produces
- 6.2.3. Beverages
- 6.2.4. Paper Products
- 6.2.5. Electrical Products
- 6.2.6. Other End-user Industries
- 6.1. Market Analysis, Insights and Forecast - by Type
- 7. South America MEA Paper and Paperboard Industry Analysis, Insights and Forecast, 2019-2031
- 7.1. Market Analysis, Insights and Forecast - by Type
- 7.1.1. Printing and Writing
- 7.1.2. Newsprint
- 7.1.3. Tissue
- 7.1.4. Cartonboard
- 7.1.5. Containerboard
- 7.1.6. Other Types
- 7.2. Market Analysis, Insights and Forecast - by End-user Industry
- 7.2.1. Processed Foods
- 7.2.2. Fresh Food and Produces
- 7.2.3. Beverages
- 7.2.4. Paper Products
- 7.2.5. Electrical Products
- 7.2.6. Other End-user Industries
- 7.1. Market Analysis, Insights and Forecast - by Type
- 8. Europe MEA Paper and Paperboard Industry Analysis, Insights and Forecast, 2019-2031
- 8.1. Market Analysis, Insights and Forecast - by Type
- 8.1.1. Printing and Writing
- 8.1.2. Newsprint
- 8.1.3. Tissue
- 8.1.4. Cartonboard
- 8.1.5. Containerboard
- 8.1.6. Other Types
- 8.2. Market Analysis, Insights and Forecast - by End-user Industry
- 8.2.1. Processed Foods
- 8.2.2. Fresh Food and Produces
- 8.2.3. Beverages
- 8.2.4. Paper Products
- 8.2.5. Electrical Products
- 8.2.6. Other End-user Industries
- 8.1. Market Analysis, Insights and Forecast - by Type
- 9. Middle East & Africa MEA Paper and Paperboard Industry Analysis, Insights and Forecast, 2019-2031
- 9.1. Market Analysis, Insights and Forecast - by Type
- 9.1.1. Printing and Writing
- 9.1.2. Newsprint
- 9.1.3. Tissue
- 9.1.4. Cartonboard
- 9.1.5. Containerboard
- 9.1.6. Other Types
- 9.2. Market Analysis, Insights and Forecast - by End-user Industry
- 9.2.1. Processed Foods
- 9.2.2. Fresh Food and Produces
- 9.2.3. Beverages
- 9.2.4. Paper Products
- 9.2.5. Electrical Products
- 9.2.6. Other End-user Industries
- 9.1. Market Analysis, Insights and Forecast - by Type
- 10. Asia Pacific MEA Paper and Paperboard Industry Analysis, Insights and Forecast, 2019-2031
- 10.1. Market Analysis, Insights and Forecast - by Type
- 10.1.1. Printing and Writing
- 10.1.2. Newsprint
- 10.1.3. Tissue
- 10.1.4. Cartonboard
- 10.1.5. Containerboard
- 10.1.6. Other Types
- 10.2. Market Analysis, Insights and Forecast - by End-user Industry
- 10.2.1. Processed Foods
- 10.2.2. Fresh Food and Produces
- 10.2.3. Beverages
- 10.2.4. Paper Products
- 10.2.5. Electrical Products
- 10.2.6. Other End-user Industries
- 10.1. Market Analysis, Insights and Forecast - by Type
- 11. North America MEA Paper and Paperboard Industry Analysis, Insights and Forecast, 2019-2031
- 11.1. Market Analysis, Insights and Forecast - By Country/Sub-region
- 11.1.1.
- 12. Asia Pacific MEA Paper and Paperboard Industry Analysis, Insights and Forecast, 2019-2031
- 12.1. Market Analysis, Insights and Forecast - By Country/Sub-region
- 12.1.1.
- 13. Europe MEA Paper and Paperboard Industry Analysis, Insights and Forecast, 2019-2031
- 13.1. Market Analysis, Insights and Forecast - By Country/Sub-region
- 13.1.1.
- 14. Middle East and Africa MEA Paper and Paperboard Industry Analysis, Insights and Forecast, 2019-2031
- 14.1. Market Analysis, Insights and Forecast - By Country/Sub-region
- 14.1.1.
- 15. Latin America MEA Paper and Paperboard Industry Analysis, Insights and Forecast, 2019-2031
- 15.1. Market Analysis, Insights and Forecast - By Country/Sub-region
- 15.1.1.
- 16. Competitive Analysis
- 16.1. Global Market Share Analysis 2024
- 16.2. Company Profiles
- 16.2.1 Matco Packaging LLC
- 16.2.1.1. Overview
- 16.2.1.2. Products
- 16.2.1.3. SWOT Analysis
- 16.2.1.4. Recent Developments
- 16.2.1.5. Financials (Based on Availability)
- 16.2.2 Al Rumanah Packaging
- 16.2.2.1. Overview
- 16.2.2.2. Products
- 16.2.2.3. SWOT Analysis
- 16.2.2.4. Recent Developments
- 16.2.2.5. Financials (Based on Availability)
- 16.2.3 Hotpack Packaging Industries LLC
- 16.2.3.1. Overview
- 16.2.3.2. Products
- 16.2.3.3. SWOT Analysis
- 16.2.3.4. Recent Developments
- 16.2.3.5. Financials (Based on Availability)
- 16.2.4 Global Carton Boxes Manufacturing LLC*List Not Exhaustive
- 16.2.4.1. Overview
- 16.2.4.2. Products
- 16.2.4.3. SWOT Analysis
- 16.2.4.4. Recent Developments
- 16.2.4.5. Financials (Based on Availability)
- 16.2.5 United Carton Industries Company (UCIC)
- 16.2.5.1. Overview
- 16.2.5.2. Products
- 16.2.5.3. SWOT Analysis
- 16.2.5.4. Recent Developments
- 16.2.5.5. Financials (Based on Availability)
- 16.2.6 IFFCO
- 16.2.6.1. Overview
- 16.2.6.2. Products
- 16.2.6.3. SWOT Analysis
- 16.2.6.4. Recent Developments
- 16.2.6.5. Financials (Based on Availability)
- 16.2.7 Tarboosh Packaging Co LLC
- 16.2.7.1. Overview
- 16.2.7.2. Products
- 16.2.7.3. SWOT Analysis
- 16.2.7.4. Recent Developments
- 16.2.7.5. Financials (Based on Availability)
- 16.2.8 Green Packaging Boxes Ind LLC
- 16.2.8.1. Overview
- 16.2.8.2. Products
- 16.2.8.3. SWOT Analysis
- 16.2.8.4. Recent Developments
- 16.2.8.5. Financials (Based on Availability)
- 16.2.9 Arabian Packaging Co LLC
- 16.2.9.1. Overview
- 16.2.9.2. Products
- 16.2.9.3. SWOT Analysis
- 16.2.9.4. Recent Developments
- 16.2.9.5. Financials (Based on Availability)
- 16.2.10 International Paper
- 16.2.10.1. Overview
- 16.2.10.2. Products
- 16.2.10.3. SWOT Analysis
- 16.2.10.4. Recent Developments
- 16.2.10.5. Financials (Based on Availability)
- 16.2.1 Matco Packaging LLC
List of Figures
- Figure 1: Global MEA Paper and Paperboard Industry Revenue Breakdown (Million, %) by Region 2024 & 2032
- Figure 2: North America MEA Paper and Paperboard Industry Revenue (Million), by Country 2024 & 2032
- Figure 3: North America MEA Paper and Paperboard Industry Revenue Share (%), by Country 2024 & 2032
- Figure 4: Asia Pacific MEA Paper and Paperboard Industry Revenue (Million), by Country 2024 & 2032
- Figure 5: Asia Pacific MEA Paper and Paperboard Industry Revenue Share (%), by Country 2024 & 2032
- Figure 6: Europe MEA Paper and Paperboard Industry Revenue (Million), by Country 2024 & 2032
- Figure 7: Europe MEA Paper and Paperboard Industry Revenue Share (%), by Country 2024 & 2032
- Figure 8: Middle East and Africa MEA Paper and Paperboard Industry Revenue (Million), by Country 2024 & 2032
- Figure 9: Middle East and Africa MEA Paper and Paperboard Industry Revenue Share (%), by Country 2024 & 2032
- Figure 10: Latin America MEA Paper and Paperboard Industry Revenue (Million), by Country 2024 & 2032
- Figure 11: Latin America MEA Paper and Paperboard Industry Revenue Share (%), by Country 2024 & 2032
- Figure 12: North America MEA Paper and Paperboard Industry Revenue (Million), by Type 2024 & 2032
- Figure 13: North America MEA Paper and Paperboard Industry Revenue Share (%), by Type 2024 & 2032
- Figure 14: North America MEA Paper and Paperboard Industry Revenue (Million), by End-user Industry 2024 & 2032
- Figure 15: North America MEA Paper and Paperboard Industry Revenue Share (%), by End-user Industry 2024 & 2032
- Figure 16: North America MEA Paper and Paperboard Industry Revenue (Million), by Country 2024 & 2032
- Figure 17: North America MEA Paper and Paperboard Industry Revenue Share (%), by Country 2024 & 2032
- Figure 18: South America MEA Paper and Paperboard Industry Revenue (Million), by Type 2024 & 2032
- Figure 19: South America MEA Paper and Paperboard Industry Revenue Share (%), by Type 2024 & 2032
- Figure 20: South America MEA Paper and Paperboard Industry Revenue (Million), by End-user Industry 2024 & 2032
- Figure 21: South America MEA Paper and Paperboard Industry Revenue Share (%), by End-user Industry 2024 & 2032
- Figure 22: South America MEA Paper and Paperboard Industry Revenue (Million), by Country 2024 & 2032
- Figure 23: South America MEA Paper and Paperboard Industry Revenue Share (%), by Country 2024 & 2032
- Figure 24: Europe MEA Paper and Paperboard Industry Revenue (Million), by Type 2024 & 2032
- Figure 25: Europe MEA Paper and Paperboard Industry Revenue Share (%), by Type 2024 & 2032
- Figure 26: Europe MEA Paper and Paperboard Industry Revenue (Million), by End-user Industry 2024 & 2032
- Figure 27: Europe MEA Paper and Paperboard Industry Revenue Share (%), by End-user Industry 2024 & 2032
- Figure 28: Europe MEA Paper and Paperboard Industry Revenue (Million), by Country 2024 & 2032
- Figure 29: Europe MEA Paper and Paperboard Industry Revenue Share (%), by Country 2024 & 2032
- Figure 30: Middle East & Africa MEA Paper and Paperboard Industry Revenue (Million), by Type 2024 & 2032
- Figure 31: Middle East & Africa MEA Paper and Paperboard Industry Revenue Share (%), by Type 2024 & 2032
- Figure 32: Middle East & Africa MEA Paper and Paperboard Industry Revenue (Million), by End-user Industry 2024 & 2032
- Figure 33: Middle East & Africa MEA Paper and Paperboard Industry Revenue Share (%), by End-user Industry 2024 & 2032
- Figure 34: Middle East & Africa MEA Paper and Paperboard Industry Revenue (Million), by Country 2024 & 2032
- Figure 35: Middle East & Africa MEA Paper and Paperboard Industry Revenue Share (%), by Country 2024 & 2032
- Figure 36: Asia Pacific MEA Paper and Paperboard Industry Revenue (Million), by Type 2024 & 2032
- Figure 37: Asia Pacific MEA Paper and Paperboard Industry Revenue Share (%), by Type 2024 & 2032
- Figure 38: Asia Pacific MEA Paper and Paperboard Industry Revenue (Million), by End-user Industry 2024 & 2032
- Figure 39: Asia Pacific MEA Paper and Paperboard Industry Revenue Share (%), by End-user Industry 2024 & 2032
- Figure 40: Asia Pacific MEA Paper and Paperboard Industry Revenue (Million), by Country 2024 & 2032
- Figure 41: Asia Pacific MEA Paper and Paperboard Industry Revenue Share (%), by Country 2024 & 2032
List of Tables
- Table 1: Global MEA Paper and Paperboard Industry Revenue Million Forecast, by Region 2019 & 2032
- Table 2: Global MEA Paper and Paperboard Industry Revenue Million Forecast, by Type 2019 & 2032
- Table 3: Global MEA Paper and Paperboard Industry Revenue Million Forecast, by End-user Industry 2019 & 2032
- Table 4: Global MEA Paper and Paperboard Industry Revenue Million Forecast, by Region 2019 & 2032
- Table 5: Global MEA Paper and Paperboard Industry Revenue Million Forecast, by Country 2019 & 2032
- Table 6: MEA Paper and Paperboard Industry Revenue (Million) Forecast, by Application 2019 & 2032
- Table 7: Global MEA Paper and Paperboard Industry Revenue Million Forecast, by Country 2019 & 2032
- Table 8: MEA Paper and Paperboard Industry Revenue (Million) Forecast, by Application 2019 & 2032
- Table 9: Global MEA Paper and Paperboard Industry Revenue Million Forecast, by Country 2019 & 2032
- Table 10: MEA Paper and Paperboard Industry Revenue (Million) Forecast, by Application 2019 & 2032
- Table 11: Global MEA Paper and Paperboard Industry Revenue Million Forecast, by Country 2019 & 2032
- Table 12: MEA Paper and Paperboard Industry Revenue (Million) Forecast, by Application 2019 & 2032
- Table 13: Global MEA Paper and Paperboard Industry Revenue Million Forecast, by Country 2019 & 2032
- Table 14: MEA Paper and Paperboard Industry Revenue (Million) Forecast, by Application 2019 & 2032
- Table 15: Global MEA Paper and Paperboard Industry Revenue Million Forecast, by Type 2019 & 2032
- Table 16: Global MEA Paper and Paperboard Industry Revenue Million Forecast, by End-user Industry 2019 & 2032
- Table 17: Global MEA Paper and Paperboard Industry Revenue Million Forecast, by Country 2019 & 2032
- Table 18: United States MEA Paper and Paperboard Industry Revenue (Million) Forecast, by Application 2019 & 2032
- Table 19: Canada MEA Paper and Paperboard Industry Revenue (Million) Forecast, by Application 2019 & 2032
- Table 20: Mexico MEA Paper and Paperboard Industry Revenue (Million) Forecast, by Application 2019 & 2032
- Table 21: Global MEA Paper and Paperboard Industry Revenue Million Forecast, by Type 2019 & 2032
- Table 22: Global MEA Paper and Paperboard Industry Revenue Million Forecast, by End-user Industry 2019 & 2032
- Table 23: Global MEA Paper and Paperboard Industry Revenue Million Forecast, by Country 2019 & 2032
- Table 24: Brazil MEA Paper and Paperboard Industry Revenue (Million) Forecast, by Application 2019 & 2032
- Table 25: Argentina MEA Paper and Paperboard Industry Revenue (Million) Forecast, by Application 2019 & 2032
- Table 26: Rest of South America MEA Paper and Paperboard Industry Revenue (Million) Forecast, by Application 2019 & 2032
- Table 27: Global MEA Paper and Paperboard Industry Revenue Million Forecast, by Type 2019 & 2032
- Table 28: Global MEA Paper and Paperboard Industry Revenue Million Forecast, by End-user Industry 2019 & 2032
- Table 29: Global MEA Paper and Paperboard Industry Revenue Million Forecast, by Country 2019 & 2032
- Table 30: United Kingdom MEA Paper and Paperboard Industry Revenue (Million) Forecast, by Application 2019 & 2032
- Table 31: Germany MEA Paper and Paperboard Industry Revenue (Million) Forecast, by Application 2019 & 2032
- Table 32: France MEA Paper and Paperboard Industry Revenue (Million) Forecast, by Application 2019 & 2032
- Table 33: Italy MEA Paper and Paperboard Industry Revenue (Million) Forecast, by Application 2019 & 2032
- Table 34: Spain MEA Paper and Paperboard Industry Revenue (Million) Forecast, by Application 2019 & 2032
- Table 35: Russia MEA Paper and Paperboard Industry Revenue (Million) Forecast, by Application 2019 & 2032
- Table 36: Benelux MEA Paper and Paperboard Industry Revenue (Million) Forecast, by Application 2019 & 2032
- Table 37: Nordics MEA Paper and Paperboard Industry Revenue (Million) Forecast, by Application 2019 & 2032
- Table 38: Rest of Europe MEA Paper and Paperboard Industry Revenue (Million) Forecast, by Application 2019 & 2032
- Table 39: Global MEA Paper and Paperboard Industry Revenue Million Forecast, by Type 2019 & 2032
- Table 40: Global MEA Paper and Paperboard Industry Revenue Million Forecast, by End-user Industry 2019 & 2032
- Table 41: Global MEA Paper and Paperboard Industry Revenue Million Forecast, by Country 2019 & 2032
- Table 42: Turkey MEA Paper and Paperboard Industry Revenue (Million) Forecast, by Application 2019 & 2032
- Table 43: Israel MEA Paper and Paperboard Industry Revenue (Million) Forecast, by Application 2019 & 2032
- Table 44: GCC MEA Paper and Paperboard Industry Revenue (Million) Forecast, by Application 2019 & 2032
- Table 45: North Africa MEA Paper and Paperboard Industry Revenue (Million) Forecast, by Application 2019 & 2032
- Table 46: South Africa MEA Paper and Paperboard Industry Revenue (Million) Forecast, by Application 2019 & 2032
- Table 47: Rest of Middle East & Africa MEA Paper and Paperboard Industry Revenue (Million) Forecast, by Application 2019 & 2032
- Table 48: Global MEA Paper and Paperboard Industry Revenue Million Forecast, by Type 2019 & 2032
- Table 49: Global MEA Paper and Paperboard Industry Revenue Million Forecast, by End-user Industry 2019 & 2032
- Table 50: Global MEA Paper and Paperboard Industry Revenue Million Forecast, by Country 2019 & 2032
- Table 51: China MEA Paper and Paperboard Industry Revenue (Million) Forecast, by Application 2019 & 2032
- Table 52: India MEA Paper and Paperboard Industry Revenue (Million) Forecast, by Application 2019 & 2032
- Table 53: Japan MEA Paper and Paperboard Industry Revenue (Million) Forecast, by Application 2019 & 2032
- Table 54: South Korea MEA Paper and Paperboard Industry Revenue (Million) Forecast, by Application 2019 & 2032
- Table 55: ASEAN MEA Paper and Paperboard Industry Revenue (Million) Forecast, by Application 2019 & 2032
- Table 56: Oceania MEA Paper and Paperboard Industry Revenue (Million) Forecast, by Application 2019 & 2032
- Table 57: Rest of Asia Pacific MEA Paper and Paperboard Industry Revenue (Million) Forecast, by Application 2019 & 2032
Frequently Asked Questions
1. What is the projected Compound Annual Growth Rate (CAGR) of the MEA Paper and Paperboard Industry?
The projected CAGR is approximately 4.00%.
2. Which companies are prominent players in the MEA Paper and Paperboard Industry?
Key companies in the market include Matco Packaging LLC, Al Rumanah Packaging, Hotpack Packaging Industries LLC, Global Carton Boxes Manufacturing LLC*List Not Exhaustive, United Carton Industries Company (UCIC), IFFCO, Tarboosh Packaging Co LLC, Green Packaging Boxes Ind LLC, Arabian Packaging Co LLC, International Paper.
3. What are the main segments of the MEA Paper and Paperboard Industry?
The market segments include Type, End-user Industry.
4. Can you provide details about the market size?
The market size is estimated to be USD XX Million as of 2022.
5. What are some drivers contributing to market growth?
Introduction of Advanced Packaging Technologies to Increase Sales; Increasing Demand for Packaging from Logistics and Transportation.
6. What are the notable trends driving market growth?
Container Board to Witness the Fastest Market Growth.
7. Are there any restraints impacting market growth?
High Costs and Import Duties Pose a Challenge for New Customers; Fluctuations in Raw Material Prices.
8. Can you provide examples of recent developments in the market?
N/A
9. What pricing options are available for accessing the report?
Pricing options include single-user, multi-user, and enterprise licenses priced at USD 4750, USD 4950, and USD 6800 respectively.
10. Is the market size provided in terms of value or volume?
The market size is provided in terms of value, measured in Million.
11. Are there any specific market keywords associated with the report?
Yes, the market keyword associated with the report is "MEA Paper and Paperboard Industry," which aids in identifying and referencing the specific market segment covered.
12. How do I determine which pricing option suits my needs best?
The pricing options vary based on user requirements and access needs. Individual users may opt for single-user licenses, while businesses requiring broader access may choose multi-user or enterprise licenses for cost-effective access to the report.
13. Are there any additional resources or data provided in the MEA Paper and Paperboard Industry report?
While the report offers comprehensive insights, it's advisable to review the specific contents or supplementary materials provided to ascertain if additional resources or data are available.
14. How can I stay updated on further developments or reports in the MEA Paper and Paperboard Industry?
To stay informed about further developments, trends, and reports in the MEA Paper and Paperboard Industry, consider subscribing to industry newsletters, following relevant companies and organizations, or regularly checking reputable industry news sources and publications.
Methodology
Step 1 - Identification of Relevant Samples Size from Population Database


Step 2 - Approaches for Defining Global Market Size (Value, Volume* & Price*)

Note*: In applicable scenarios
Step 3 - Data Sources
Primary Research
- Web Analytics
- Survey Reports
- Research Institute
- Latest Research Reports
- Opinion Leaders
Secondary Research
- Annual Reports
- White Paper
- Latest Press Release
- Industry Association
- Paid Database
- Investor Presentations

Step 4 - Data Triangulation
Involves using different sources of information in order to increase the validity of a study
These sources are likely to be stakeholders in a program - participants, other researchers, program staff, other community members, and so on.
Then we put all data in single framework & apply various statistical tools to find out the dynamic on the market.
During the analysis stage, feedback from the stakeholder groups would be compared to determine areas of agreement as well as areas of divergence


