

Key Insights
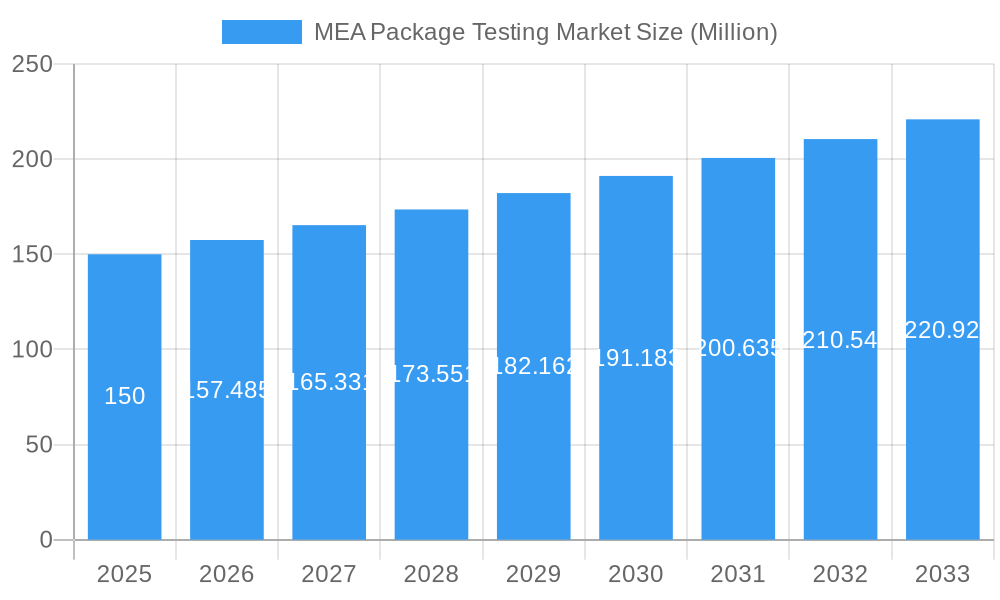
The Middle East and Africa (MEA) package testing market, valued at approximately $14.8 billion in 2025, is projected to experience robust growth, exhibiting a Compound Annual Growth Rate (CAGR) of 9.65% from 2025 to 2033. This expansion is driven by the burgeoning food and beverage sector, increasing consumer awareness of product safety and quality, and stringent regulatory compliance for packaging materials. Growth in the healthcare and industrial sectors, alongside the rising adoption of e-commerce, further fuels market expansion. Challenges include high testing costs and the need for specialized expertise.
MEA Package Testing Market Market Size (In Billion)
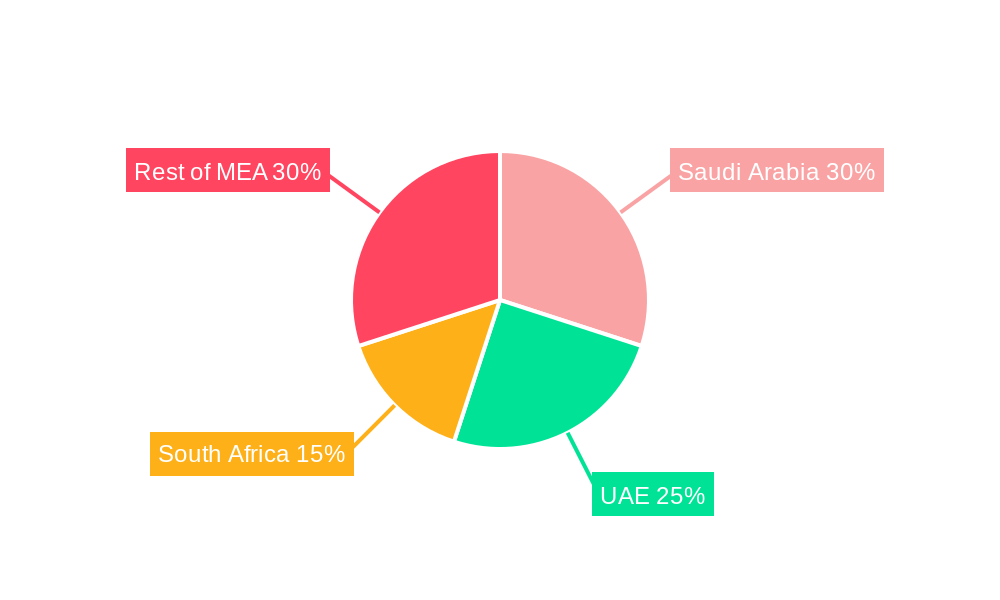
Key trends shaping the MEA package testing market include a growing preference for sustainable packaging materials, driving demand for tests assessing biodegradability and recyclability. The adoption of advanced testing technologies, such as digital imaging and spectroscopic analysis, enhances testing efficiency and precision. Outsourcing testing services to specialized laboratories is also prevalent. Competition among testing providers is increasing, leading to competitive pricing and a wider range of services. Market segments include glass, paper, plastic, and metal packaging materials, with testing services covering physical performance, chemical, and environmental aspects. Significant growth is anticipated across various end-user verticals and countries, with Saudi Arabia and the UAE showing particularly strong market potential.
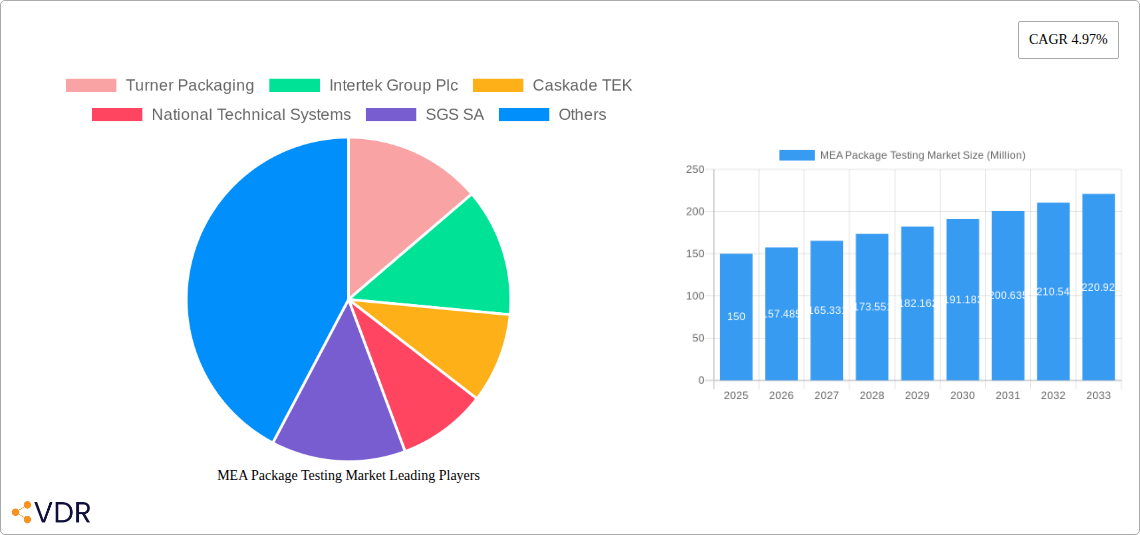
MEA Package Testing Market Company Market Share
MEA Package Testing Market: A Comprehensive Report (2019-2033)
This comprehensive report provides a detailed analysis of the Middle East and Africa (MEA) Package Testing market, encompassing market dynamics, growth trends, dominant segments, key players, and future outlook. The study period covers 2019-2033, with 2025 as the base year and a forecast period of 2025-2033. The market is segmented by primary material (glass, paper, plastic, metal), type of testing (physical performance, chemical, environmental), end-user vertical (food and beverage, healthcare, industrial, personal & household products, other), and country (Saudi Arabia, UAE, South Africa, Rest of MEA). The report's value is presented in million units.
MEA Package Testing Market Dynamics & Structure
The MEA package testing market is experiencing moderate growth, driven by increasing e-commerce, stringent regulatory compliance, and a rising focus on product quality and safety. Market concentration is relatively fragmented, with several international and regional players competing. Technological innovations, such as advanced analytical techniques and automation, are improving testing efficiency and accuracy. However, high testing costs and a lack of awareness in certain regions pose challenges. The regulatory landscape is evolving, with stricter standards being implemented across various sectors. The market witnesses frequent M&A activities, with larger players acquiring smaller companies to expand their service portfolio and geographical reach.
- Market Concentration: Moderately fragmented, with a xx% market share held by the top 5 players in 2024.
- Technological Innovation: Adoption of AI and automation is increasing efficiency, while advanced analytical techniques enhance accuracy. Barriers include high initial investment and skilled labor requirements.
- Regulatory Framework: Stringent regulations on food safety, pharmaceutical packaging, and hazardous materials are driving demand for testing services.
- Competitive Product Substitutes: Limited substitutes exist, mainly involving in-house testing capabilities for larger companies.
- End-User Demographics: Growth is fueled by the expanding middle class and increasing disposable incomes in the MEA region.
- M&A Trends: Significant M&A activity observed in the historical period (2019-2024), with an average of xx deals annually, primarily focused on expanding service offerings and market reach.
MEA Package Testing Market Growth Trends & Insights
The MEA package testing market is projected to exhibit a CAGR of xx% during the forecast period (2025-2033), driven by factors such as rising e-commerce activities, increasing consumer awareness of product safety, and stricter government regulations. Market penetration is currently estimated at xx% in 2025, with significant growth potential in untapped segments and regions. The adoption rate of advanced testing technologies is gradually increasing. Consumer behavior shifts towards online purchases are driving the need for robust package testing to ensure product integrity during transit. The market size is expected to reach xx million units by 2033. Technological disruptions like the use of drones in delivery (as seen with Aramex's 2022 trials) necessitate further testing of package resilience and durability. The market faces challenges including inconsistent infrastructure, particularly in remote areas, limiting the adoption of advanced testing methodologies.
Dominant Regions, Countries, or Segments in MEA Package Testing Market
The UAE and Saudi Arabia represent the largest segments of the MEA package testing market, driven by robust economic growth, expanding industrial sectors, and relatively developed infrastructure. The food and beverage industry is a major driver, followed by the healthcare sector. Plastic packaging dominates the primary material segment due to its widespread use. Physical performance testing is currently the largest testing type, followed by chemical testing. South Africa also holds a significant market share within the MEA region.
- Key Drivers:
- Strong economic growth in the UAE and Saudi Arabia.
- Expanding industrial and manufacturing sectors.
- Stringent food safety and quality regulations.
- Increasing e-commerce activities.
- Dominance Factors:
- Higher disposable incomes and consumer spending.
- Developed logistics and infrastructure.
- Presence of major multinational companies.
- Government initiatives promoting industrial development.
- Market share for UAE and Saudi Arabia: xx% and xx% respectively in 2024. Growth potential in South Africa and the Rest of MEA regions is expected to be xx% and xx% respectively by 2033.
MEA Package Testing Market Product Landscape
The MEA package testing market offers a range of services, from basic physical tests to sophisticated chemical and environmental analyses. Product innovations focus on improving testing speed, accuracy, and efficiency. Advanced technologies, including spectroscopy, chromatography, and microscopy, are increasingly being adopted. Unique selling propositions often center around specialized expertise in particular packaging materials or end-user verticals, as well as rapid turnaround times and high levels of accuracy.
Key Drivers, Barriers & Challenges in MEA Package Testing Market
Key Drivers: Stringent regulatory compliance standards across diverse industries, rapid growth of e-commerce, and increased consumer demand for safe and high-quality products are driving market expansion.
Challenges: High testing costs can hinder adoption, especially for smaller businesses. Lack of awareness about the importance of package testing in certain segments is also a restraint. Furthermore, infrastructure limitations and skilled labor shortages in some areas impede market growth. Supply chain disruptions due to geopolitical factors and the COVID-19 pandemic can impact the availability of testing equipment and materials. This has led to xx% increase in testing costs in some regions.
Emerging Opportunities in MEA Package Testing Market
Untapped potential exists within the Rest of MEA region and emerging economies. The growing popularity of sustainable and eco-friendly packaging creates opportunities for specialized testing services. Expansion into new verticals such as cosmetics and personal care presents further growth avenues. Offering value-added services, such as packaging design consulting, can enhance competitiveness.
Growth Accelerators in the MEA Package Testing Market Industry
Technological advancements in testing techniques and equipment, such as AI and automation, are major growth catalysts. Strategic partnerships between testing laboratories and packaging manufacturers enable better integration and efficiency. Expanding into new markets and introducing specialized testing services can accelerate market growth. Government regulations and incentives supporting product safety and quality also stimulate demand.
Key Players Shaping the MEA Package Testing Market Market
- Turner Packaging
- Intertek Group Plc (Intertek)
- Caskade TEK
- National Technical Systems
- SGS SA (SGS)
- DDL Inc
- Nefab AB (Nefab)
- Advance Packaging
- Bureau Veritas SA (Bureau Veritas)
- Eurofins Scientific SE (Eurofins Scientific)
- CSZ Testing Services Laboratories
Notable Milestones in MEA Package Testing Market Sector
- October 2022: Aramex's successful drone package delivery tests in Oman highlight the evolving delivery landscape and the need for testing adapted to new technologies.
- September 2022: Eurofins Scientific's acquisition of QSAI Analysis and Research Center Co., Ltd. strengthens its food testing capabilities, underscoring the increasing importance of comprehensive testing services.
In-Depth MEA Package Testing Market Market Outlook
The MEA package testing market holds significant long-term potential, driven by continuous economic development, technological advancements, and evolving regulatory landscapes. Strategic opportunities lie in adopting advanced technologies, forging strategic partnerships, and expanding into underserved markets. Companies specializing in sustainable packaging testing and those providing comprehensive, integrated solutions will be well-positioned for success.
MEA Package Testing Market Segmentation
-
1. Primary Material
- 1.1. Glass
- 1.2. Paper
- 1.3. Plastic
- 1.4. Metal
-
2. Type of Testing
- 2.1. Physical Performance Testing
- 2.2. Chemical Testing
- 2.3. Environmental Testing
-
3. End-User Vertical
- 3.1. Food and Beverage
- 3.2. Healthcare
- 3.3. Industrial
- 3.4. Personal and HouseHold Products
- 3.5. Other End-User
MEA Package Testing Market Segmentation By Geography
-
1. North America
- 1.1. United States
- 1.2. Canada
- 1.3. Mexico
-
2. South America
- 2.1. Brazil
- 2.2. Argentina
- 2.3. Rest of South America
-
3. Europe
- 3.1. United Kingdom
- 3.2. Germany
- 3.3. France
- 3.4. Italy
- 3.5. Spain
- 3.6. Russia
- 3.7. Benelux
- 3.8. Nordics
- 3.9. Rest of Europe
-
4. Middle East & Africa
- 4.1. Turkey
- 4.2. Israel
- 4.3. GCC
- 4.4. North Africa
- 4.5. South Africa
- 4.6. Rest of Middle East & Africa
-
5. Asia Pacific
- 5.1. China
- 5.2. India
- 5.3. Japan
- 5.4. South Korea
- 5.5. ASEAN
- 5.6. Oceania
- 5.7. Rest of Asia Pacific
MEA Package Testing Market Regional Market Share
Geographic Coverage of MEA Package Testing Market
MEA Package Testing Market REPORT HIGHLIGHTS
| Aspects | Details |
|---|---|
| Study Period | 2020-2034 |
| Base Year | 2025 |
| Estimated Year | 2026 |
| Forecast Period | 2026-2034 |
| Historical Period | 2020-2025 |
| Growth Rate | CAGR of 9.65% from 2020-2034 |
| Segmentation |
|
Table of Contents
- 1. Introduction
- 1.1. Research Scope
- 1.2. Market Segmentation
- 1.3. Research Objective
- 1.4. Definitions and Assumptions
- 2. Executive Summary
- 2.1. Market Snapshot
- 3. Market Dynamics
- 3.1. Market Drivers
- 3.2. Market Restrains
- 3.3. Market Trends
- 3.4. Market Opportunities
- 4. Market Factor Analysis
- 4.1. Porters Five Forces
- 4.1.1. Bargaining Power of Suppliers
- 4.1.2. Bargaining Power of Buyers
- 4.1.3. Threat of New Entrants
- 4.1.4. Threat of Substitutes
- 4.1.5. Competitive Rivalry
- 4.2. PESTEL analysis
- 4.3. BCG Analysis
- 4.3.1. Stars (High Growth, High Market Share)
- 4.3.2. Cash Cows (Low Growth, High Market Share)
- 4.3.3. Question Mark (High Growth, Low Market Share)
- 4.3.4. Dogs (Low Growth, Low Market Share)
- 4.4. Ansoff Matrix Analysis
- 4.5. Supply Chain Analysis
- 4.6. Regulatory Landscape
- 4.7. Current Market Potential and Opportunity Assessment (TAM–SAM–SOM Framework)
- 4.8. VDR Analyst Note
- 4.1. Porters Five Forces
- 5. Market Analysis, Insights and Forecast 2021-2033
- 5.1. Market Analysis, Insights and Forecast - by Primary Material
- 5.1.1. Glass
- 5.1.2. Paper
- 5.1.3. Plastic
- 5.1.4. Metal
- 5.2. Market Analysis, Insights and Forecast - by Type of Testing
- 5.2.1. Physical Performance Testing
- 5.2.2. Chemical Testing
- 5.2.3. Environmental Testing
- 5.3. Market Analysis, Insights and Forecast - by End-User Vertical
- 5.3.1. Food and Beverage
- 5.3.2. Healthcare
- 5.3.3. Industrial
- 5.3.4. Personal and HouseHold Products
- 5.3.5. Other End-User
- 5.4. Market Analysis, Insights and Forecast - by Region
- 5.4.1. North America
- 5.4.2. South America
- 5.4.3. Europe
- 5.4.4. Middle East & Africa
- 5.4.5. Asia Pacific
- 5.1. Market Analysis, Insights and Forecast - by Primary Material
- 6. Global MEA Package Testing Market Analysis, Insights and Forecast, 2021-2033
- 6.1. Market Analysis, Insights and Forecast - by Primary Material
- 6.1.1. Glass
- 6.1.2. Paper
- 6.1.3. Plastic
- 6.1.4. Metal
- 6.2. Market Analysis, Insights and Forecast - by Type of Testing
- 6.2.1. Physical Performance Testing
- 6.2.2. Chemical Testing
- 6.2.3. Environmental Testing
- 6.3. Market Analysis, Insights and Forecast - by End-User Vertical
- 6.3.1. Food and Beverage
- 6.3.2. Healthcare
- 6.3.3. Industrial
- 6.3.4. Personal and HouseHold Products
- 6.3.5. Other End-User
- 6.1. Market Analysis, Insights and Forecast - by Primary Material
- 7. North America MEA Package Testing Market Analysis, Insights and Forecast, 2021-2033
- 7.1. Market Analysis, Insights and Forecast - by Primary Material
- 7.1.1. Glass
- 7.1.2. Paper
- 7.1.3. Plastic
- 7.1.4. Metal
- 7.2. Market Analysis, Insights and Forecast - by Type of Testing
- 7.2.1. Physical Performance Testing
- 7.2.2. Chemical Testing
- 7.2.3. Environmental Testing
- 7.3. Market Analysis, Insights and Forecast - by End-User Vertical
- 7.3.1. Food and Beverage
- 7.3.2. Healthcare
- 7.3.3. Industrial
- 7.3.4. Personal and HouseHold Products
- 7.3.5. Other End-User
- 7.1. Market Analysis, Insights and Forecast - by Primary Material
- 8. South America MEA Package Testing Market Analysis, Insights and Forecast, 2021-2033
- 8.1. Market Analysis, Insights and Forecast - by Primary Material
- 8.1.1. Glass
- 8.1.2. Paper
- 8.1.3. Plastic
- 8.1.4. Metal
- 8.2. Market Analysis, Insights and Forecast - by Type of Testing
- 8.2.1. Physical Performance Testing
- 8.2.2. Chemical Testing
- 8.2.3. Environmental Testing
- 8.3. Market Analysis, Insights and Forecast - by End-User Vertical
- 8.3.1. Food and Beverage
- 8.3.2. Healthcare
- 8.3.3. Industrial
- 8.3.4. Personal and HouseHold Products
- 8.3.5. Other End-User
- 8.1. Market Analysis, Insights and Forecast - by Primary Material
- 9. Europe MEA Package Testing Market Analysis, Insights and Forecast, 2021-2033
- 9.1. Market Analysis, Insights and Forecast - by Primary Material
- 9.1.1. Glass
- 9.1.2. Paper
- 9.1.3. Plastic
- 9.1.4. Metal
- 9.2. Market Analysis, Insights and Forecast - by Type of Testing
- 9.2.1. Physical Performance Testing
- 9.2.2. Chemical Testing
- 9.2.3. Environmental Testing
- 9.3. Market Analysis, Insights and Forecast - by End-User Vertical
- 9.3.1. Food and Beverage
- 9.3.2. Healthcare
- 9.3.3. Industrial
- 9.3.4. Personal and HouseHold Products
- 9.3.5. Other End-User
- 9.1. Market Analysis, Insights and Forecast - by Primary Material
- 10. Middle East & Africa MEA Package Testing Market Analysis, Insights and Forecast, 2021-2033
- 10.1. Market Analysis, Insights and Forecast - by Primary Material
- 10.1.1. Glass
- 10.1.2. Paper
- 10.1.3. Plastic
- 10.1.4. Metal
- 10.2. Market Analysis, Insights and Forecast - by Type of Testing
- 10.2.1. Physical Performance Testing
- 10.2.2. Chemical Testing
- 10.2.3. Environmental Testing
- 10.3. Market Analysis, Insights and Forecast - by End-User Vertical
- 10.3.1. Food and Beverage
- 10.3.2. Healthcare
- 10.3.3. Industrial
- 10.3.4. Personal and HouseHold Products
- 10.3.5. Other End-User
- 10.1. Market Analysis, Insights and Forecast - by Primary Material
- 11. Asia Pacific MEA Package Testing Market Analysis, Insights and Forecast, 2021-2033
- 11.1. Market Analysis, Insights and Forecast - by Primary Material
- 11.1.1. Glass
- 11.1.2. Paper
- 11.1.3. Plastic
- 11.1.4. Metal
- 11.2. Market Analysis, Insights and Forecast - by Type of Testing
- 11.2.1. Physical Performance Testing
- 11.2.2. Chemical Testing
- 11.2.3. Environmental Testing
- 11.3. Market Analysis, Insights and Forecast - by End-User Vertical
- 11.3.1. Food and Beverage
- 11.3.2. Healthcare
- 11.3.3. Industrial
- 11.3.4. Personal and HouseHold Products
- 11.3.5. Other End-User
- 11.1. Market Analysis, Insights and Forecast - by Primary Material
- 12. Competitive Analysis
- 12.1. Company Profiles
- 12.1.1 Turner Packaging
- 12.1.1.1. Company Overview
- 12.1.1.2. Products
- 12.1.1.3. Company Financials
- 12.1.1.4. SWOT Analysis
- 12.1.2 Intertek Group Plc
- 12.1.2.1. Company Overview
- 12.1.2.2. Products
- 12.1.2.3. Company Financials
- 12.1.2.4. SWOT Analysis
- 12.1.3 Caskade TEK
- 12.1.3.1. Company Overview
- 12.1.3.2. Products
- 12.1.3.3. Company Financials
- 12.1.3.4. SWOT Analysis
- 12.1.4 National Technical Systems
- 12.1.4.1. Company Overview
- 12.1.4.2. Products
- 12.1.4.3. Company Financials
- 12.1.4.4. SWOT Analysis
- 12.1.5 SGS SA
- 12.1.5.1. Company Overview
- 12.1.5.2. Products
- 12.1.5.3. Company Financials
- 12.1.5.4. SWOT Analysis
- 12.1.6 DDL Inc
- 12.1.6.1. Company Overview
- 12.1.6.2. Products
- 12.1.6.3. Company Financials
- 12.1.6.4. SWOT Analysis
- 12.1.7 Nefab AB
- 12.1.7.1. Company Overview
- 12.1.7.2. Products
- 12.1.7.3. Company Financials
- 12.1.7.4. SWOT Analysis
- 12.1.8 Advance Packaging
- 12.1.8.1. Company Overview
- 12.1.8.2. Products
- 12.1.8.3. Company Financials
- 12.1.8.4. SWOT Analysis
- 12.1.9 Bureau Veritas SA
- 12.1.9.1. Company Overview
- 12.1.9.2. Products
- 12.1.9.3. Company Financials
- 12.1.9.4. SWOT Analysis
- 12.1.10 Eurofins Scientific SE
- 12.1.10.1. Company Overview
- 12.1.10.2. Products
- 12.1.10.3. Company Financials
- 12.1.10.4. SWOT Analysis
- 12.1.11 CSZ Testing Services Laboratories
- 12.1.11.1. Company Overview
- 12.1.11.2. Products
- 12.1.11.3. Company Financials
- 12.1.11.4. SWOT Analysis
- 12.1.1 Turner Packaging
- 12.2. Market Entropy
- 12.2.1 Company's Key Areas Served
- 12.2.2 Recent Developments
- 12.3. Company Market Share Analysis 2025
- 12.3.1 Top 5 Companies Market Share Analysis
- 12.3.2 Top 3 Companies Market Share Analysis
- 12.4. List of Potential Customers
- 13. Research Methodology
List of Figures
- Figure 1: Global MEA Package Testing Market Revenue Breakdown (billion, %) by Region 2025 & 2033
- Figure 2: North America MEA Package Testing Market Revenue (billion), by Primary Material 2025 & 2033
- Figure 3: North America MEA Package Testing Market Revenue Share (%), by Primary Material 2025 & 2033
- Figure 4: North America MEA Package Testing Market Revenue (billion), by Type of Testing 2025 & 2033
- Figure 5: North America MEA Package Testing Market Revenue Share (%), by Type of Testing 2025 & 2033
- Figure 6: North America MEA Package Testing Market Revenue (billion), by End-User Vertical 2025 & 2033
- Figure 7: North America MEA Package Testing Market Revenue Share (%), by End-User Vertical 2025 & 2033
- Figure 8: North America MEA Package Testing Market Revenue (billion), by Country 2025 & 2033
- Figure 9: North America MEA Package Testing Market Revenue Share (%), by Country 2025 & 2033
- Figure 10: South America MEA Package Testing Market Revenue (billion), by Primary Material 2025 & 2033
- Figure 11: South America MEA Package Testing Market Revenue Share (%), by Primary Material 2025 & 2033
- Figure 12: South America MEA Package Testing Market Revenue (billion), by Type of Testing 2025 & 2033
- Figure 13: South America MEA Package Testing Market Revenue Share (%), by Type of Testing 2025 & 2033
- Figure 14: South America MEA Package Testing Market Revenue (billion), by End-User Vertical 2025 & 2033
- Figure 15: South America MEA Package Testing Market Revenue Share (%), by End-User Vertical 2025 & 2033
- Figure 16: South America MEA Package Testing Market Revenue (billion), by Country 2025 & 2033
- Figure 17: South America MEA Package Testing Market Revenue Share (%), by Country 2025 & 2033
- Figure 18: Europe MEA Package Testing Market Revenue (billion), by Primary Material 2025 & 2033
- Figure 19: Europe MEA Package Testing Market Revenue Share (%), by Primary Material 2025 & 2033
- Figure 20: Europe MEA Package Testing Market Revenue (billion), by Type of Testing 2025 & 2033
- Figure 21: Europe MEA Package Testing Market Revenue Share (%), by Type of Testing 2025 & 2033
- Figure 22: Europe MEA Package Testing Market Revenue (billion), by End-User Vertical 2025 & 2033
- Figure 23: Europe MEA Package Testing Market Revenue Share (%), by End-User Vertical 2025 & 2033
- Figure 24: Europe MEA Package Testing Market Revenue (billion), by Country 2025 & 2033
- Figure 25: Europe MEA Package Testing Market Revenue Share (%), by Country 2025 & 2033
- Figure 26: Middle East & Africa MEA Package Testing Market Revenue (billion), by Primary Material 2025 & 2033
- Figure 27: Middle East & Africa MEA Package Testing Market Revenue Share (%), by Primary Material 2025 & 2033
- Figure 28: Middle East & Africa MEA Package Testing Market Revenue (billion), by Type of Testing 2025 & 2033
- Figure 29: Middle East & Africa MEA Package Testing Market Revenue Share (%), by Type of Testing 2025 & 2033
- Figure 30: Middle East & Africa MEA Package Testing Market Revenue (billion), by End-User Vertical 2025 & 2033
- Figure 31: Middle East & Africa MEA Package Testing Market Revenue Share (%), by End-User Vertical 2025 & 2033
- Figure 32: Middle East & Africa MEA Package Testing Market Revenue (billion), by Country 2025 & 2033
- Figure 33: Middle East & Africa MEA Package Testing Market Revenue Share (%), by Country 2025 & 2033
- Figure 34: Asia Pacific MEA Package Testing Market Revenue (billion), by Primary Material 2025 & 2033
- Figure 35: Asia Pacific MEA Package Testing Market Revenue Share (%), by Primary Material 2025 & 2033
- Figure 36: Asia Pacific MEA Package Testing Market Revenue (billion), by Type of Testing 2025 & 2033
- Figure 37: Asia Pacific MEA Package Testing Market Revenue Share (%), by Type of Testing 2025 & 2033
- Figure 38: Asia Pacific MEA Package Testing Market Revenue (billion), by End-User Vertical 2025 & 2033
- Figure 39: Asia Pacific MEA Package Testing Market Revenue Share (%), by End-User Vertical 2025 & 2033
- Figure 40: Asia Pacific MEA Package Testing Market Revenue (billion), by Country 2025 & 2033
- Figure 41: Asia Pacific MEA Package Testing Market Revenue Share (%), by Country 2025 & 2033
List of Tables
- Table 1: Global MEA Package Testing Market Revenue billion Forecast, by Primary Material 2020 & 2033
- Table 2: Global MEA Package Testing Market Revenue billion Forecast, by Type of Testing 2020 & 2033
- Table 3: Global MEA Package Testing Market Revenue billion Forecast, by End-User Vertical 2020 & 2033
- Table 4: Global MEA Package Testing Market Revenue billion Forecast, by Region 2020 & 2033
- Table 5: Global MEA Package Testing Market Revenue billion Forecast, by Primary Material 2020 & 2033
- Table 6: Global MEA Package Testing Market Revenue billion Forecast, by Type of Testing 2020 & 2033
- Table 7: Global MEA Package Testing Market Revenue billion Forecast, by End-User Vertical 2020 & 2033
- Table 8: Global MEA Package Testing Market Revenue billion Forecast, by Country 2020 & 2033
- Table 9: United States MEA Package Testing Market Revenue (billion) Forecast, by Application 2020 & 2033
- Table 10: Canada MEA Package Testing Market Revenue (billion) Forecast, by Application 2020 & 2033
- Table 11: Mexico MEA Package Testing Market Revenue (billion) Forecast, by Application 2020 & 2033
- Table 12: Global MEA Package Testing Market Revenue billion Forecast, by Primary Material 2020 & 2033
- Table 13: Global MEA Package Testing Market Revenue billion Forecast, by Type of Testing 2020 & 2033
- Table 14: Global MEA Package Testing Market Revenue billion Forecast, by End-User Vertical 2020 & 2033
- Table 15: Global MEA Package Testing Market Revenue billion Forecast, by Country 2020 & 2033
- Table 16: Brazil MEA Package Testing Market Revenue (billion) Forecast, by Application 2020 & 2033
- Table 17: Argentina MEA Package Testing Market Revenue (billion) Forecast, by Application 2020 & 2033
- Table 18: Rest of South America MEA Package Testing Market Revenue (billion) Forecast, by Application 2020 & 2033
- Table 19: Global MEA Package Testing Market Revenue billion Forecast, by Primary Material 2020 & 2033
- Table 20: Global MEA Package Testing Market Revenue billion Forecast, by Type of Testing 2020 & 2033
- Table 21: Global MEA Package Testing Market Revenue billion Forecast, by End-User Vertical 2020 & 2033
- Table 22: Global MEA Package Testing Market Revenue billion Forecast, by Country 2020 & 2033
- Table 23: United Kingdom MEA Package Testing Market Revenue (billion) Forecast, by Application 2020 & 2033
- Table 24: Germany MEA Package Testing Market Revenue (billion) Forecast, by Application 2020 & 2033
- Table 25: France MEA Package Testing Market Revenue (billion) Forecast, by Application 2020 & 2033
- Table 26: Italy MEA Package Testing Market Revenue (billion) Forecast, by Application 2020 & 2033
- Table 27: Spain MEA Package Testing Market Revenue (billion) Forecast, by Application 2020 & 2033
- Table 28: Russia MEA Package Testing Market Revenue (billion) Forecast, by Application 2020 & 2033
- Table 29: Benelux MEA Package Testing Market Revenue (billion) Forecast, by Application 2020 & 2033
- Table 30: Nordics MEA Package Testing Market Revenue (billion) Forecast, by Application 2020 & 2033
- Table 31: Rest of Europe MEA Package Testing Market Revenue (billion) Forecast, by Application 2020 & 2033
- Table 32: Global MEA Package Testing Market Revenue billion Forecast, by Primary Material 2020 & 2033
- Table 33: Global MEA Package Testing Market Revenue billion Forecast, by Type of Testing 2020 & 2033
- Table 34: Global MEA Package Testing Market Revenue billion Forecast, by End-User Vertical 2020 & 2033
- Table 35: Global MEA Package Testing Market Revenue billion Forecast, by Country 2020 & 2033
- Table 36: Turkey MEA Package Testing Market Revenue (billion) Forecast, by Application 2020 & 2033
- Table 37: Israel MEA Package Testing Market Revenue (billion) Forecast, by Application 2020 & 2033
- Table 38: GCC MEA Package Testing Market Revenue (billion) Forecast, by Application 2020 & 2033
- Table 39: North Africa MEA Package Testing Market Revenue (billion) Forecast, by Application 2020 & 2033
- Table 40: South Africa MEA Package Testing Market Revenue (billion) Forecast, by Application 2020 & 2033
- Table 41: Rest of Middle East & Africa MEA Package Testing Market Revenue (billion) Forecast, by Application 2020 & 2033
- Table 42: Global MEA Package Testing Market Revenue billion Forecast, by Primary Material 2020 & 2033
- Table 43: Global MEA Package Testing Market Revenue billion Forecast, by Type of Testing 2020 & 2033
- Table 44: Global MEA Package Testing Market Revenue billion Forecast, by End-User Vertical 2020 & 2033
- Table 45: Global MEA Package Testing Market Revenue billion Forecast, by Country 2020 & 2033
- Table 46: China MEA Package Testing Market Revenue (billion) Forecast, by Application 2020 & 2033
- Table 47: India MEA Package Testing Market Revenue (billion) Forecast, by Application 2020 & 2033
- Table 48: Japan MEA Package Testing Market Revenue (billion) Forecast, by Application 2020 & 2033
- Table 49: South Korea MEA Package Testing Market Revenue (billion) Forecast, by Application 2020 & 2033
- Table 50: ASEAN MEA Package Testing Market Revenue (billion) Forecast, by Application 2020 & 2033
- Table 51: Oceania MEA Package Testing Market Revenue (billion) Forecast, by Application 2020 & 2033
- Table 52: Rest of Asia Pacific MEA Package Testing Market Revenue (billion) Forecast, by Application 2020 & 2033
Frequently Asked Questions
1. What is the projected Compound Annual Growth Rate (CAGR) of the MEA Package Testing Market?
The projected CAGR is approximately 9.65%.
2. Which companies are prominent players in the MEA Package Testing Market?
Key companies in the market include Turner Packaging, Intertek Group Plc, Caskade TEK, National Technical Systems, SGS SA, DDL Inc, Nefab AB, Advance Packaging, Bureau Veritas SA, Eurofins Scientific SE, CSZ Testing Services Laboratories.
3. What are the main segments of the MEA Package Testing Market?
The market segments include Primary Material, Type of Testing, End-User Vertical.
4. Can you provide details about the market size?
The market size is estimated to be USD 14.8 billion as of 2022.
5. What are some drivers contributing to market growth?
Rigorous Control Regulations and Administration and Qualification Demands; Demand for Longer Shelf Life of the Products Under Varying Conditions.
6. What are the notable trends driving market growth?
Paper and Paperboard is One of the Factor Driving the Market.
7. Are there any restraints impacting market growth?
High Costs of Equipment.
8. Can you provide examples of recent developments in the market?
October 2022 - Aramex completed successful drone package delivery tests in Oman. After Aramex began using drone technology for door-to-door deliveries, high-tech package delivery moved closer. After successfully completing test flights in Oman, the business has advanced the prospect of drones delivering items to your door. UVL Robotics, a US-based startup, teamed up with the biggest delivery service in the Middle East to carry out the test flights.
9. What pricing options are available for accessing the report?
Pricing options include single-user, multi-user, and enterprise licenses priced at USD 4750, USD 4950, and USD 6800 respectively.
10. Is the market size provided in terms of value or volume?
The market size is provided in terms of value, measured in billion.
11. Are there any specific market keywords associated with the report?
Yes, the market keyword associated with the report is "MEA Package Testing Market," which aids in identifying and referencing the specific market segment covered.
12. How do I determine which pricing option suits my needs best?
The pricing options vary based on user requirements and access needs. Individual users may opt for single-user licenses, while businesses requiring broader access may choose multi-user or enterprise licenses for cost-effective access to the report.
13. Are there any additional resources or data provided in the MEA Package Testing Market report?
While the report offers comprehensive insights, it's advisable to review the specific contents or supplementary materials provided to ascertain if additional resources or data are available.
14. How can I stay updated on further developments or reports in the MEA Package Testing Market?
To stay informed about further developments, trends, and reports in the MEA Package Testing Market, consider subscribing to industry newsletters, following relevant companies and organizations, or regularly checking reputable industry news sources and publications.
Methodology
Step 1 - Identification of Relevant Samples Size from Population Database


Step 2 - Approaches for Defining Global Market Size (Value, Volume* & Price*)

Note*: In applicable scenarios
Step 3 - Data Sources
Primary Research
- Web Analytics
- Survey Reports
- Research Institute
- Latest Research Reports
- Opinion Leaders
Secondary Research
- Annual Reports
- White Paper
- Latest Press Release
- Industry Association
- Paid Database
- Investor Presentations

Step 4 - Data Triangulation
Involves using different sources of information in order to increase the validity of a study
These sources are likely to be stakeholders in a program - participants, other researchers, program staff, other community members, and so on.
Then we put all data in single framework & apply various statistical tools to find out the dynamic on the market.
During the analysis stage, feedback from the stakeholder groups would be compared to determine areas of agreement as well as areas of divergence