

Key Insights
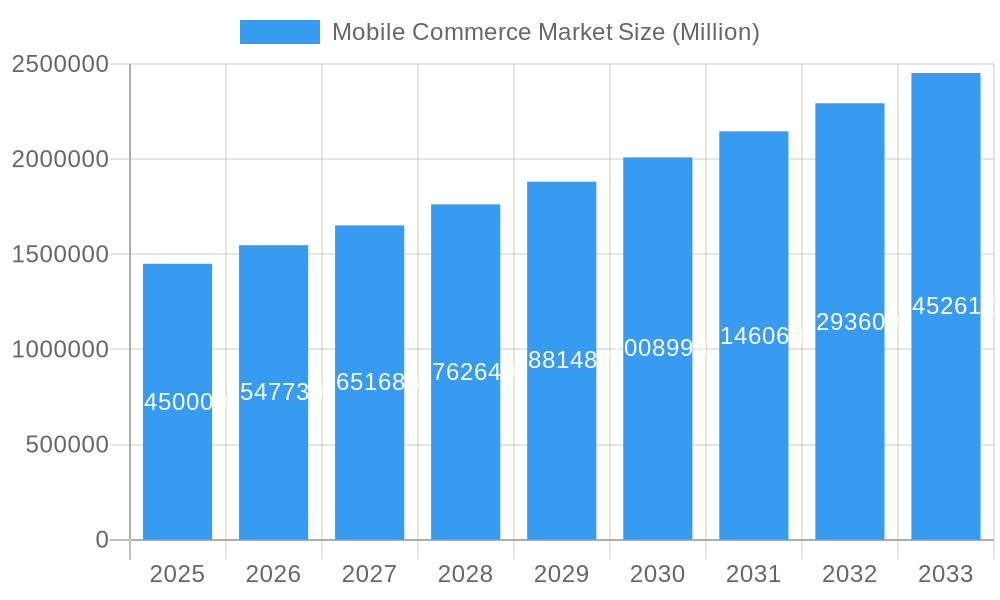
The global mobile commerce market, valued at $1.45 trillion in 2025, is projected to experience robust growth, driven by the increasing penetration of smartphones, widespread internet access, and the rising adoption of digital payment methods. A Compound Annual Growth Rate (CAGR) of 6.54% is anticipated from 2025 to 2033, indicating a significant expansion of the market. Key drivers include the convenience and accessibility offered by mobile shopping, coupled with the seamless integration of e-commerce platforms with mobile devices. The rise of mobile wallets and other digital payment solutions, such as NFC, further fuels this growth, reducing friction in online transactions. Market segmentation reveals significant opportunities across payment modes (NFC, premium SMS, WAP, direct carrier billing) and transaction types (m-retailing, m-ticketing/booking, m-billing). North America and Europe currently hold substantial market shares, but the Asia-Pacific region is expected to witness rapid growth due to its expanding middle class and increasing smartphone adoption. However, challenges such as cybersecurity concerns, data privacy issues, and the digital divide in underdeveloped regions may act as restraints to some extent. The competitive landscape is diverse, with major players like IBM, Ericsson, Visa, Mastercard, Google, PayPal, and SAP actively shaping the market's trajectory through technological advancements and strategic partnerships.
Mobile Commerce Market Market Size (In Million)
The forecast period (2025-2033) promises substantial growth opportunities for mobile commerce. Continuous innovation in mobile payment technologies, coupled with the increasing sophistication of mobile e-commerce platforms, is likely to attract new players and foster further competition. Furthermore, the integration of mobile commerce with emerging technologies like Artificial Intelligence (AI) and the Internet of Things (IoT) presents significant potential for enhancing user experience and expanding market reach. Growth strategies will focus on enhancing security features, personalized shopping experiences, and wider adoption across different demographics and geographical locations. Companies are investing heavily in improving mobile app functionality, optimizing user interfaces, and offering personalized promotions to maintain a competitive edge and cater to evolving consumer preferences.
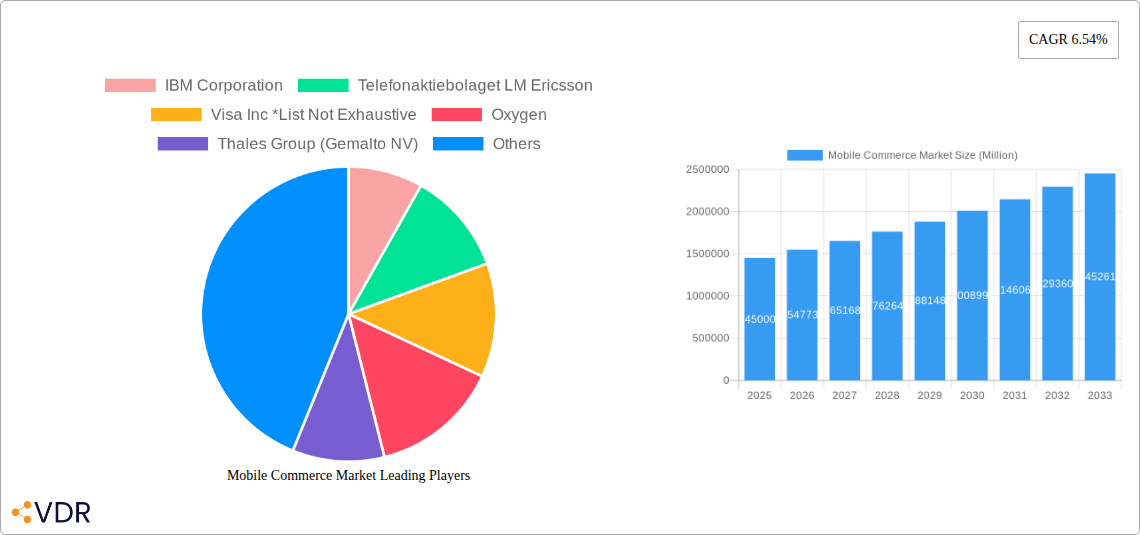
Mobile Commerce Market Company Market Share
Mobile Commerce Market: A Comprehensive Report (2019-2033)
This in-depth report provides a comprehensive analysis of the Mobile Commerce Market, encompassing market dynamics, growth trends, regional dominance, product landscape, key players, and future outlook. With a study period spanning 2019-2033, a base year of 2025, and a forecast period of 2025-2033, this report offers invaluable insights for industry professionals, investors, and strategists seeking to navigate the ever-evolving mobile commerce landscape. The report analyzes the parent market of e-commerce and its child market focusing on mobile commerce transactions. Market values are presented in million units.
Mobile Commerce Market Dynamics & Structure
The mobile commerce market is characterized by a dynamic interplay of factors influencing its structure and growth trajectory. Market concentration is moderate, with several key players holding significant shares, but also considerable room for smaller players to innovate and compete. Technological innovation, particularly in 5G, mobile payment systems (NFC, Direct Carrier Billing), and enhanced security protocols, acts as a primary driver. Regulatory frameworks, varying across jurisdictions, impact data privacy, transaction security, and cross-border payments, creating both opportunities and challenges. Competitive pressures arise from substitutes such as traditional e-commerce and in-person retail, necessitating constant adaptation and innovation within the mobile commerce space. End-user demographics, notably the rising adoption of smartphones and mobile internet access among younger populations and in developing economies, fuels market expansion. Finally, M&A activity is significant, with larger players consolidating their market positions through strategic acquisitions of innovative start-ups and complementary technologies.
- Market Concentration: Moderate, with top 5 players holding approximately xx% market share in 2025.
- Technological Drivers: 5G deployment, advanced mobile payment systems (NFC, Direct Carrier Billing), improved security features (biometrics, tokenization).
- Regulatory Landscape: Varying data privacy regulations (GDPR, CCPA), cross-border payment restrictions, and evolving cybersecurity standards.
- Competitive Substitutes: Traditional e-commerce, in-person retail, and other digital payment platforms.
- End-User Demographics: Growth driven by increasing smartphone penetration, particularly in emerging markets and among younger demographics.
- M&A Activity: xx major M&A deals in the mobile commerce sector between 2019 and 2024, with an estimated value of xx million.
Mobile Commerce Market Growth Trends & Insights
The mobile commerce market exhibits robust growth, fueled by several converging trends. Market size expanded from xx million in 2019 to xx million in 2024, reflecting a CAGR of xx%. This growth is anticipated to continue, with projections indicating a market size of xx million in 2025 and xx million by 2033, representing a CAGR of xx% during the forecast period. Adoption rates are consistently increasing, particularly in regions with high smartphone penetration and reliable internet connectivity. Technological disruptions, such as the rise of 5G and advancements in mobile payment technologies, significantly contribute to market expansion. Consumer behavior shifts, including the increasing preference for mobile shopping, seamless mobile payments, and personalized mobile experiences, further propel market growth. The integration of mobile commerce with social media platforms, the growth of mobile-first businesses, and the rise of mobile wallets all indicate that the adoption rate will continue to grow over the next decade.
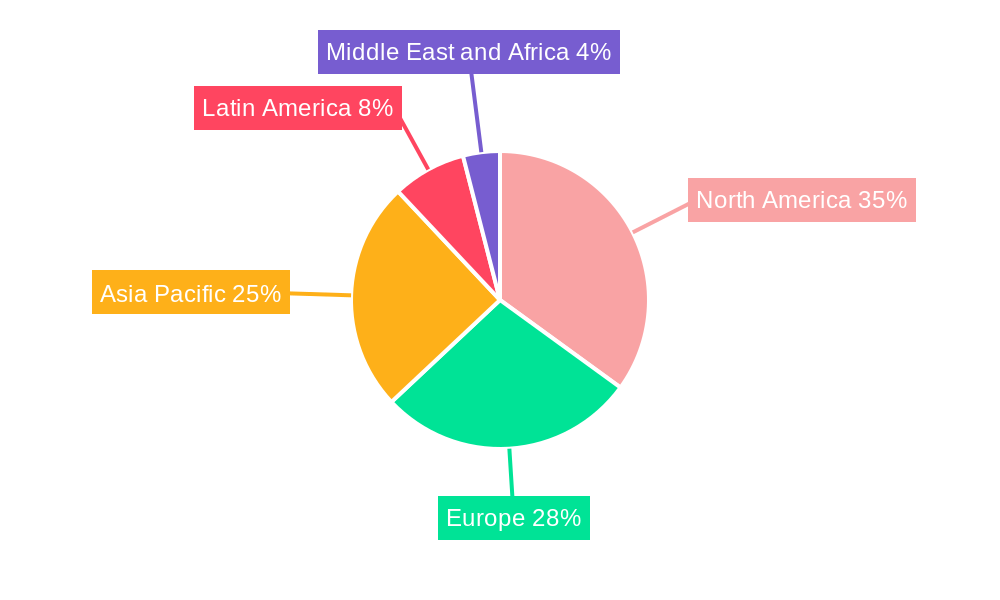
Dominant Regions, Countries, or Segments in Mobile Commerce Market
North America currently holds the largest market share in mobile commerce, driven by high smartphone penetration, robust digital infrastructure, and established e-commerce ecosystems. However, Asia-Pacific is projected to experience the fastest growth rate, fueled by rapid smartphone adoption, increasing internet connectivity, and expanding e-commerce markets in developing economies. Within payment modes, NFC payments are experiencing significant growth due to their convenience and security, while Direct Carrier Billing remains a significant revenue stream, particularly in emerging markets. In terms of transaction types, M-Retailing dominates the market, followed by M-Ticketing/Booking. However, growth opportunities exist in other transaction types, such as M-Billing, driven by increasing digitalization across various industries.
- Key Drivers in North America: High disposable incomes, advanced digital infrastructure, early adoption of mobile technologies.
- Key Drivers in Asia-Pacific: Rapid smartphone penetration, growing internet access, expanding e-commerce markets in developing economies.
- Dominant Payment Mode: NFC, driven by its convenience and security features.
- Dominant Transaction Type: M-Retailing, followed by M-Ticketing/Booking.
- Growth Potential: Asia-Pacific, followed by Latin America and Africa.
Mobile Commerce Market Product Landscape
Mobile commerce solutions are increasingly sophisticated, integrating features such as personalized recommendations, enhanced security protocols, and seamless payment integrations. The focus is on user experience, with innovations aiming to streamline the purchase journey and provide a seamless omnichannel experience. Technological advancements such as AI-powered chatbots for customer service, augmented reality (AR) for product visualization, and blockchain for secure transactions are enhancing the overall mobile commerce experience. Unique selling propositions are centered on convenience, security, personalization, and seamless integration across different platforms.
Key Drivers, Barriers & Challenges in Mobile Commerce Market
Key Drivers: Technological advancements (5G, AI, AR), increasing smartphone penetration, growing consumer preference for mobile shopping, and government initiatives promoting digital payments.
Key Challenges: Security concerns related to mobile transactions, lack of internet access in certain regions, regulatory hurdles concerning data privacy and cross-border payments, and the need to address concerns among consumers about data privacy and mobile security. The cost of maintaining mobile platforms and addressing security issues can also impact the profitability of smaller players.
Emerging Opportunities in Mobile Commerce Market
Untapped markets in emerging economies offer significant growth potential. The integration of mobile commerce with emerging technologies such as the metaverse and Web3 presents new opportunities for immersive shopping experiences. The increasing demand for personalized and location-based mobile commerce services presents opportunities for customized marketing strategies and optimized customer experiences.
Growth Accelerators in the Mobile Commerce Market Industry
Strategic partnerships between technology providers, payment processors, and retailers facilitate market expansion. The development of innovative mobile payment solutions, such as biometrics and tokenization, will improve the security of mobile transactions and consumer confidence. Government initiatives promoting digital financial inclusion will unlock market potential in underserved regions.
Key Players Shaping the Mobile Commerce Market Market
- IBM Corporation
- Telefonaktiebolaget LM Ericsson
- Visa Inc
- Oxygen
- Thales Group (Gemalto NV)
- Mastercard Inc
- Google Inc
- Paypal Holdings Inc
- SAP SE
- Mopay AG
Notable Milestones in Mobile Commerce Market Sector
- September 2023: Ericsson announced a strategy to create a global network platform business with network APIs, partnering with Deutsche Telekom to provide developers and enterprises with communication and network APIs, accelerating enterprise digitization and creating new revenue opportunities for operators.
- March 2023: Amazon Business launched its 3-Way Match app, enabling efficient purchase order closure for nearly 1 million U.S. users, improving business buying strategies and automating reporting.
In-Depth Mobile Commerce Market Outlook
The mobile commerce market is poised for sustained growth, driven by technological innovation, expanding internet access, and shifting consumer preferences. Strategic partnerships and investments in mobile payment infrastructure will further accelerate market expansion. Opportunities abound for businesses that can leverage emerging technologies and provide seamless, secure, and personalized mobile shopping experiences. The future holds immense potential for the mobile commerce sector, transforming how consumers and businesses transact and interact.
Mobile Commerce Market Segmentation
-
1. Transaction Type
- 1.1. M Retailing
- 1.2. M Ticketing/Booking
- 1.3. M Billing
- 1.4. Other Transaction Types
-
2. Payment Mode
- 2.1. Near Field Communication (NFC)
- 2.2. Premium SMS
- 2.3. Wireless Application Protocol (WAP)
- 2.4. Direct Carrier Billing
- 2.5. Other Payment Modes
Mobile Commerce Market Segmentation By Geography
-
1. North America
- 1.1. United States
- 1.2. Canada
-
2. Europe
- 2.1. United Kingdom
- 2.2. Germany
- 2.3. France
- 2.4. Rest of Europe
-
3. Asia Pacific
- 3.1. China
- 3.2. Japan
- 3.3. India
- 3.4. Rest of Asia Pacific
-
4. Latin America
- 4.1. Brazil
- 4.2. Argentina
- 4.3. Rest of Latin America
-
5. Middle East and Africa
- 5.1. UAE
- 5.2. Saudi Arabia
- 5.3. Rest of Middle East and Africa
Mobile Commerce Market Regional Market Share
Geographic Coverage of Mobile Commerce Market
Mobile Commerce Market REPORT HIGHLIGHTS
| Aspects | Details |
|---|---|
| Study Period | 2020-2034 |
| Base Year | 2025 |
| Estimated Year | 2026 |
| Forecast Period | 2026-2034 |
| Historical Period | 2020-2025 |
| Growth Rate | CAGR of 6.54% from 2020-2034 |
| Segmentation |
|
Table of Contents
- 1. Introduction
- 1.1. Research Scope
- 1.2. Market Segmentation
- 1.3. Research Objective
- 1.4. Definitions and Assumptions
- 2. Executive Summary
- 2.1. Market Snapshot
- 3. Market Dynamics
- 3.1. Market Drivers
- 3.2. Market Restrains
- 3.3. Market Trends
- 3.4. Market Opportunities
- 4. Market Factor Analysis
- 4.1. Porters Five Forces
- 4.1.1. Bargaining Power of Suppliers
- 4.1.2. Bargaining Power of Buyers
- 4.1.3. Threat of New Entrants
- 4.1.4. Threat of Substitutes
- 4.1.5. Competitive Rivalry
- 4.2. PESTEL analysis
- 4.3. BCG Analysis
- 4.3.1. Stars (High Growth, High Market Share)
- 4.3.2. Cash Cows (Low Growth, High Market Share)
- 4.3.3. Question Mark (High Growth, Low Market Share)
- 4.3.4. Dogs (Low Growth, Low Market Share)
- 4.4. Ansoff Matrix Analysis
- 4.5. Supply Chain Analysis
- 4.6. Regulatory Landscape
- 4.7. Current Market Potential and Opportunity Assessment (TAM–SAM–SOM Framework)
- 4.8. VDR Analyst Note
- 4.1. Porters Five Forces
- 5. Market Analysis, Insights and Forecast 2021-2033
- 5.1. Market Analysis, Insights and Forecast - by Transaction Type
- 5.1.1. M Retailing
- 5.1.2. M Ticketing/Booking
- 5.1.3. M Billing
- 5.1.4. Other Transaction Types
- 5.2. Market Analysis, Insights and Forecast - by Payment Mode
- 5.2.1. Near Field Communication (NFC)
- 5.2.2. Premium SMS
- 5.2.3. Wireless Application Protocol (WAP)
- 5.2.4. Direct Carrier Billing
- 5.2.5. Other Payment Modes
- 5.3. Market Analysis, Insights and Forecast - by Region
- 5.3.1. North America
- 5.3.2. Europe
- 5.3.3. Asia Pacific
- 5.3.4. Latin America
- 5.3.5. Middle East and Africa
- 5.1. Market Analysis, Insights and Forecast - by Transaction Type
- 6. Global Mobile Commerce Market Analysis, Insights and Forecast, 2021-2033
- 6.1. Market Analysis, Insights and Forecast - by Transaction Type
- 6.1.1. M Retailing
- 6.1.2. M Ticketing/Booking
- 6.1.3. M Billing
- 6.1.4. Other Transaction Types
- 6.2. Market Analysis, Insights and Forecast - by Payment Mode
- 6.2.1. Near Field Communication (NFC)
- 6.2.2. Premium SMS
- 6.2.3. Wireless Application Protocol (WAP)
- 6.2.4. Direct Carrier Billing
- 6.2.5. Other Payment Modes
- 6.1. Market Analysis, Insights and Forecast - by Transaction Type
- 7. North America Mobile Commerce Market Analysis, Insights and Forecast, 2021-2033
- 7.1. Market Analysis, Insights and Forecast - by Transaction Type
- 7.1.1. M Retailing
- 7.1.2. M Ticketing/Booking
- 7.1.3. M Billing
- 7.1.4. Other Transaction Types
- 7.2. Market Analysis, Insights and Forecast - by Payment Mode
- 7.2.1. Near Field Communication (NFC)
- 7.2.2. Premium SMS
- 7.2.3. Wireless Application Protocol (WAP)
- 7.2.4. Direct Carrier Billing
- 7.2.5. Other Payment Modes
- 7.1. Market Analysis, Insights and Forecast - by Transaction Type
- 8. Europe Mobile Commerce Market Analysis, Insights and Forecast, 2021-2033
- 8.1. Market Analysis, Insights and Forecast - by Transaction Type
- 8.1.1. M Retailing
- 8.1.2. M Ticketing/Booking
- 8.1.3. M Billing
- 8.1.4. Other Transaction Types
- 8.2. Market Analysis, Insights and Forecast - by Payment Mode
- 8.2.1. Near Field Communication (NFC)
- 8.2.2. Premium SMS
- 8.2.3. Wireless Application Protocol (WAP)
- 8.2.4. Direct Carrier Billing
- 8.2.5. Other Payment Modes
- 8.1. Market Analysis, Insights and Forecast - by Transaction Type
- 9. Asia Pacific Mobile Commerce Market Analysis, Insights and Forecast, 2021-2033
- 9.1. Market Analysis, Insights and Forecast - by Transaction Type
- 9.1.1. M Retailing
- 9.1.2. M Ticketing/Booking
- 9.1.3. M Billing
- 9.1.4. Other Transaction Types
- 9.2. Market Analysis, Insights and Forecast - by Payment Mode
- 9.2.1. Near Field Communication (NFC)
- 9.2.2. Premium SMS
- 9.2.3. Wireless Application Protocol (WAP)
- 9.2.4. Direct Carrier Billing
- 9.2.5. Other Payment Modes
- 9.1. Market Analysis, Insights and Forecast - by Transaction Type
- 10. Latin America Mobile Commerce Market Analysis, Insights and Forecast, 2021-2033
- 10.1. Market Analysis, Insights and Forecast - by Transaction Type
- 10.1.1. M Retailing
- 10.1.2. M Ticketing/Booking
- 10.1.3. M Billing
- 10.1.4. Other Transaction Types
- 10.2. Market Analysis, Insights and Forecast - by Payment Mode
- 10.2.1. Near Field Communication (NFC)
- 10.2.2. Premium SMS
- 10.2.3. Wireless Application Protocol (WAP)
- 10.2.4. Direct Carrier Billing
- 10.2.5. Other Payment Modes
- 10.1. Market Analysis, Insights and Forecast - by Transaction Type
- 11. Middle East and Africa Mobile Commerce Market Analysis, Insights and Forecast, 2021-2033
- 11.1. Market Analysis, Insights and Forecast - by Transaction Type
- 11.1.1. M Retailing
- 11.1.2. M Ticketing/Booking
- 11.1.3. M Billing
- 11.1.4. Other Transaction Types
- 11.2. Market Analysis, Insights and Forecast - by Payment Mode
- 11.2.1. Near Field Communication (NFC)
- 11.2.2. Premium SMS
- 11.2.3. Wireless Application Protocol (WAP)
- 11.2.4. Direct Carrier Billing
- 11.2.5. Other Payment Modes
- 11.1. Market Analysis, Insights and Forecast - by Transaction Type
- 12. Competitive Analysis
- 12.1. Company Profiles
- 12.1.1 IBM Corporation
- 12.1.1.1. Company Overview
- 12.1.1.2. Products
- 12.1.1.3. Company Financials
- 12.1.1.4. SWOT Analysis
- 12.1.2 Telefonaktiebolaget LM Ericsson
- 12.1.2.1. Company Overview
- 12.1.2.2. Products
- 12.1.2.3. Company Financials
- 12.1.2.4. SWOT Analysis
- 12.1.3 Visa Inc *List Not Exhaustive
- 12.1.3.1. Company Overview
- 12.1.3.2. Products
- 12.1.3.3. Company Financials
- 12.1.3.4. SWOT Analysis
- 12.1.4 Oxygen
- 12.1.4.1. Company Overview
- 12.1.4.2. Products
- 12.1.4.3. Company Financials
- 12.1.4.4. SWOT Analysis
- 12.1.5 Thales Group (Gemalto NV)
- 12.1.5.1. Company Overview
- 12.1.5.2. Products
- 12.1.5.3. Company Financials
- 12.1.5.4. SWOT Analysis
- 12.1.6 Mastercard Inc
- 12.1.6.1. Company Overview
- 12.1.6.2. Products
- 12.1.6.3. Company Financials
- 12.1.6.4. SWOT Analysis
- 12.1.7 Google Inc
- 12.1.7.1. Company Overview
- 12.1.7.2. Products
- 12.1.7.3. Company Financials
- 12.1.7.4. SWOT Analysis
- 12.1.8 Paypal Holdings Inc
- 12.1.8.1. Company Overview
- 12.1.8.2. Products
- 12.1.8.3. Company Financials
- 12.1.8.4. SWOT Analysis
- 12.1.9 SAP SE
- 12.1.9.1. Company Overview
- 12.1.9.2. Products
- 12.1.9.3. Company Financials
- 12.1.9.4. SWOT Analysis
- 12.1.10 Mopay AG
- 12.1.10.1. Company Overview
- 12.1.10.2. Products
- 12.1.10.3. Company Financials
- 12.1.10.4. SWOT Analysis
- 12.1.1 IBM Corporation
- 12.2. Market Entropy
- 12.2.1 Company's Key Areas Served
- 12.2.2 Recent Developments
- 12.3. Company Market Share Analysis 2025
- 12.3.1 Top 5 Companies Market Share Analysis
- 12.3.2 Top 3 Companies Market Share Analysis
- 12.4. List of Potential Customers
- 13. Research Methodology
List of Figures
- Figure 1: Global Mobile Commerce Market Revenue Breakdown (Million, %) by Region 2025 & 2033
- Figure 2: North America Mobile Commerce Market Revenue (Million), by Transaction Type 2025 & 2033
- Figure 3: North America Mobile Commerce Market Revenue Share (%), by Transaction Type 2025 & 2033
- Figure 4: North America Mobile Commerce Market Revenue (Million), by Payment Mode 2025 & 2033
- Figure 5: North America Mobile Commerce Market Revenue Share (%), by Payment Mode 2025 & 2033
- Figure 6: North America Mobile Commerce Market Revenue (Million), by Country 2025 & 2033
- Figure 7: North America Mobile Commerce Market Revenue Share (%), by Country 2025 & 2033
- Figure 8: Europe Mobile Commerce Market Revenue (Million), by Transaction Type 2025 & 2033
- Figure 9: Europe Mobile Commerce Market Revenue Share (%), by Transaction Type 2025 & 2033
- Figure 10: Europe Mobile Commerce Market Revenue (Million), by Payment Mode 2025 & 2033
- Figure 11: Europe Mobile Commerce Market Revenue Share (%), by Payment Mode 2025 & 2033
- Figure 12: Europe Mobile Commerce Market Revenue (Million), by Country 2025 & 2033
- Figure 13: Europe Mobile Commerce Market Revenue Share (%), by Country 2025 & 2033
- Figure 14: Asia Pacific Mobile Commerce Market Revenue (Million), by Transaction Type 2025 & 2033
- Figure 15: Asia Pacific Mobile Commerce Market Revenue Share (%), by Transaction Type 2025 & 2033
- Figure 16: Asia Pacific Mobile Commerce Market Revenue (Million), by Payment Mode 2025 & 2033
- Figure 17: Asia Pacific Mobile Commerce Market Revenue Share (%), by Payment Mode 2025 & 2033
- Figure 18: Asia Pacific Mobile Commerce Market Revenue (Million), by Country 2025 & 2033
- Figure 19: Asia Pacific Mobile Commerce Market Revenue Share (%), by Country 2025 & 2033
- Figure 20: Latin America Mobile Commerce Market Revenue (Million), by Transaction Type 2025 & 2033
- Figure 21: Latin America Mobile Commerce Market Revenue Share (%), by Transaction Type 2025 & 2033
- Figure 22: Latin America Mobile Commerce Market Revenue (Million), by Payment Mode 2025 & 2033
- Figure 23: Latin America Mobile Commerce Market Revenue Share (%), by Payment Mode 2025 & 2033
- Figure 24: Latin America Mobile Commerce Market Revenue (Million), by Country 2025 & 2033
- Figure 25: Latin America Mobile Commerce Market Revenue Share (%), by Country 2025 & 2033
- Figure 26: Middle East and Africa Mobile Commerce Market Revenue (Million), by Transaction Type 2025 & 2033
- Figure 27: Middle East and Africa Mobile Commerce Market Revenue Share (%), by Transaction Type 2025 & 2033
- Figure 28: Middle East and Africa Mobile Commerce Market Revenue (Million), by Payment Mode 2025 & 2033
- Figure 29: Middle East and Africa Mobile Commerce Market Revenue Share (%), by Payment Mode 2025 & 2033
- Figure 30: Middle East and Africa Mobile Commerce Market Revenue (Million), by Country 2025 & 2033
- Figure 31: Middle East and Africa Mobile Commerce Market Revenue Share (%), by Country 2025 & 2033
List of Tables
- Table 1: Global Mobile Commerce Market Revenue Million Forecast, by Transaction Type 2020 & 2033
- Table 2: Global Mobile Commerce Market Revenue Million Forecast, by Payment Mode 2020 & 2033
- Table 3: Global Mobile Commerce Market Revenue Million Forecast, by Region 2020 & 2033
- Table 4: Global Mobile Commerce Market Revenue Million Forecast, by Transaction Type 2020 & 2033
- Table 5: Global Mobile Commerce Market Revenue Million Forecast, by Payment Mode 2020 & 2033
- Table 6: Global Mobile Commerce Market Revenue Million Forecast, by Country 2020 & 2033
- Table 7: United States Mobile Commerce Market Revenue (Million) Forecast, by Application 2020 & 2033
- Table 8: Canada Mobile Commerce Market Revenue (Million) Forecast, by Application 2020 & 2033
- Table 9: Global Mobile Commerce Market Revenue Million Forecast, by Transaction Type 2020 & 2033
- Table 10: Global Mobile Commerce Market Revenue Million Forecast, by Payment Mode 2020 & 2033
- Table 11: Global Mobile Commerce Market Revenue Million Forecast, by Country 2020 & 2033
- Table 12: United Kingdom Mobile Commerce Market Revenue (Million) Forecast, by Application 2020 & 2033
- Table 13: Germany Mobile Commerce Market Revenue (Million) Forecast, by Application 2020 & 2033
- Table 14: France Mobile Commerce Market Revenue (Million) Forecast, by Application 2020 & 2033
- Table 15: Rest of Europe Mobile Commerce Market Revenue (Million) Forecast, by Application 2020 & 2033
- Table 16: Global Mobile Commerce Market Revenue Million Forecast, by Transaction Type 2020 & 2033
- Table 17: Global Mobile Commerce Market Revenue Million Forecast, by Payment Mode 2020 & 2033
- Table 18: Global Mobile Commerce Market Revenue Million Forecast, by Country 2020 & 2033
- Table 19: China Mobile Commerce Market Revenue (Million) Forecast, by Application 2020 & 2033
- Table 20: Japan Mobile Commerce Market Revenue (Million) Forecast, by Application 2020 & 2033
- Table 21: India Mobile Commerce Market Revenue (Million) Forecast, by Application 2020 & 2033
- Table 22: Rest of Asia Pacific Mobile Commerce Market Revenue (Million) Forecast, by Application 2020 & 2033
- Table 23: Global Mobile Commerce Market Revenue Million Forecast, by Transaction Type 2020 & 2033
- Table 24: Global Mobile Commerce Market Revenue Million Forecast, by Payment Mode 2020 & 2033
- Table 25: Global Mobile Commerce Market Revenue Million Forecast, by Country 2020 & 2033
- Table 26: Brazil Mobile Commerce Market Revenue (Million) Forecast, by Application 2020 & 2033
- Table 27: Argentina Mobile Commerce Market Revenue (Million) Forecast, by Application 2020 & 2033
- Table 28: Rest of Latin America Mobile Commerce Market Revenue (Million) Forecast, by Application 2020 & 2033
- Table 29: Global Mobile Commerce Market Revenue Million Forecast, by Transaction Type 2020 & 2033
- Table 30: Global Mobile Commerce Market Revenue Million Forecast, by Payment Mode 2020 & 2033
- Table 31: Global Mobile Commerce Market Revenue Million Forecast, by Country 2020 & 2033
- Table 32: UAE Mobile Commerce Market Revenue (Million) Forecast, by Application 2020 & 2033
- Table 33: Saudi Arabia Mobile Commerce Market Revenue (Million) Forecast, by Application 2020 & 2033
- Table 34: Rest of Middle East and Africa Mobile Commerce Market Revenue (Million) Forecast, by Application 2020 & 2033
Frequently Asked Questions
1. What is the projected Compound Annual Growth Rate (CAGR) of the Mobile Commerce Market?
The projected CAGR is approximately 6.54%.
2. Which companies are prominent players in the Mobile Commerce Market?
Key companies in the market include IBM Corporation, Telefonaktiebolaget LM Ericsson, Visa Inc *List Not Exhaustive, Oxygen, Thales Group (Gemalto NV), Mastercard Inc, Google Inc, Paypal Holdings Inc, SAP SE, Mopay AG.
3. What are the main segments of the Mobile Commerce Market?
The market segments include Transaction Type, Payment Mode.
4. Can you provide details about the market size?
The market size is estimated to be USD 1.45 Million as of 2022.
5. What are some drivers contributing to market growth?
Growth of Smartphones and Internet Penetration Drive the M-commerce Market; Broader Reach Due to Mobility.
6. What are the notable trends driving market growth?
Growth of Smartphones And Internet Penetration Is Anticipated To Drive The M-commerce Market.
7. Are there any restraints impacting market growth?
Lack of High Number Mobile Compatible Websites.
8. Can you provide examples of recent developments in the market?
September 2023: Ericsson announced the company’s strategy to create a global network platform business with network APIs. A commercial partnership has been formed between Ericsson and Deutsche Telekom to provide developers and enterprises with communication and network APIs. The central part of the Ericsson enterprise strategy is to build a Global Platform for exposing advanced 5G capabilities, e.g., quality on demand, speed, latency, and location via simple use of Network APIs. This will make it easier for developers and businesses to integrate network features in their applications, accelerating the digitization of enterprises and creating new opportunities for operators to derive revenue from these investments.
9. What pricing options are available for accessing the report?
Pricing options include single-user, multi-user, and enterprise licenses priced at USD 4750, USD 5250, and USD 8750 respectively.
10. Is the market size provided in terms of value or volume?
The market size is provided in terms of value, measured in Million.
11. Are there any specific market keywords associated with the report?
Yes, the market keyword associated with the report is "Mobile Commerce Market," which aids in identifying and referencing the specific market segment covered.
12. How do I determine which pricing option suits my needs best?
The pricing options vary based on user requirements and access needs. Individual users may opt for single-user licenses, while businesses requiring broader access may choose multi-user or enterprise licenses for cost-effective access to the report.
13. Are there any additional resources or data provided in the Mobile Commerce Market report?
While the report offers comprehensive insights, it's advisable to review the specific contents or supplementary materials provided to ascertain if additional resources or data are available.
14. How can I stay updated on further developments or reports in the Mobile Commerce Market?
To stay informed about further developments, trends, and reports in the Mobile Commerce Market, consider subscribing to industry newsletters, following relevant companies and organizations, or regularly checking reputable industry news sources and publications.
Methodology
Step 1 - Identification of Relevant Samples Size from Population Database


Step 2 - Approaches for Defining Global Market Size (Value, Volume* & Price*)

Note*: In applicable scenarios
Step 3 - Data Sources
Primary Research
- Web Analytics
- Survey Reports
- Research Institute
- Latest Research Reports
- Opinion Leaders
Secondary Research
- Annual Reports
- White Paper
- Latest Press Release
- Industry Association
- Paid Database
- Investor Presentations

Step 4 - Data Triangulation
Involves using different sources of information in order to increase the validity of a study
These sources are likely to be stakeholders in a program - participants, other researchers, program staff, other community members, and so on.
Then we put all data in single framework & apply various statistical tools to find out the dynamic on the market.
During the analysis stage, feedback from the stakeholder groups would be compared to determine areas of agreement as well as areas of divergence