
Key Insights
The MEA (Middle East and Africa) diesel genset market, valued at approximately $280 million in 2025, exhibits robust growth potential, driven by increasing power demand, particularly in regions with unreliable grid infrastructure. This growth is projected to continue at a Compound Annual Growth Rate (CAGR) exceeding 4.10% through 2033. Key drivers include expanding industrialization, rising urbanization, and the surging adoption of diesel gensets in diverse applications such as prime power, backup power, and peak shaving. The market is segmented by power rating, with the 75-375 kVA segment likely holding the largest market share due to its suitability for a wide range of commercial and industrial applications. However, growth in the above 375 kVA segment is anticipated to be significant, driven by large-scale infrastructure projects. While challenges such as stringent emission regulations and the rising cost of diesel fuel pose restraints, the demand for reliable power sources in rapidly developing economies is expected to outweigh these factors. Key players like Perkins, Caterpillar, and Cummins are strategically investing in advanced technology and expanding their distribution networks to capitalize on this growth. Specific regional variations within MEA are anticipated; countries with higher infrastructure development needs and less reliable grid infrastructure are likely to exhibit faster growth rates compared to those with more developed power grids.
The competitive landscape is characterized by both established international players and regional manufacturers. International companies leverage their technological advancements and global reach, while regional players benefit from their localized understanding of the market and their ability to cater to specific customer needs. The market’s future trajectory will depend on factors such as government initiatives promoting renewable energy sources, economic growth rates within each MEA country, and the overall reliability of national power grids. Strategic partnerships and mergers & acquisitions can be expected among market players to expand their footprint and technological capabilities, further shaping the landscape of the MEA diesel genset market. The consistent need for reliable power, especially considering the unpredictable nature of some regional grids, ensures the continued relevance and growth of this sector.
MEA Diesel Genset Industry Market Report: 2019-2033
This comprehensive report provides an in-depth analysis of the Middle East and Africa (MEA) diesel genset industry, encompassing market dynamics, growth trends, regional dominance, product landscapes, and key players. The study period spans from 2019 to 2033, with 2025 serving as the base and estimated year. This report is crucial for industry professionals, investors, and strategic decision-makers seeking to navigate this evolving market.
MEA Diesel Genset Industry Market Dynamics & Structure
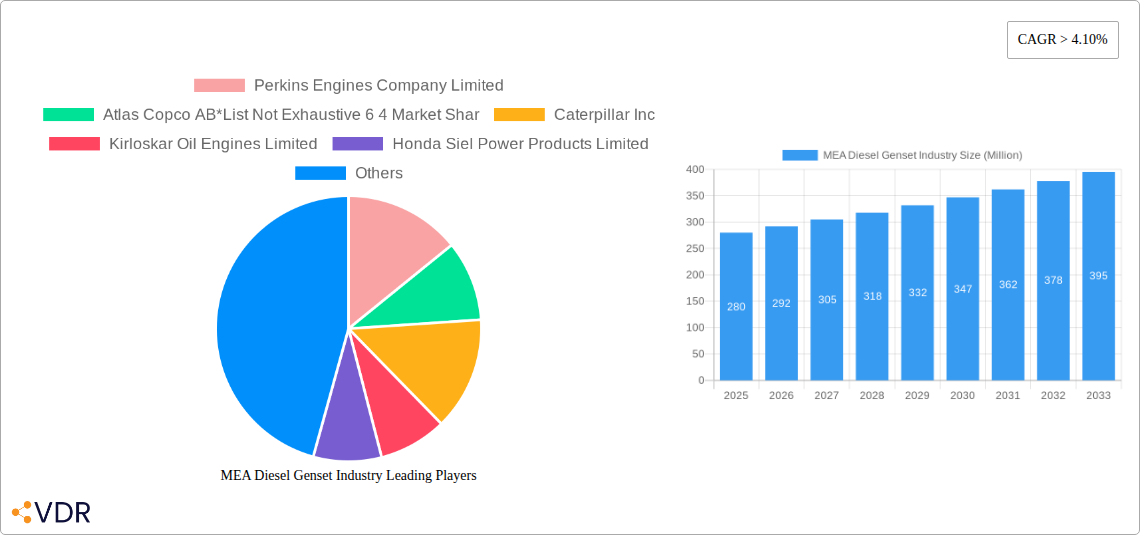
The MEA diesel genset market is characterized by moderate concentration, with key players like Perkins Engines Company Limited, Atlas Copco AB, Caterpillar Inc, Kirloskar Oil Engines Limited, Honda Siel Power Products Limited, Cummins Inc, Yanmar Holdings Co Ltd, Mitsubishi Heavy Industries Ltd, Kohler Co., and MTU Onsite Energy (a Rolls-Royce Power Systems company) holding a combined xx% market share in 2025. The market is driven by technological innovations focusing on efficiency and emissions reduction, while regulatory frameworks concerning emissions standards and safety significantly influence market development. Growing urbanization, industrialization, and infrastructure development across the MEA region fuel demand. However, the increasing adoption of renewable energy sources presents a competitive threat. M&A activity within the sector remains moderate, with approximately xx deals recorded in the historical period (2019-2024), primarily focusing on expanding market reach and technological capabilities.
- Market Concentration: xx% held by top 10 players in 2025.
- Technological Drivers: Focus on fuel efficiency, emissions reduction (Tier 4/Stage V compliance), and automation.
- Regulatory Landscape: Varying emission standards across MEA countries.
- Competitive Substitutes: Renewable energy sources (solar, wind), grid electricity.
- End-User Demographics: Primarily industrial, commercial, and residential sectors.
- M&A Trends: Focus on expansion into new markets and technological advancements.
MEA Diesel Genset Industry Growth Trends & Insights
The MEA diesel genset market witnessed a CAGR of xx% during the historical period (2019-2024), reaching a market size of xx million units in 2024. Driven by increasing power demands across various sectors, the market is projected to expand at a CAGR of xx% during the forecast period (2025-2033), reaching xx million units by 2033. This growth is influenced by rising urbanization, industrial expansion, and infrastructure development, particularly in rapidly developing economies within the region. However, the transition towards renewable energy sources and fluctuating fuel prices present challenges. Adoption rates of advanced technologies, like digital controls and remote monitoring, are gradually increasing, reflecting a shift towards enhanced efficiency and operational optimization. Consumer behavior is shifting towards prioritizing fuel efficiency, lower emissions, and reliable performance.

Dominant Regions, Countries, or Segments in MEA Diesel Genset Industry
The xx region within MEA is currently the leading market for diesel gensets, driven by significant infrastructure projects and rapid economic growth. High population density and industrial activity also contribute to the region's dominance. Within the application segments, Prime Power accounts for the largest share (xx%), followed by Backup Power (xx%) and Peak Shaving (xx%). In terms of ratings, the 75-375 kVA segment commands the largest market share (xx%), reflecting the needs of medium-sized industries and commercial establishments.
- Key Drivers in the xx Region: Rapid urbanization, significant infrastructure investments, and industrial expansion.
- Prime Power Segment Dominance: Driven by reliable electricity needs for crucial operations.
- 75-375 kVA Segment Leadership: Catering to the needs of medium-sized enterprises and commercial entities.
MEA Diesel Genset Industry Product Landscape
The MEA diesel genset market offers a range of products categorized by power output (kVA), fuel type, and technological features. Recent innovations focus on enhancing fuel efficiency, reducing noise pollution, and improving emissions through advanced engine technologies and emission control systems. Manufacturers are increasingly incorporating smart features like remote monitoring and predictive maintenance capabilities, optimizing genset operation and extending lifespan. Key selling propositions include durability, reliability, ease of maintenance, and lower total cost of ownership.
Key Drivers, Barriers & Challenges in MEA Diesel Genset Industry
Key Drivers:
- Rising electricity demand fueled by population growth and industrialization.
- Government investments in infrastructure development.
- Increased adoption of backup power solutions due to unreliable grid electricity.
Key Challenges:
- Fluctuating fuel prices impacting operational costs.
- Stringent emission regulations requiring technological upgrades.
- Competition from renewable energy sources.
- Supply chain disruptions impacting equipment availability and pricing.
Emerging Opportunities in MEA Diesel Genset Industry
- Growing demand for silent gensets in residential and commercial applications.
- Expansion into off-grid and remote areas with limited grid access.
- Integration of smart technologies for remote monitoring and predictive maintenance.
- Development of hybrid power systems combining diesel gensets with renewable energy sources.
Growth Accelerators in the MEA Diesel Genset Industry
Technological advancements in engine efficiency and emission control, coupled with strategic partnerships between manufacturers and distributors, are key growth catalysts. Expansion into untapped markets within the MEA region and the development of innovative financing models can further accelerate market growth. The increasing demand for reliable power across diverse sectors continues to present substantial growth opportunities.
Key Players Shaping the MEA Diesel Genset Industry Market
- Perkins Engines Company Limited
- Atlas Copco AB
- Caterpillar Inc
- Kirloskar Oil Engines Limited
- Honda Siel Power Products Limited
- Cummins Inc
- Yanmar Holdings Co Ltd
- Mitsubishi Heavy Industries Ltd
- Kohler Co.
- MTU Onsite Energy (a Rolls-Royce Power Systems company)
Notable Milestones in MEA Diesel Genset Industry Sector
- December 2023: Nigeria secures a USD 750 million World Bank loan for the DARES project, aiming to improve electricity access and reduce reliance on diesel generators.
- August 2023: Guangxi Dingbo Power Equipment Manufacturing Co. Ltd secures a diesel generator order from Iran.
In-Depth MEA Diesel Genset Industry Market Outlook
The MEA diesel genset market is poised for continued growth, driven by sustained infrastructure development, industrial expansion, and rising electricity demand. Strategic investments in technological advancements, focusing on efficiency, emission reduction, and smart features, will shape the future of the industry. Partnerships fostering market access and innovative financing solutions will be crucial for long-term success. The market presents significant opportunities for both established players and new entrants to capitalize on the growing demand for reliable and sustainable power solutions across the diverse regions of the MEA.
MEA Diesel Genset Industry Segmentation
-
1. Ratings
- 1.1. 0-75 kVA
- 1.2. 75-375 kVA
- 1.3. Above 375 kVA
-
2. Application
- 2.1. Prime Power
- 2.2. Backup Power
- 2.3. Peak Shaving
MEA Diesel Genset Industry Segmentation By Geography
- 1. Nigeria
- 2. Iraq
- 3. Saudi Arabia
- 4. United Arab Emirates
- 5. Qatar
- 6. Rest of Middle East and Africa

MEA Diesel Genset Industry REPORT HIGHLIGHTS
| Aspects | Details |
|---|---|
| Study Period | 2019-2033 |
| Base Year | 2024 |
| Estimated Year | 2025 |
| Forecast Period | 2025-2033 |
| Historical Period | 2019-2024 |
| Growth Rate | CAGR of > 4.10% from 2019-2033 |
| Segmentation |
|
Table of Contents
- 1. Introduction
- 1.1. Research Scope
- 1.2. Market Segmentation
- 1.3. Research Methodology
- 1.4. Definitions and Assumptions
- 2. Executive Summary
- 2.1. Introduction
- 3. Market Dynamics
- 3.1. Introduction
- 3.2. Market Drivers
- 3.2.1. 4.; Unreliable Power Supply4.; Construction and Infrastructure Projects
- 3.3. Market Restrains
- 3.3.1. 4.; Environmental Concerns
- 3.4. Market Trends
- 3.4.1. Backup Generator Segment to Dominate the Market
- 4. Market Factor Analysis
- 4.1. Porters Five Forces
- 4.2. Supply/Value Chain
- 4.3. PESTEL analysis
- 4.4. Market Entropy
- 4.5. Patent/Trademark Analysis
- 5. Global MEA Diesel Genset Industry Analysis, Insights and Forecast, 2019-2031
- 5.1. Market Analysis, Insights and Forecast - by Ratings
- 5.1.1. 0-75 kVA
- 5.1.2. 75-375 kVA
- 5.1.3. Above 375 kVA
- 5.2. Market Analysis, Insights and Forecast - by Application
- 5.2.1. Prime Power
- 5.2.2. Backup Power
- 5.2.3. Peak Shaving
- 5.3. Market Analysis, Insights and Forecast - by Region
- 5.3.1. Nigeria
- 5.3.2. Iraq
- 5.3.3. Saudi Arabia
- 5.3.4. United Arab Emirates
- 5.3.5. Qatar
- 5.3.6. Rest of Middle East and Africa
- 5.1. Market Analysis, Insights and Forecast - by Ratings
- 6. Nigeria MEA Diesel Genset Industry Analysis, Insights and Forecast, 2019-2031
- 6.1. Market Analysis, Insights and Forecast - by Ratings
- 6.1.1. 0-75 kVA
- 6.1.2. 75-375 kVA
- 6.1.3. Above 375 kVA
- 6.2. Market Analysis, Insights and Forecast - by Application
- 6.2.1. Prime Power
- 6.2.2. Backup Power
- 6.2.3. Peak Shaving
- 6.1. Market Analysis, Insights and Forecast - by Ratings
- 7. Iraq MEA Diesel Genset Industry Analysis, Insights and Forecast, 2019-2031
- 7.1. Market Analysis, Insights and Forecast - by Ratings
- 7.1.1. 0-75 kVA
- 7.1.2. 75-375 kVA
- 7.1.3. Above 375 kVA
- 7.2. Market Analysis, Insights and Forecast - by Application
- 7.2.1. Prime Power
- 7.2.2. Backup Power
- 7.2.3. Peak Shaving
- 7.1. Market Analysis, Insights and Forecast - by Ratings
- 8. Saudi Arabia MEA Diesel Genset Industry Analysis, Insights and Forecast, 2019-2031
- 8.1. Market Analysis, Insights and Forecast - by Ratings
- 8.1.1. 0-75 kVA
- 8.1.2. 75-375 kVA
- 8.1.3. Above 375 kVA
- 8.2. Market Analysis, Insights and Forecast - by Application
- 8.2.1. Prime Power
- 8.2.2. Backup Power
- 8.2.3. Peak Shaving
- 8.1. Market Analysis, Insights and Forecast - by Ratings
- 9. United Arab Emirates MEA Diesel Genset Industry Analysis, Insights and Forecast, 2019-2031
- 9.1. Market Analysis, Insights and Forecast - by Ratings
- 9.1.1. 0-75 kVA
- 9.1.2. 75-375 kVA
- 9.1.3. Above 375 kVA
- 9.2. Market Analysis, Insights and Forecast - by Application
- 9.2.1. Prime Power
- 9.2.2. Backup Power
- 9.2.3. Peak Shaving
- 9.1. Market Analysis, Insights and Forecast - by Ratings
- 10. Qatar MEA Diesel Genset Industry Analysis, Insights and Forecast, 2019-2031
- 10.1. Market Analysis, Insights and Forecast - by Ratings
- 10.1.1. 0-75 kVA
- 10.1.2. 75-375 kVA
- 10.1.3. Above 375 kVA
- 10.2. Market Analysis, Insights and Forecast - by Application
- 10.2.1. Prime Power
- 10.2.2. Backup Power
- 10.2.3. Peak Shaving
- 10.1. Market Analysis, Insights and Forecast - by Ratings
- 11. Rest of Middle East and Africa MEA Diesel Genset Industry Analysis, Insights and Forecast, 2019-2031
- 11.1. Market Analysis, Insights and Forecast - by Ratings
- 11.1.1. 0-75 kVA
- 11.1.2. 75-375 kVA
- 11.1.3. Above 375 kVA
- 11.2. Market Analysis, Insights and Forecast - by Application
- 11.2.1. Prime Power
- 11.2.2. Backup Power
- 11.2.3. Peak Shaving
- 11.1. Market Analysis, Insights and Forecast - by Ratings
- 12. North America MEA Diesel Genset Industry Analysis, Insights and Forecast, 2019-2031
- 12.1. Market Analysis, Insights and Forecast - By Country/Sub-region
- 12.1.1 United States
- 12.1.2 Canada
- 12.1.3 Mexico
- 13. Europe MEA Diesel Genset Industry Analysis, Insights and Forecast, 2019-2031
- 13.1. Market Analysis, Insights and Forecast - By Country/Sub-region
- 13.1.1 Germany
- 13.1.2 United Kingdom
- 13.1.3 France
- 13.1.4 Spain
- 13.1.5 Italy
- 13.1.6 Spain
- 13.1.7 Belgium
- 13.1.8 Netherland
- 13.1.9 Nordics
- 13.1.10 Rest of Europe
- 14. Asia Pacific MEA Diesel Genset Industry Analysis, Insights and Forecast, 2019-2031
- 14.1. Market Analysis, Insights and Forecast - By Country/Sub-region
- 14.1.1 China
- 14.1.2 Japan
- 14.1.3 India
- 14.1.4 South Korea
- 14.1.5 Southeast Asia
- 14.1.6 Australia
- 14.1.7 Indonesia
- 14.1.8 Phillipes
- 14.1.9 Singapore
- 14.1.10 Thailandc
- 14.1.11 Rest of Asia Pacific
- 15. South America MEA Diesel Genset Industry Analysis, Insights and Forecast, 2019-2031
- 15.1. Market Analysis, Insights and Forecast - By Country/Sub-region
- 15.1.1 Brazil
- 15.1.2 Argentina
- 15.1.3 Peru
- 15.1.4 Chile
- 15.1.5 Colombia
- 15.1.6 Ecuador
- 15.1.7 Venezuela
- 15.1.8 Rest of South America
- 16. North America MEA Diesel Genset Industry Analysis, Insights and Forecast, 2019-2031
- 16.1. Market Analysis, Insights and Forecast - By Country/Sub-region
- 16.1.1 United States
- 16.1.2 Canada
- 16.1.3 Mexico
- 17. MEA MEA Diesel Genset Industry Analysis, Insights and Forecast, 2019-2031
- 17.1. Market Analysis, Insights and Forecast - By Country/Sub-region
- 17.1.1 United Arab Emirates
- 17.1.2 Saudi Arabia
- 17.1.3 South Africa
- 17.1.4 Rest of Middle East and Africa
- 18. Competitive Analysis
- 18.1. Global Market Share Analysis 2024
- 18.2. Company Profiles
- 18.2.1 Perkins Engines Company Limited
- 18.2.1.1. Overview
- 18.2.1.2. Products
- 18.2.1.3. SWOT Analysis
- 18.2.1.4. Recent Developments
- 18.2.1.5. Financials (Based on Availability)
- 18.2.2 Atlas Copco AB*List Not Exhaustive 6 4 Market Shar
- 18.2.2.1. Overview
- 18.2.2.2. Products
- 18.2.2.3. SWOT Analysis
- 18.2.2.4. Recent Developments
- 18.2.2.5. Financials (Based on Availability)
- 18.2.3 Caterpillar Inc
- 18.2.3.1. Overview
- 18.2.3.2. Products
- 18.2.3.3. SWOT Analysis
- 18.2.3.4. Recent Developments
- 18.2.3.5. Financials (Based on Availability)
- 18.2.4 Kirloskar Oil Engines Limited
- 18.2.4.1. Overview
- 18.2.4.2. Products
- 18.2.4.3. SWOT Analysis
- 18.2.4.4. Recent Developments
- 18.2.4.5. Financials (Based on Availability)
- 18.2.5 Honda Siel Power Products Limited
- 18.2.5.1. Overview
- 18.2.5.2. Products
- 18.2.5.3. SWOT Analysis
- 18.2.5.4. Recent Developments
- 18.2.5.5. Financials (Based on Availability)
- 18.2.6 Cummins Inc
- 18.2.6.1. Overview
- 18.2.6.2. Products
- 18.2.6.3. SWOT Analysis
- 18.2.6.4. Recent Developments
- 18.2.6.5. Financials (Based on Availability)
- 18.2.7 Yanmar Holdings Co Ltd
- 18.2.7.1. Overview
- 18.2.7.2. Products
- 18.2.7.3. SWOT Analysis
- 18.2.7.4. Recent Developments
- 18.2.7.5. Financials (Based on Availability)
- 18.2.8 Mitsubishi Heavy Industries Ltd
- 18.2.8.1. Overview
- 18.2.8.2. Products
- 18.2.8.3. SWOT Analysis
- 18.2.8.4. Recent Developments
- 18.2.8.5. Financials (Based on Availability)
- 18.2.9 Kohler Co.
- 18.2.9.1. Overview
- 18.2.9.2. Products
- 18.2.9.3. SWOT Analysis
- 18.2.9.4. Recent Developments
- 18.2.9.5. Financials (Based on Availability)
- 18.2.10 MTU Onsite Energy (a Rolls-Royce Power Systems company)
- 18.2.10.1. Overview
- 18.2.10.2. Products
- 18.2.10.3. SWOT Analysis
- 18.2.10.4. Recent Developments
- 18.2.10.5. Financials (Based on Availability)
- 18.2.1 Perkins Engines Company Limited
List of Figures
- Figure 1: Global MEA Diesel Genset Industry Revenue Breakdown (Million, %) by Region 2024 & 2032
- Figure 2: Global MEA Diesel Genset Industry Volume Breakdown (Gigawatt, %) by Region 2024 & 2032
- Figure 3: North America MEA Diesel Genset Industry Revenue (Million), by Country 2024 & 2032
- Figure 4: North America MEA Diesel Genset Industry Volume (Gigawatt), by Country 2024 & 2032
- Figure 5: North America MEA Diesel Genset Industry Revenue Share (%), by Country 2024 & 2032
- Figure 6: North America MEA Diesel Genset Industry Volume Share (%), by Country 2024 & 2032
- Figure 7: Europe MEA Diesel Genset Industry Revenue (Million), by Country 2024 & 2032
- Figure 8: Europe MEA Diesel Genset Industry Volume (Gigawatt), by Country 2024 & 2032
- Figure 9: Europe MEA Diesel Genset Industry Revenue Share (%), by Country 2024 & 2032
- Figure 10: Europe MEA Diesel Genset Industry Volume Share (%), by Country 2024 & 2032
- Figure 11: Asia Pacific MEA Diesel Genset Industry Revenue (Million), by Country 2024 & 2032
- Figure 12: Asia Pacific MEA Diesel Genset Industry Volume (Gigawatt), by Country 2024 & 2032
- Figure 13: Asia Pacific MEA Diesel Genset Industry Revenue Share (%), by Country 2024 & 2032
- Figure 14: Asia Pacific MEA Diesel Genset Industry Volume Share (%), by Country 2024 & 2032
- Figure 15: South America MEA Diesel Genset Industry Revenue (Million), by Country 2024 & 2032
- Figure 16: South America MEA Diesel Genset Industry Volume (Gigawatt), by Country 2024 & 2032
- Figure 17: South America MEA Diesel Genset Industry Revenue Share (%), by Country 2024 & 2032
- Figure 18: South America MEA Diesel Genset Industry Volume Share (%), by Country 2024 & 2032
- Figure 19: North America MEA Diesel Genset Industry Revenue (Million), by Country 2024 & 2032
- Figure 20: North America MEA Diesel Genset Industry Volume (Gigawatt), by Country 2024 & 2032
- Figure 21: North America MEA Diesel Genset Industry Revenue Share (%), by Country 2024 & 2032
- Figure 22: North America MEA Diesel Genset Industry Volume Share (%), by Country 2024 & 2032
- Figure 23: MEA MEA Diesel Genset Industry Revenue (Million), by Country 2024 & 2032
- Figure 24: MEA MEA Diesel Genset Industry Volume (Gigawatt), by Country 2024 & 2032
- Figure 25: MEA MEA Diesel Genset Industry Revenue Share (%), by Country 2024 & 2032
- Figure 26: MEA MEA Diesel Genset Industry Volume Share (%), by Country 2024 & 2032
- Figure 27: Nigeria MEA Diesel Genset Industry Revenue (Million), by Ratings 2024 & 2032
- Figure 28: Nigeria MEA Diesel Genset Industry Volume (Gigawatt), by Ratings 2024 & 2032
- Figure 29: Nigeria MEA Diesel Genset Industry Revenue Share (%), by Ratings 2024 & 2032
- Figure 30: Nigeria MEA Diesel Genset Industry Volume Share (%), by Ratings 2024 & 2032
- Figure 31: Nigeria MEA Diesel Genset Industry Revenue (Million), by Application 2024 & 2032
- Figure 32: Nigeria MEA Diesel Genset Industry Volume (Gigawatt), by Application 2024 & 2032
- Figure 33: Nigeria MEA Diesel Genset Industry Revenue Share (%), by Application 2024 & 2032
- Figure 34: Nigeria MEA Diesel Genset Industry Volume Share (%), by Application 2024 & 2032
- Figure 35: Nigeria MEA Diesel Genset Industry Revenue (Million), by Country 2024 & 2032
- Figure 36: Nigeria MEA Diesel Genset Industry Volume (Gigawatt), by Country 2024 & 2032
- Figure 37: Nigeria MEA Diesel Genset Industry Revenue Share (%), by Country 2024 & 2032
- Figure 38: Nigeria MEA Diesel Genset Industry Volume Share (%), by Country 2024 & 2032
- Figure 39: Iraq MEA Diesel Genset Industry Revenue (Million), by Ratings 2024 & 2032
- Figure 40: Iraq MEA Diesel Genset Industry Volume (Gigawatt), by Ratings 2024 & 2032
- Figure 41: Iraq MEA Diesel Genset Industry Revenue Share (%), by Ratings 2024 & 2032
- Figure 42: Iraq MEA Diesel Genset Industry Volume Share (%), by Ratings 2024 & 2032
- Figure 43: Iraq MEA Diesel Genset Industry Revenue (Million), by Application 2024 & 2032
- Figure 44: Iraq MEA Diesel Genset Industry Volume (Gigawatt), by Application 2024 & 2032
- Figure 45: Iraq MEA Diesel Genset Industry Revenue Share (%), by Application 2024 & 2032
- Figure 46: Iraq MEA Diesel Genset Industry Volume Share (%), by Application 2024 & 2032
- Figure 47: Iraq MEA Diesel Genset Industry Revenue (Million), by Country 2024 & 2032
- Figure 48: Iraq MEA Diesel Genset Industry Volume (Gigawatt), by Country 2024 & 2032
- Figure 49: Iraq MEA Diesel Genset Industry Revenue Share (%), by Country 2024 & 2032
- Figure 50: Iraq MEA Diesel Genset Industry Volume Share (%), by Country 2024 & 2032
- Figure 51: Saudi Arabia MEA Diesel Genset Industry Revenue (Million), by Ratings 2024 & 2032
- Figure 52: Saudi Arabia MEA Diesel Genset Industry Volume (Gigawatt), by Ratings 2024 & 2032
- Figure 53: Saudi Arabia MEA Diesel Genset Industry Revenue Share (%), by Ratings 2024 & 2032
- Figure 54: Saudi Arabia MEA Diesel Genset Industry Volume Share (%), by Ratings 2024 & 2032
- Figure 55: Saudi Arabia MEA Diesel Genset Industry Revenue (Million), by Application 2024 & 2032
- Figure 56: Saudi Arabia MEA Diesel Genset Industry Volume (Gigawatt), by Application 2024 & 2032
- Figure 57: Saudi Arabia MEA Diesel Genset Industry Revenue Share (%), by Application 2024 & 2032
- Figure 58: Saudi Arabia MEA Diesel Genset Industry Volume Share (%), by Application 2024 & 2032
- Figure 59: Saudi Arabia MEA Diesel Genset Industry Revenue (Million), by Country 2024 & 2032
- Figure 60: Saudi Arabia MEA Diesel Genset Industry Volume (Gigawatt), by Country 2024 & 2032
- Figure 61: Saudi Arabia MEA Diesel Genset Industry Revenue Share (%), by Country 2024 & 2032
- Figure 62: Saudi Arabia MEA Diesel Genset Industry Volume Share (%), by Country 2024 & 2032
- Figure 63: United Arab Emirates MEA Diesel Genset Industry Revenue (Million), by Ratings 2024 & 2032
- Figure 64: United Arab Emirates MEA Diesel Genset Industry Volume (Gigawatt), by Ratings 2024 & 2032
- Figure 65: United Arab Emirates MEA Diesel Genset Industry Revenue Share (%), by Ratings 2024 & 2032
- Figure 66: United Arab Emirates MEA Diesel Genset Industry Volume Share (%), by Ratings 2024 & 2032
- Figure 67: United Arab Emirates MEA Diesel Genset Industry Revenue (Million), by Application 2024 & 2032
- Figure 68: United Arab Emirates MEA Diesel Genset Industry Volume (Gigawatt), by Application 2024 & 2032
- Figure 69: United Arab Emirates MEA Diesel Genset Industry Revenue Share (%), by Application 2024 & 2032
- Figure 70: United Arab Emirates MEA Diesel Genset Industry Volume Share (%), by Application 2024 & 2032
- Figure 71: United Arab Emirates MEA Diesel Genset Industry Revenue (Million), by Country 2024 & 2032
- Figure 72: United Arab Emirates MEA Diesel Genset Industry Volume (Gigawatt), by Country 2024 & 2032
- Figure 73: United Arab Emirates MEA Diesel Genset Industry Revenue Share (%), by Country 2024 & 2032
- Figure 74: United Arab Emirates MEA Diesel Genset Industry Volume Share (%), by Country 2024 & 2032
- Figure 75: Qatar MEA Diesel Genset Industry Revenue (Million), by Ratings 2024 & 2032
- Figure 76: Qatar MEA Diesel Genset Industry Volume (Gigawatt), by Ratings 2024 & 2032
- Figure 77: Qatar MEA Diesel Genset Industry Revenue Share (%), by Ratings 2024 & 2032
- Figure 78: Qatar MEA Diesel Genset Industry Volume Share (%), by Ratings 2024 & 2032
- Figure 79: Qatar MEA Diesel Genset Industry Revenue (Million), by Application 2024 & 2032
- Figure 80: Qatar MEA Diesel Genset Industry Volume (Gigawatt), by Application 2024 & 2032
- Figure 81: Qatar MEA Diesel Genset Industry Revenue Share (%), by Application 2024 & 2032
- Figure 82: Qatar MEA Diesel Genset Industry Volume Share (%), by Application 2024 & 2032
- Figure 83: Qatar MEA Diesel Genset Industry Revenue (Million), by Country 2024 & 2032
- Figure 84: Qatar MEA Diesel Genset Industry Volume (Gigawatt), by Country 2024 & 2032
- Figure 85: Qatar MEA Diesel Genset Industry Revenue Share (%), by Country 2024 & 2032
- Figure 86: Qatar MEA Diesel Genset Industry Volume Share (%), by Country 2024 & 2032
- Figure 87: Rest of Middle East and Africa MEA Diesel Genset Industry Revenue (Million), by Ratings 2024 & 2032
- Figure 88: Rest of Middle East and Africa MEA Diesel Genset Industry Volume (Gigawatt), by Ratings 2024 & 2032
- Figure 89: Rest of Middle East and Africa MEA Diesel Genset Industry Revenue Share (%), by Ratings 2024 & 2032
- Figure 90: Rest of Middle East and Africa MEA Diesel Genset Industry Volume Share (%), by Ratings 2024 & 2032
- Figure 91: Rest of Middle East and Africa MEA Diesel Genset Industry Revenue (Million), by Application 2024 & 2032
- Figure 92: Rest of Middle East and Africa MEA Diesel Genset Industry Volume (Gigawatt), by Application 2024 & 2032
- Figure 93: Rest of Middle East and Africa MEA Diesel Genset Industry Revenue Share (%), by Application 2024 & 2032
- Figure 94: Rest of Middle East and Africa MEA Diesel Genset Industry Volume Share (%), by Application 2024 & 2032
- Figure 95: Rest of Middle East and Africa MEA Diesel Genset Industry Revenue (Million), by Country 2024 & 2032
- Figure 96: Rest of Middle East and Africa MEA Diesel Genset Industry Volume (Gigawatt), by Country 2024 & 2032
- Figure 97: Rest of Middle East and Africa MEA Diesel Genset Industry Revenue Share (%), by Country 2024 & 2032
- Figure 98: Rest of Middle East and Africa MEA Diesel Genset Industry Volume Share (%), by Country 2024 & 2032
List of Tables
- Table 1: Global MEA Diesel Genset Industry Revenue Million Forecast, by Region 2019 & 2032
- Table 2: Global MEA Diesel Genset Industry Volume Gigawatt Forecast, by Region 2019 & 2032
- Table 3: Global MEA Diesel Genset Industry Revenue Million Forecast, by Ratings 2019 & 2032
- Table 4: Global MEA Diesel Genset Industry Volume Gigawatt Forecast, by Ratings 2019 & 2032
- Table 5: Global MEA Diesel Genset Industry Revenue Million Forecast, by Application 2019 & 2032
- Table 6: Global MEA Diesel Genset Industry Volume Gigawatt Forecast, by Application 2019 & 2032
- Table 7: Global MEA Diesel Genset Industry Revenue Million Forecast, by Region 2019 & 2032
- Table 8: Global MEA Diesel Genset Industry Volume Gigawatt Forecast, by Region 2019 & 2032
- Table 9: Global MEA Diesel Genset Industry Revenue Million Forecast, by Country 2019 & 2032
- Table 10: Global MEA Diesel Genset Industry Volume Gigawatt Forecast, by Country 2019 & 2032
- Table 11: United States MEA Diesel Genset Industry Revenue (Million) Forecast, by Application 2019 & 2032
- Table 12: United States MEA Diesel Genset Industry Volume (Gigawatt) Forecast, by Application 2019 & 2032
- Table 13: Canada MEA Diesel Genset Industry Revenue (Million) Forecast, by Application 2019 & 2032
- Table 14: Canada MEA Diesel Genset Industry Volume (Gigawatt) Forecast, by Application 2019 & 2032
- Table 15: Mexico MEA Diesel Genset Industry Revenue (Million) Forecast, by Application 2019 & 2032
- Table 16: Mexico MEA Diesel Genset Industry Volume (Gigawatt) Forecast, by Application 2019 & 2032
- Table 17: Global MEA Diesel Genset Industry Revenue Million Forecast, by Country 2019 & 2032
- Table 18: Global MEA Diesel Genset Industry Volume Gigawatt Forecast, by Country 2019 & 2032
- Table 19: Germany MEA Diesel Genset Industry Revenue (Million) Forecast, by Application 2019 & 2032
- Table 20: Germany MEA Diesel Genset Industry Volume (Gigawatt) Forecast, by Application 2019 & 2032
- Table 21: United Kingdom MEA Diesel Genset Industry Revenue (Million) Forecast, by Application 2019 & 2032
- Table 22: United Kingdom MEA Diesel Genset Industry Volume (Gigawatt) Forecast, by Application 2019 & 2032
- Table 23: France MEA Diesel Genset Industry Revenue (Million) Forecast, by Application 2019 & 2032
- Table 24: France MEA Diesel Genset Industry Volume (Gigawatt) Forecast, by Application 2019 & 2032
- Table 25: Spain MEA Diesel Genset Industry Revenue (Million) Forecast, by Application 2019 & 2032
- Table 26: Spain MEA Diesel Genset Industry Volume (Gigawatt) Forecast, by Application 2019 & 2032
- Table 27: Italy MEA Diesel Genset Industry Revenue (Million) Forecast, by Application 2019 & 2032
- Table 28: Italy MEA Diesel Genset Industry Volume (Gigawatt) Forecast, by Application 2019 & 2032
- Table 29: Spain MEA Diesel Genset Industry Revenue (Million) Forecast, by Application 2019 & 2032
- Table 30: Spain MEA Diesel Genset Industry Volume (Gigawatt) Forecast, by Application 2019 & 2032
- Table 31: Belgium MEA Diesel Genset Industry Revenue (Million) Forecast, by Application 2019 & 2032
- Table 32: Belgium MEA Diesel Genset Industry Volume (Gigawatt) Forecast, by Application 2019 & 2032
- Table 33: Netherland MEA Diesel Genset Industry Revenue (Million) Forecast, by Application 2019 & 2032
- Table 34: Netherland MEA Diesel Genset Industry Volume (Gigawatt) Forecast, by Application 2019 & 2032
- Table 35: Nordics MEA Diesel Genset Industry Revenue (Million) Forecast, by Application 2019 & 2032
- Table 36: Nordics MEA Diesel Genset Industry Volume (Gigawatt) Forecast, by Application 2019 & 2032
- Table 37: Rest of Europe MEA Diesel Genset Industry Revenue (Million) Forecast, by Application 2019 & 2032
- Table 38: Rest of Europe MEA Diesel Genset Industry Volume (Gigawatt) Forecast, by Application 2019 & 2032
- Table 39: Global MEA Diesel Genset Industry Revenue Million Forecast, by Country 2019 & 2032
- Table 40: Global MEA Diesel Genset Industry Volume Gigawatt Forecast, by Country 2019 & 2032
- Table 41: China MEA Diesel Genset Industry Revenue (Million) Forecast, by Application 2019 & 2032
- Table 42: China MEA Diesel Genset Industry Volume (Gigawatt) Forecast, by Application 2019 & 2032
- Table 43: Japan MEA Diesel Genset Industry Revenue (Million) Forecast, by Application 2019 & 2032
- Table 44: Japan MEA Diesel Genset Industry Volume (Gigawatt) Forecast, by Application 2019 & 2032
- Table 45: India MEA Diesel Genset Industry Revenue (Million) Forecast, by Application 2019 & 2032
- Table 46: India MEA Diesel Genset Industry Volume (Gigawatt) Forecast, by Application 2019 & 2032
- Table 47: South Korea MEA Diesel Genset Industry Revenue (Million) Forecast, by Application 2019 & 2032
- Table 48: South Korea MEA Diesel Genset Industry Volume (Gigawatt) Forecast, by Application 2019 & 2032
- Table 49: Southeast Asia MEA Diesel Genset Industry Revenue (Million) Forecast, by Application 2019 & 2032
- Table 50: Southeast Asia MEA Diesel Genset Industry Volume (Gigawatt) Forecast, by Application 2019 & 2032
- Table 51: Australia MEA Diesel Genset Industry Revenue (Million) Forecast, by Application 2019 & 2032
- Table 52: Australia MEA Diesel Genset Industry Volume (Gigawatt) Forecast, by Application 2019 & 2032
- Table 53: Indonesia MEA Diesel Genset Industry Revenue (Million) Forecast, by Application 2019 & 2032
- Table 54: Indonesia MEA Diesel Genset Industry Volume (Gigawatt) Forecast, by Application 2019 & 2032
- Table 55: Phillipes MEA Diesel Genset Industry Revenue (Million) Forecast, by Application 2019 & 2032
- Table 56: Phillipes MEA Diesel Genset Industry Volume (Gigawatt) Forecast, by Application 2019 & 2032
- Table 57: Singapore MEA Diesel Genset Industry Revenue (Million) Forecast, by Application 2019 & 2032
- Table 58: Singapore MEA Diesel Genset Industry Volume (Gigawatt) Forecast, by Application 2019 & 2032
- Table 59: Thailandc MEA Diesel Genset Industry Revenue (Million) Forecast, by Application 2019 & 2032
- Table 60: Thailandc MEA Diesel Genset Industry Volume (Gigawatt) Forecast, by Application 2019 & 2032
- Table 61: Rest of Asia Pacific MEA Diesel Genset Industry Revenue (Million) Forecast, by Application 2019 & 2032
- Table 62: Rest of Asia Pacific MEA Diesel Genset Industry Volume (Gigawatt) Forecast, by Application 2019 & 2032
- Table 63: Global MEA Diesel Genset Industry Revenue Million Forecast, by Country 2019 & 2032
- Table 64: Global MEA Diesel Genset Industry Volume Gigawatt Forecast, by Country 2019 & 2032
- Table 65: Brazil MEA Diesel Genset Industry Revenue (Million) Forecast, by Application 2019 & 2032
- Table 66: Brazil MEA Diesel Genset Industry Volume (Gigawatt) Forecast, by Application 2019 & 2032
- Table 67: Argentina MEA Diesel Genset Industry Revenue (Million) Forecast, by Application 2019 & 2032
- Table 68: Argentina MEA Diesel Genset Industry Volume (Gigawatt) Forecast, by Application 2019 & 2032
- Table 69: Peru MEA Diesel Genset Industry Revenue (Million) Forecast, by Application 2019 & 2032
- Table 70: Peru MEA Diesel Genset Industry Volume (Gigawatt) Forecast, by Application 2019 & 2032
- Table 71: Chile MEA Diesel Genset Industry Revenue (Million) Forecast, by Application 2019 & 2032
- Table 72: Chile MEA Diesel Genset Industry Volume (Gigawatt) Forecast, by Application 2019 & 2032
- Table 73: Colombia MEA Diesel Genset Industry Revenue (Million) Forecast, by Application 2019 & 2032
- Table 74: Colombia MEA Diesel Genset Industry Volume (Gigawatt) Forecast, by Application 2019 & 2032
- Table 75: Ecuador MEA Diesel Genset Industry Revenue (Million) Forecast, by Application 2019 & 2032
- Table 76: Ecuador MEA Diesel Genset Industry Volume (Gigawatt) Forecast, by Application 2019 & 2032
- Table 77: Venezuela MEA Diesel Genset Industry Revenue (Million) Forecast, by Application 2019 & 2032
- Table 78: Venezuela MEA Diesel Genset Industry Volume (Gigawatt) Forecast, by Application 2019 & 2032
- Table 79: Rest of South America MEA Diesel Genset Industry Revenue (Million) Forecast, by Application 2019 & 2032
- Table 80: Rest of South America MEA Diesel Genset Industry Volume (Gigawatt) Forecast, by Application 2019 & 2032
- Table 81: Global MEA Diesel Genset Industry Revenue Million Forecast, by Country 2019 & 2032
- Table 82: Global MEA Diesel Genset Industry Volume Gigawatt Forecast, by Country 2019 & 2032
- Table 83: United States MEA Diesel Genset Industry Revenue (Million) Forecast, by Application 2019 & 2032
- Table 84: United States MEA Diesel Genset Industry Volume (Gigawatt) Forecast, by Application 2019 & 2032
- Table 85: Canada MEA Diesel Genset Industry Revenue (Million) Forecast, by Application 2019 & 2032
- Table 86: Canada MEA Diesel Genset Industry Volume (Gigawatt) Forecast, by Application 2019 & 2032
- Table 87: Mexico MEA Diesel Genset Industry Revenue (Million) Forecast, by Application 2019 & 2032
- Table 88: Mexico MEA Diesel Genset Industry Volume (Gigawatt) Forecast, by Application 2019 & 2032
- Table 89: Global MEA Diesel Genset Industry Revenue Million Forecast, by Country 2019 & 2032
- Table 90: Global MEA Diesel Genset Industry Volume Gigawatt Forecast, by Country 2019 & 2032
- Table 91: United Arab Emirates MEA Diesel Genset Industry Revenue (Million) Forecast, by Application 2019 & 2032
- Table 92: United Arab Emirates MEA Diesel Genset Industry Volume (Gigawatt) Forecast, by Application 2019 & 2032
- Table 93: Saudi Arabia MEA Diesel Genset Industry Revenue (Million) Forecast, by Application 2019 & 2032
- Table 94: Saudi Arabia MEA Diesel Genset Industry Volume (Gigawatt) Forecast, by Application 2019 & 2032
- Table 95: South Africa MEA Diesel Genset Industry Revenue (Million) Forecast, by Application 2019 & 2032
- Table 96: South Africa MEA Diesel Genset Industry Volume (Gigawatt) Forecast, by Application 2019 & 2032
- Table 97: Rest of Middle East and Africa MEA Diesel Genset Industry Revenue (Million) Forecast, by Application 2019 & 2032
- Table 98: Rest of Middle East and Africa MEA Diesel Genset Industry Volume (Gigawatt) Forecast, by Application 2019 & 2032
- Table 99: Global MEA Diesel Genset Industry Revenue Million Forecast, by Ratings 2019 & 2032
- Table 100: Global MEA Diesel Genset Industry Volume Gigawatt Forecast, by Ratings 2019 & 2032
- Table 101: Global MEA Diesel Genset Industry Revenue Million Forecast, by Application 2019 & 2032
- Table 102: Global MEA Diesel Genset Industry Volume Gigawatt Forecast, by Application 2019 & 2032
- Table 103: Global MEA Diesel Genset Industry Revenue Million Forecast, by Country 2019 & 2032
- Table 104: Global MEA Diesel Genset Industry Volume Gigawatt Forecast, by Country 2019 & 2032
- Table 105: Global MEA Diesel Genset Industry Revenue Million Forecast, by Ratings 2019 & 2032
- Table 106: Global MEA Diesel Genset Industry Volume Gigawatt Forecast, by Ratings 2019 & 2032
- Table 107: Global MEA Diesel Genset Industry Revenue Million Forecast, by Application 2019 & 2032
- Table 108: Global MEA Diesel Genset Industry Volume Gigawatt Forecast, by Application 2019 & 2032
- Table 109: Global MEA Diesel Genset Industry Revenue Million Forecast, by Country 2019 & 2032
- Table 110: Global MEA Diesel Genset Industry Volume Gigawatt Forecast, by Country 2019 & 2032
- Table 111: Global MEA Diesel Genset Industry Revenue Million Forecast, by Ratings 2019 & 2032
- Table 112: Global MEA Diesel Genset Industry Volume Gigawatt Forecast, by Ratings 2019 & 2032
- Table 113: Global MEA Diesel Genset Industry Revenue Million Forecast, by Application 2019 & 2032
- Table 114: Global MEA Diesel Genset Industry Volume Gigawatt Forecast, by Application 2019 & 2032
- Table 115: Global MEA Diesel Genset Industry Revenue Million Forecast, by Country 2019 & 2032
- Table 116: Global MEA Diesel Genset Industry Volume Gigawatt Forecast, by Country 2019 & 2032
- Table 117: Global MEA Diesel Genset Industry Revenue Million Forecast, by Ratings 2019 & 2032
- Table 118: Global MEA Diesel Genset Industry Volume Gigawatt Forecast, by Ratings 2019 & 2032
- Table 119: Global MEA Diesel Genset Industry Revenue Million Forecast, by Application 2019 & 2032
- Table 120: Global MEA Diesel Genset Industry Volume Gigawatt Forecast, by Application 2019 & 2032
- Table 121: Global MEA Diesel Genset Industry Revenue Million Forecast, by Country 2019 & 2032
- Table 122: Global MEA Diesel Genset Industry Volume Gigawatt Forecast, by Country 2019 & 2032
- Table 123: Global MEA Diesel Genset Industry Revenue Million Forecast, by Ratings 2019 & 2032
- Table 124: Global MEA Diesel Genset Industry Volume Gigawatt Forecast, by Ratings 2019 & 2032
- Table 125: Global MEA Diesel Genset Industry Revenue Million Forecast, by Application 2019 & 2032
- Table 126: Global MEA Diesel Genset Industry Volume Gigawatt Forecast, by Application 2019 & 2032
- Table 127: Global MEA Diesel Genset Industry Revenue Million Forecast, by Country 2019 & 2032
- Table 128: Global MEA Diesel Genset Industry Volume Gigawatt Forecast, by Country 2019 & 2032
- Table 129: Global MEA Diesel Genset Industry Revenue Million Forecast, by Ratings 2019 & 2032
- Table 130: Global MEA Diesel Genset Industry Volume Gigawatt Forecast, by Ratings 2019 & 2032
- Table 131: Global MEA Diesel Genset Industry Revenue Million Forecast, by Application 2019 & 2032
- Table 132: Global MEA Diesel Genset Industry Volume Gigawatt Forecast, by Application 2019 & 2032
- Table 133: Global MEA Diesel Genset Industry Revenue Million Forecast, by Country 2019 & 2032
- Table 134: Global MEA Diesel Genset Industry Volume Gigawatt Forecast, by Country 2019 & 2032
Frequently Asked Questions
1. What is the projected Compound Annual Growth Rate (CAGR) of the MEA Diesel Genset Industry?
The projected CAGR is approximately > 4.10%.
2. Which companies are prominent players in the MEA Diesel Genset Industry?
Key companies in the market include Perkins Engines Company Limited, Atlas Copco AB*List Not Exhaustive 6 4 Market Shar, Caterpillar Inc, Kirloskar Oil Engines Limited, Honda Siel Power Products Limited, Cummins Inc, Yanmar Holdings Co Ltd, Mitsubishi Heavy Industries Ltd, Kohler Co. , MTU Onsite Energy (a Rolls-Royce Power Systems company).
3. What are the main segments of the MEA Diesel Genset Industry?
The market segments include Ratings, Application.
4. Can you provide details about the market size?
The market size is estimated to be USD 2.80 Million as of 2022.
5. What are some drivers contributing to market growth?
4.; Unreliable Power Supply4.; Construction and Infrastructure Projects.
6. What are the notable trends driving market growth?
Backup Generator Segment to Dominate the Market.
7. Are there any restraints impacting market growth?
4.; Environmental Concerns.
8. Can you provide examples of recent developments in the market?
Dec 2023: Nigeria received a USD 750 million loan from the World Bank for the DARES project. The DARES project aims to provide around 17.5 million Nigerians with access to electricity and eliminate noisy and polluting diesel generators with clean energy.
9. What pricing options are available for accessing the report?
Pricing options include single-user, multi-user, and enterprise licenses priced at USD 4750, USD 5250, and USD 8750 respectively.
10. Is the market size provided in terms of value or volume?
The market size is provided in terms of value, measured in Million and volume, measured in Gigawatt.
11. Are there any specific market keywords associated with the report?
Yes, the market keyword associated with the report is "MEA Diesel Genset Industry," which aids in identifying and referencing the specific market segment covered.
12. How do I determine which pricing option suits my needs best?
The pricing options vary based on user requirements and access needs. Individual users may opt for single-user licenses, while businesses requiring broader access may choose multi-user or enterprise licenses for cost-effective access to the report.
13. Are there any additional resources or data provided in the MEA Diesel Genset Industry report?
While the report offers comprehensive insights, it's advisable to review the specific contents or supplementary materials provided to ascertain if additional resources or data are available.
14. How can I stay updated on further developments or reports in the MEA Diesel Genset Industry?
To stay informed about further developments, trends, and reports in the MEA Diesel Genset Industry, consider subscribing to industry newsletters, following relevant companies and organizations, or regularly checking reputable industry news sources and publications.
Methodology
Step 1 - Identification of Relevant Samples Size from Population Database


Step 2 - Approaches for Defining Global Market Size (Value, Volume* & Price*)

Note*: In applicable scenarios
Step 3 - Data Sources
Primary Research
- Web Analytics
- Survey Reports
- Research Institute
- Latest Research Reports
- Opinion Leaders
Secondary Research
- Annual Reports
- White Paper
- Latest Press Release
- Industry Association
- Paid Database
- Investor Presentations

Step 4 - Data Triangulation
Involves using different sources of information in order to increase the validity of a study
These sources are likely to be stakeholders in a program - participants, other researchers, program staff, other community members, and so on.
Then we put all data in single framework & apply various statistical tools to find out the dynamic on the market.
During the analysis stage, feedback from the stakeholder groups would be compared to determine areas of agreement as well as areas of divergence


