
Key Insights
The MEA Demand Response Management Systems (DRMS) market is experiencing robust growth, driven by increasing electricity demand, rising energy costs, and a growing focus on grid stability and renewable energy integration. The region's diverse energy landscape, coupled with government initiatives promoting energy efficiency and smart grid technologies, is fueling the adoption of DRMS solutions. Specifically, countries like the UAE and Saudi Arabia, with their ambitious renewable energy targets and advanced infrastructure development, are key contributors to this growth. The market is segmented into Conventional and Automated Demand Response systems, with the latter witnessing faster growth due to its advanced capabilities in optimizing energy consumption and enhancing grid resilience. While the initial investment in DRMS can be substantial, the long-term cost savings and enhanced grid reliability make it an attractive proposition for utilities and large consumers. Furthermore, technological advancements are making DRMS solutions more accessible and cost-effective, further driving market expansion. Challenges remain, such as the need for robust cybersecurity measures and overcoming regulatory hurdles in some countries. However, the overall outlook for the MEA DRMS market is extremely positive, with a projected CAGR exceeding 10% throughout the forecast period (2025-2033).
The competitive landscape is characterized by a mix of global technology providers and regional players. International companies such as ABB, Siemens, and Schneider Electric are leveraging their expertise and established presence to secure market share. Local players are also emerging, capitalizing on regional knowledge and customized solutions. Future growth will likely be driven by the increasing adoption of smart meters, advanced analytics, and the integration of DRMS with other smart grid technologies. The development of tailored DRMS solutions that address the specific needs of various industry sectors (e.g., industrial, commercial, residential) will also play a significant role in shaping the market's trajectory. The focus on enhancing grid reliability and managing the integration of intermittent renewable energy sources will be pivotal in driving future investments in DRMS across the MEA region.
MEA Demand Response Management Systems Industry Market Report: 2019-2033
This comprehensive report provides an in-depth analysis of the Middle East and Africa (MEA) Demand Response Management Systems market, offering invaluable insights for industry professionals, investors, and strategic planners. Covering the period from 2019 to 2033, with a focus on 2025, this report dissects market dynamics, growth trends, key players, and emerging opportunities within the parent market of Energy Management Systems and the child market of Demand Response Management. The report projects a market size of xx Million units by 2033.
MEA Demand Response Management Systems Industry Market Dynamics & Structure
This section analyzes the MEA Demand Response Management Systems market structure, examining market concentration, technological advancements, regulatory landscapes, competitive dynamics, and end-user demographics. We explore the impact of mergers and acquisitions (M&A) activities, providing quantitative and qualitative assessments.
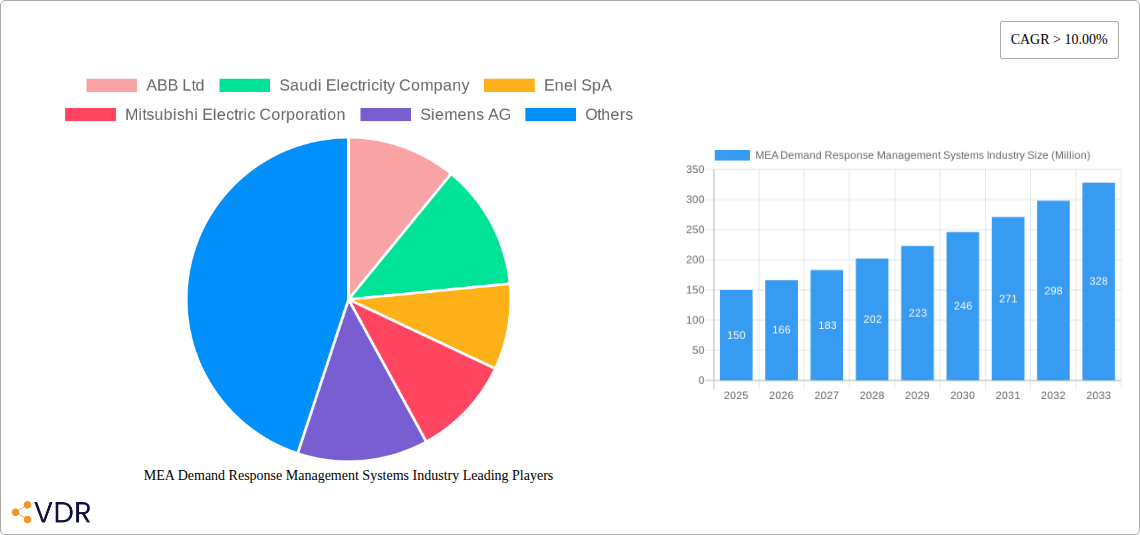
- Market Concentration: The MEA demand response market is moderately concentrated, with key players like ABB Ltd, Siemens AG, and Schneider Electric holding significant market share. We estimate the top 5 players account for approximately xx% of the market in 2025.
- Technological Innovation: The market is driven by advancements in IoT, AI, and cloud computing, enabling the development of sophisticated automated demand response systems. However, integration challenges and high initial investment costs present barriers to innovation.
- Regulatory Framework: Government initiatives promoting energy efficiency and renewable energy integration are creating a favorable regulatory environment. Specific examples include the ETIP 2.0 program in Abu Dhabi and the NWEDMP in the UAE. However, inconsistent regulatory frameworks across different MEA countries pose a challenge.
- Competitive Landscape: Competition is intensifying with both established players and new entrants. The market is witnessing strategic partnerships and alliances to expand market reach and offer comprehensive solutions.
- M&A Activity: We project approximately xx M&A deals in the MEA Demand Response Management Systems sector between 2025 and 2033, driven by the need for scale and technological capabilities.
MEA Demand Response Management Systems Industry Growth Trends & Insights
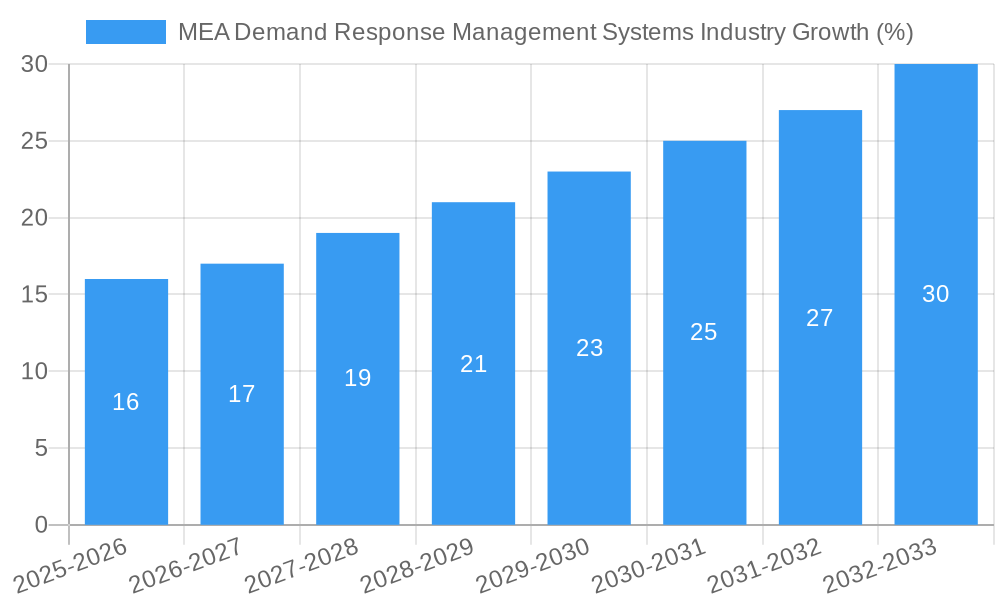
This section analyzes historical and projected market size, adoption rates, technological disruptions, and evolving consumer behavior using data analysis and forecasting methodologies. The report projects a Compound Annual Growth Rate (CAGR) of xx% from 2025 to 2033, driven by increasing energy costs, government regulations, and growing awareness of sustainability. Market penetration is expected to increase from xx% in 2025 to xx% by 2033. The transition from conventional to automated demand response systems is a significant trend, shaping market growth and technological advancements.
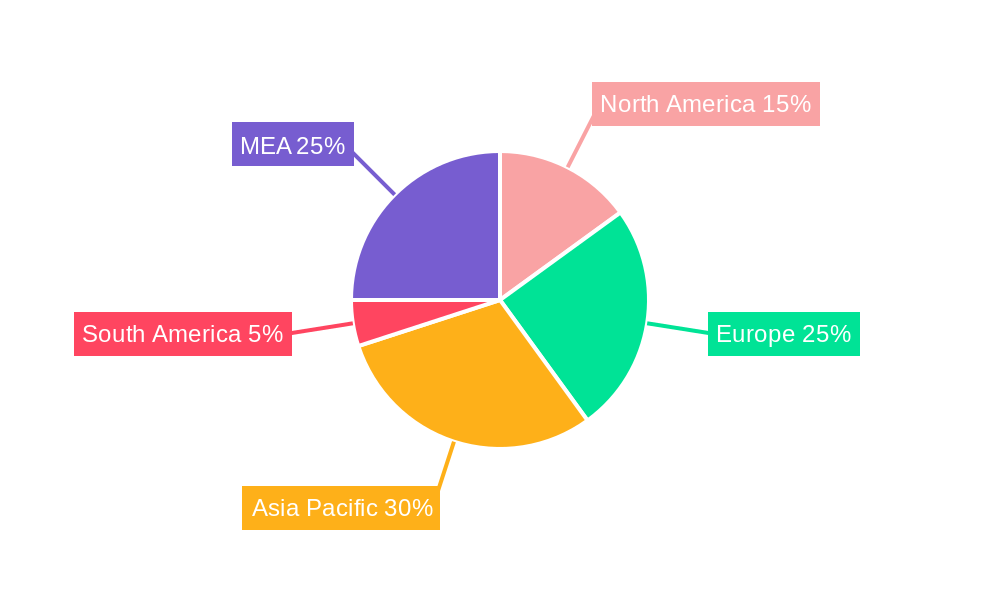
Dominant Regions, Countries, or Segments in MEA Demand Response Management Systems Industry
This section identifies the leading regions, countries, and segments (Conventional and Automated Demand Response) driving market growth. The UAE and Saudi Arabia are projected to be the dominant markets due to their substantial investments in infrastructure development and energy efficiency initiatives.
- UAE Dominance: Driven by the NWEDMP and robust government support for smart city projects.
- Saudi Arabia's Growth: Fueled by Vision 2030's focus on diversifying the economy and improving energy efficiency.
- Automated Demand Response: This segment is projected to exhibit higher growth than conventional demand response, driven by the adoption of advanced technologies and improved cost-effectiveness.
The report provides detailed market share and growth potential for each region and segment.
MEA Demand Response Management Systems Industry Product Landscape
The MEA Demand Response Management Systems market offers a variety of solutions, ranging from basic conventional systems to sophisticated automated platforms incorporating AI and machine learning for real-time energy optimization. Key features include advanced analytics, remote monitoring capabilities, and seamless integration with existing energy infrastructure. The market is witnessing the emergence of cloud-based solutions enhancing scalability and accessibility.
Key Drivers, Barriers & Challenges in MEA Demand Response Management Systems Industry
Key Drivers:
- Growing energy demand and rising energy costs.
- Government initiatives promoting energy efficiency and renewable energy integration.
- Increasing adoption of smart grids and smart cities.
- Technological advancements in IoT, AI, and cloud computing.
Challenges and Restraints:
- High initial investment costs associated with implementing demand response systems.
- Lack of awareness among end-users regarding the benefits of demand response.
- Interoperability challenges across different systems and platforms.
- Cybersecurity concerns associated with connected devices. The lack of skilled workforce hinders wider adoption.
Emerging Opportunities in MEA Demand Response Management Systems Industry
Emerging opportunities include the expansion into untapped markets, particularly in smaller cities and rural areas. The development of integrated solutions combining demand response with renewable energy sources offers significant potential. Furthermore, the adoption of advanced analytics and machine learning capabilities to optimize energy consumption presents a lucrative opportunity for market players.
Growth Accelerators in the MEA Demand Response Management Systems Industry Industry
Long-term growth will be driven by technological breakthroughs that enhance system efficiency and reduce costs. Strategic partnerships between technology providers and energy companies will also play a significant role. Expansion into new market segments, such as the industrial sector, offers considerable growth potential.
Key Players Shaping the MEA Demand Response Management Systems Market
- ABB Ltd
- Saudi Electricity Company
- Enel SpA
- Mitsubishi Electric Corporation
- Siemens AG
- Alstom SA
- Eaton Corporation PLC
- Schneider Electric
- General Electric Company
Notable Milestones in MEA Demand Response Management Systems Industry Sector
- November 2022: The Abu Dhabi Department of Economic Development (ADDED) launched ETIP 2.0, incentivizing industrial energy efficiency.
- April 2022: The UAE Ministry of Energy and Infrastructure launched a database to monitor energy and water consumption in government buildings, promoting rationalization programs.
In-Depth MEA Demand Response Management Systems Industry Market Outlook
The MEA Demand Response Management Systems market is poised for significant growth, driven by supportive government policies, technological advancements, and increasing energy costs. Strategic partnerships, expansion into new sectors, and innovative product development will be crucial for success in this dynamic market. The focus on sustainability and energy efficiency will further propel market growth in the coming years.
MEA Demand Response Management Systems Industry Segmentation
-
1. Type
- 1.1. Conventional Demand Response
- 1.2. Automated Demand Response
-
2. Geography
- 2.1. United Arab Emirates
- 2.2. Saudi Arabian
- 2.3. South Africa
- 2.4. Res of Middle-East and Africa
MEA Demand Response Management Systems Industry Segmentation By Geography
- 1. United Arab Emirates
- 2. Saudi Arabian
- 3. South Africa
- 4. Res of Middle East and Africa
MEA Demand Response Management Systems Industry REPORT HIGHLIGHTS
| Aspects | Details |
|---|---|
| Study Period | 2019-2033 |
| Base Year | 2024 |
| Estimated Year | 2025 |
| Forecast Period | 2025-2033 |
| Historical Period | 2019-2024 |
| Growth Rate | CAGR of > 10.00% from 2019-2033 |
| Segmentation |
|
Table of Contents
- 1. Introduction
- 1.1. Research Scope
- 1.2. Market Segmentation
- 1.3. Research Methodology
- 1.4. Definitions and Assumptions
- 2. Executive Summary
- 2.1. Introduction
- 3. Market Dynamics
- 3.1. Introduction
- 3.2. Market Drivers
- 3.2.1. 4.; Need for Efficient Energy Management Systems4.; Growing Penetration of Renewable Energy Sources
- 3.3. Market Restrains
- 3.3.1. 4.; Privacy Concerns on the Industrial Demand Response Management Systems
- 3.4. Market Trends
- 3.4.1. Automated Demand Response System to Grow at the Fastest Rate
- 4. Market Factor Analysis
- 4.1. Porters Five Forces
- 4.2. Supply/Value Chain
- 4.3. PESTEL analysis
- 4.4. Market Entropy
- 4.5. Patent/Trademark Analysis
- 5. Global MEA Demand Response Management Systems Industry Analysis, Insights and Forecast, 2019-2031
- 5.1. Market Analysis, Insights and Forecast - by Type
- 5.1.1. Conventional Demand Response
- 5.1.2. Automated Demand Response
- 5.2. Market Analysis, Insights and Forecast - by Geography
- 5.2.1. United Arab Emirates
- 5.2.2. Saudi Arabian
- 5.2.3. South Africa
- 5.2.4. Res of Middle-East and Africa
- 5.3. Market Analysis, Insights and Forecast - by Region
- 5.3.1. United Arab Emirates
- 5.3.2. Saudi Arabian
- 5.3.3. South Africa
- 5.3.4. Res of Middle East and Africa
- 5.1. Market Analysis, Insights and Forecast - by Type
- 6. United Arab Emirates MEA Demand Response Management Systems Industry Analysis, Insights and Forecast, 2019-2031
- 6.1. Market Analysis, Insights and Forecast - by Type
- 6.1.1. Conventional Demand Response
- 6.1.2. Automated Demand Response
- 6.2. Market Analysis, Insights and Forecast - by Geography
- 6.2.1. United Arab Emirates
- 6.2.2. Saudi Arabian
- 6.2.3. South Africa
- 6.2.4. Res of Middle-East and Africa
- 6.1. Market Analysis, Insights and Forecast - by Type
- 7. Saudi Arabian MEA Demand Response Management Systems Industry Analysis, Insights and Forecast, 2019-2031
- 7.1. Market Analysis, Insights and Forecast - by Type
- 7.1.1. Conventional Demand Response
- 7.1.2. Automated Demand Response
- 7.2. Market Analysis, Insights and Forecast - by Geography
- 7.2.1. United Arab Emirates
- 7.2.2. Saudi Arabian
- 7.2.3. South Africa
- 7.2.4. Res of Middle-East and Africa
- 7.1. Market Analysis, Insights and Forecast - by Type
- 8. South Africa MEA Demand Response Management Systems Industry Analysis, Insights and Forecast, 2019-2031
- 8.1. Market Analysis, Insights and Forecast - by Type
- 8.1.1. Conventional Demand Response
- 8.1.2. Automated Demand Response
- 8.2. Market Analysis, Insights and Forecast - by Geography
- 8.2.1. United Arab Emirates
- 8.2.2. Saudi Arabian
- 8.2.3. South Africa
- 8.2.4. Res of Middle-East and Africa
- 8.1. Market Analysis, Insights and Forecast - by Type
- 9. Res of Middle East and Africa MEA Demand Response Management Systems Industry Analysis, Insights and Forecast, 2019-2031
- 9.1. Market Analysis, Insights and Forecast - by Type
- 9.1.1. Conventional Demand Response
- 9.1.2. Automated Demand Response
- 9.2. Market Analysis, Insights and Forecast - by Geography
- 9.2.1. United Arab Emirates
- 9.2.2. Saudi Arabian
- 9.2.3. South Africa
- 9.2.4. Res of Middle-East and Africa
- 9.1. Market Analysis, Insights and Forecast - by Type
- 10. North America MEA Demand Response Management Systems Industry Analysis, Insights and Forecast, 2019-2031
- 10.1. Market Analysis, Insights and Forecast - By Country/Sub-region
- 10.1.1 United States
- 10.1.2 Canada
- 10.1.3 Mexico
- 11. Europe MEA Demand Response Management Systems Industry Analysis, Insights and Forecast, 2019-2031
- 11.1. Market Analysis, Insights and Forecast - By Country/Sub-region
- 11.1.1 Germany
- 11.1.2 United Kingdom
- 11.1.3 France
- 11.1.4 Spain
- 11.1.5 Italy
- 11.1.6 Spain
- 11.1.7 Belgium
- 11.1.8 Netherland
- 11.1.9 Nordics
- 11.1.10 Rest of Europe
- 12. Asia Pacific MEA Demand Response Management Systems Industry Analysis, Insights and Forecast, 2019-2031
- 12.1. Market Analysis, Insights and Forecast - By Country/Sub-region
- 12.1.1 China
- 12.1.2 Japan
- 12.1.3 India
- 12.1.4 South Korea
- 12.1.5 Southeast Asia
- 12.1.6 Australia
- 12.1.7 Indonesia
- 12.1.8 Phillipes
- 12.1.9 Singapore
- 12.1.10 Thailandc
- 12.1.11 Rest of Asia Pacific
- 13. South America MEA Demand Response Management Systems Industry Analysis, Insights and Forecast, 2019-2031
- 13.1. Market Analysis, Insights and Forecast - By Country/Sub-region
- 13.1.1 Brazil
- 13.1.2 Argentina
- 13.1.3 Peru
- 13.1.4 Chile
- 13.1.5 Colombia
- 13.1.6 Ecuador
- 13.1.7 Venezuela
- 13.1.8 Rest of South America
- 14. MEA MEA Demand Response Management Systems Industry Analysis, Insights and Forecast, 2019-2031
- 14.1. Market Analysis, Insights and Forecast - By Country/Sub-region
- 14.1.1 United Arab Emirates
- 14.1.2 Saudi Arabia
- 14.1.3 South Africa
- 14.1.4 Rest of Middle East and Africa
- 15. Competitive Analysis
- 15.1. Global Market Share Analysis 2024
- 15.2. Company Profiles
- 15.2.1 ABB Ltd
- 15.2.1.1. Overview
- 15.2.1.2. Products
- 15.2.1.3. SWOT Analysis
- 15.2.1.4. Recent Developments
- 15.2.1.5. Financials (Based on Availability)
- 15.2.2 Saudi Electricity Company
- 15.2.2.1. Overview
- 15.2.2.2. Products
- 15.2.2.3. SWOT Analysis
- 15.2.2.4. Recent Developments
- 15.2.2.5. Financials (Based on Availability)
- 15.2.3 Enel SpA
- 15.2.3.1. Overview
- 15.2.3.2. Products
- 15.2.3.3. SWOT Analysis
- 15.2.3.4. Recent Developments
- 15.2.3.5. Financials (Based on Availability)
- 15.2.4 Mitsubishi Electric Corporation
- 15.2.4.1. Overview
- 15.2.4.2. Products
- 15.2.4.3. SWOT Analysis
- 15.2.4.4. Recent Developments
- 15.2.4.5. Financials (Based on Availability)
- 15.2.5 Siemens AG
- 15.2.5.1. Overview
- 15.2.5.2. Products
- 15.2.5.3. SWOT Analysis
- 15.2.5.4. Recent Developments
- 15.2.5.5. Financials (Based on Availability)
- 15.2.6 Alstom SA
- 15.2.6.1. Overview
- 15.2.6.2. Products
- 15.2.6.3. SWOT Analysis
- 15.2.6.4. Recent Developments
- 15.2.6.5. Financials (Based on Availability)
- 15.2.7 Eaton Corporation PLC
- 15.2.7.1. Overview
- 15.2.7.2. Products
- 15.2.7.3. SWOT Analysis
- 15.2.7.4. Recent Developments
- 15.2.7.5. Financials (Based on Availability)
- 15.2.8 Schneider Electric
- 15.2.8.1. Overview
- 15.2.8.2. Products
- 15.2.8.3. SWOT Analysis
- 15.2.8.4. Recent Developments
- 15.2.8.5. Financials (Based on Availability)
- 15.2.9 General Electric Company
- 15.2.9.1. Overview
- 15.2.9.2. Products
- 15.2.9.3. SWOT Analysis
- 15.2.9.4. Recent Developments
- 15.2.9.5. Financials (Based on Availability)
- 15.2.1 ABB Ltd
List of Figures
- Figure 1: Global MEA Demand Response Management Systems Industry Revenue Breakdown (Million, %) by Region 2024 & 2032
- Figure 2: North America MEA Demand Response Management Systems Industry Revenue (Million), by Country 2024 & 2032
- Figure 3: North America MEA Demand Response Management Systems Industry Revenue Share (%), by Country 2024 & 2032
- Figure 4: Europe MEA Demand Response Management Systems Industry Revenue (Million), by Country 2024 & 2032
- Figure 5: Europe MEA Demand Response Management Systems Industry Revenue Share (%), by Country 2024 & 2032
- Figure 6: Asia Pacific MEA Demand Response Management Systems Industry Revenue (Million), by Country 2024 & 2032
- Figure 7: Asia Pacific MEA Demand Response Management Systems Industry Revenue Share (%), by Country 2024 & 2032
- Figure 8: South America MEA Demand Response Management Systems Industry Revenue (Million), by Country 2024 & 2032
- Figure 9: South America MEA Demand Response Management Systems Industry Revenue Share (%), by Country 2024 & 2032
- Figure 10: MEA MEA Demand Response Management Systems Industry Revenue (Million), by Country 2024 & 2032
- Figure 11: MEA MEA Demand Response Management Systems Industry Revenue Share (%), by Country 2024 & 2032
- Figure 12: United Arab Emirates MEA Demand Response Management Systems Industry Revenue (Million), by Type 2024 & 2032
- Figure 13: United Arab Emirates MEA Demand Response Management Systems Industry Revenue Share (%), by Type 2024 & 2032
- Figure 14: United Arab Emirates MEA Demand Response Management Systems Industry Revenue (Million), by Geography 2024 & 2032
- Figure 15: United Arab Emirates MEA Demand Response Management Systems Industry Revenue Share (%), by Geography 2024 & 2032
- Figure 16: United Arab Emirates MEA Demand Response Management Systems Industry Revenue (Million), by Country 2024 & 2032
- Figure 17: United Arab Emirates MEA Demand Response Management Systems Industry Revenue Share (%), by Country 2024 & 2032
- Figure 18: Saudi Arabian MEA Demand Response Management Systems Industry Revenue (Million), by Type 2024 & 2032
- Figure 19: Saudi Arabian MEA Demand Response Management Systems Industry Revenue Share (%), by Type 2024 & 2032
- Figure 20: Saudi Arabian MEA Demand Response Management Systems Industry Revenue (Million), by Geography 2024 & 2032
- Figure 21: Saudi Arabian MEA Demand Response Management Systems Industry Revenue Share (%), by Geography 2024 & 2032
- Figure 22: Saudi Arabian MEA Demand Response Management Systems Industry Revenue (Million), by Country 2024 & 2032
- Figure 23: Saudi Arabian MEA Demand Response Management Systems Industry Revenue Share (%), by Country 2024 & 2032
- Figure 24: South Africa MEA Demand Response Management Systems Industry Revenue (Million), by Type 2024 & 2032
- Figure 25: South Africa MEA Demand Response Management Systems Industry Revenue Share (%), by Type 2024 & 2032
- Figure 26: South Africa MEA Demand Response Management Systems Industry Revenue (Million), by Geography 2024 & 2032
- Figure 27: South Africa MEA Demand Response Management Systems Industry Revenue Share (%), by Geography 2024 & 2032
- Figure 28: South Africa MEA Demand Response Management Systems Industry Revenue (Million), by Country 2024 & 2032
- Figure 29: South Africa MEA Demand Response Management Systems Industry Revenue Share (%), by Country 2024 & 2032
- Figure 30: Res of Middle East and Africa MEA Demand Response Management Systems Industry Revenue (Million), by Type 2024 & 2032
- Figure 31: Res of Middle East and Africa MEA Demand Response Management Systems Industry Revenue Share (%), by Type 2024 & 2032
- Figure 32: Res of Middle East and Africa MEA Demand Response Management Systems Industry Revenue (Million), by Geography 2024 & 2032
- Figure 33: Res of Middle East and Africa MEA Demand Response Management Systems Industry Revenue Share (%), by Geography 2024 & 2032
- Figure 34: Res of Middle East and Africa MEA Demand Response Management Systems Industry Revenue (Million), by Country 2024 & 2032
- Figure 35: Res of Middle East and Africa MEA Demand Response Management Systems Industry Revenue Share (%), by Country 2024 & 2032
List of Tables
- Table 1: Global MEA Demand Response Management Systems Industry Revenue Million Forecast, by Region 2019 & 2032
- Table 2: Global MEA Demand Response Management Systems Industry Revenue Million Forecast, by Type 2019 & 2032
- Table 3: Global MEA Demand Response Management Systems Industry Revenue Million Forecast, by Geography 2019 & 2032
- Table 4: Global MEA Demand Response Management Systems Industry Revenue Million Forecast, by Region 2019 & 2032
- Table 5: Global MEA Demand Response Management Systems Industry Revenue Million Forecast, by Country 2019 & 2032
- Table 6: United States MEA Demand Response Management Systems Industry Revenue (Million) Forecast, by Application 2019 & 2032
- Table 7: Canada MEA Demand Response Management Systems Industry Revenue (Million) Forecast, by Application 2019 & 2032
- Table 8: Mexico MEA Demand Response Management Systems Industry Revenue (Million) Forecast, by Application 2019 & 2032
- Table 9: Global MEA Demand Response Management Systems Industry Revenue Million Forecast, by Country 2019 & 2032
- Table 10: Germany MEA Demand Response Management Systems Industry Revenue (Million) Forecast, by Application 2019 & 2032
- Table 11: United Kingdom MEA Demand Response Management Systems Industry Revenue (Million) Forecast, by Application 2019 & 2032
- Table 12: France MEA Demand Response Management Systems Industry Revenue (Million) Forecast, by Application 2019 & 2032
- Table 13: Spain MEA Demand Response Management Systems Industry Revenue (Million) Forecast, by Application 2019 & 2032
- Table 14: Italy MEA Demand Response Management Systems Industry Revenue (Million) Forecast, by Application 2019 & 2032
- Table 15: Spain MEA Demand Response Management Systems Industry Revenue (Million) Forecast, by Application 2019 & 2032
- Table 16: Belgium MEA Demand Response Management Systems Industry Revenue (Million) Forecast, by Application 2019 & 2032
- Table 17: Netherland MEA Demand Response Management Systems Industry Revenue (Million) Forecast, by Application 2019 & 2032
- Table 18: Nordics MEA Demand Response Management Systems Industry Revenue (Million) Forecast, by Application 2019 & 2032
- Table 19: Rest of Europe MEA Demand Response Management Systems Industry Revenue (Million) Forecast, by Application 2019 & 2032
- Table 20: Global MEA Demand Response Management Systems Industry Revenue Million Forecast, by Country 2019 & 2032
- Table 21: China MEA Demand Response Management Systems Industry Revenue (Million) Forecast, by Application 2019 & 2032
- Table 22: Japan MEA Demand Response Management Systems Industry Revenue (Million) Forecast, by Application 2019 & 2032
- Table 23: India MEA Demand Response Management Systems Industry Revenue (Million) Forecast, by Application 2019 & 2032
- Table 24: South Korea MEA Demand Response Management Systems Industry Revenue (Million) Forecast, by Application 2019 & 2032
- Table 25: Southeast Asia MEA Demand Response Management Systems Industry Revenue (Million) Forecast, by Application 2019 & 2032
- Table 26: Australia MEA Demand Response Management Systems Industry Revenue (Million) Forecast, by Application 2019 & 2032
- Table 27: Indonesia MEA Demand Response Management Systems Industry Revenue (Million) Forecast, by Application 2019 & 2032
- Table 28: Phillipes MEA Demand Response Management Systems Industry Revenue (Million) Forecast, by Application 2019 & 2032
- Table 29: Singapore MEA Demand Response Management Systems Industry Revenue (Million) Forecast, by Application 2019 & 2032
- Table 30: Thailandc MEA Demand Response Management Systems Industry Revenue (Million) Forecast, by Application 2019 & 2032
- Table 31: Rest of Asia Pacific MEA Demand Response Management Systems Industry Revenue (Million) Forecast, by Application 2019 & 2032
- Table 32: Global MEA Demand Response Management Systems Industry Revenue Million Forecast, by Country 2019 & 2032
- Table 33: Brazil MEA Demand Response Management Systems Industry Revenue (Million) Forecast, by Application 2019 & 2032
- Table 34: Argentina MEA Demand Response Management Systems Industry Revenue (Million) Forecast, by Application 2019 & 2032
- Table 35: Peru MEA Demand Response Management Systems Industry Revenue (Million) Forecast, by Application 2019 & 2032
- Table 36: Chile MEA Demand Response Management Systems Industry Revenue (Million) Forecast, by Application 2019 & 2032
- Table 37: Colombia MEA Demand Response Management Systems Industry Revenue (Million) Forecast, by Application 2019 & 2032
- Table 38: Ecuador MEA Demand Response Management Systems Industry Revenue (Million) Forecast, by Application 2019 & 2032
- Table 39: Venezuela MEA Demand Response Management Systems Industry Revenue (Million) Forecast, by Application 2019 & 2032
- Table 40: Rest of South America MEA Demand Response Management Systems Industry Revenue (Million) Forecast, by Application 2019 & 2032
- Table 41: Global MEA Demand Response Management Systems Industry Revenue Million Forecast, by Country 2019 & 2032
- Table 42: United Arab Emirates MEA Demand Response Management Systems Industry Revenue (Million) Forecast, by Application 2019 & 2032
- Table 43: Saudi Arabia MEA Demand Response Management Systems Industry Revenue (Million) Forecast, by Application 2019 & 2032
- Table 44: South Africa MEA Demand Response Management Systems Industry Revenue (Million) Forecast, by Application 2019 & 2032
- Table 45: Rest of Middle East and Africa MEA Demand Response Management Systems Industry Revenue (Million) Forecast, by Application 2019 & 2032
- Table 46: Global MEA Demand Response Management Systems Industry Revenue Million Forecast, by Type 2019 & 2032
- Table 47: Global MEA Demand Response Management Systems Industry Revenue Million Forecast, by Geography 2019 & 2032
- Table 48: Global MEA Demand Response Management Systems Industry Revenue Million Forecast, by Country 2019 & 2032
- Table 49: Global MEA Demand Response Management Systems Industry Revenue Million Forecast, by Type 2019 & 2032
- Table 50: Global MEA Demand Response Management Systems Industry Revenue Million Forecast, by Geography 2019 & 2032
- Table 51: Global MEA Demand Response Management Systems Industry Revenue Million Forecast, by Country 2019 & 2032
- Table 52: Global MEA Demand Response Management Systems Industry Revenue Million Forecast, by Type 2019 & 2032
- Table 53: Global MEA Demand Response Management Systems Industry Revenue Million Forecast, by Geography 2019 & 2032
- Table 54: Global MEA Demand Response Management Systems Industry Revenue Million Forecast, by Country 2019 & 2032
- Table 55: Global MEA Demand Response Management Systems Industry Revenue Million Forecast, by Type 2019 & 2032
- Table 56: Global MEA Demand Response Management Systems Industry Revenue Million Forecast, by Geography 2019 & 2032
- Table 57: Global MEA Demand Response Management Systems Industry Revenue Million Forecast, by Country 2019 & 2032
Frequently Asked Questions
1. What is the projected Compound Annual Growth Rate (CAGR) of the MEA Demand Response Management Systems Industry?
The projected CAGR is approximately > 10.00%.
2. Which companies are prominent players in the MEA Demand Response Management Systems Industry?
Key companies in the market include ABB Ltd, Saudi Electricity Company, Enel SpA, Mitsubishi Electric Corporation, Siemens AG, Alstom SA, Eaton Corporation PLC, Schneider Electric, General Electric Company.
3. What are the main segments of the MEA Demand Response Management Systems Industry?
The market segments include Type, Geography.
4. Can you provide details about the market size?
The market size is estimated to be USD XX Million as of 2022.
5. What are some drivers contributing to market growth?
4.; Need for Efficient Energy Management Systems4.; Growing Penetration of Renewable Energy Sources.
6. What are the notable trends driving market growth?
Automated Demand Response System to Grow at the Fastest Rate.
7. Are there any restraints impacting market growth?
4.; Privacy Concerns on the Industrial Demand Response Management Systems.
8. Can you provide examples of recent developments in the market?
Nov 2022: The Abu Dhabi Department of Economic Development (ADDED) expanded the Energy Tariff Incentive Programme (ETIP 2.0) by offering preferential rates for gas and electricity to the industrial sector based on eligibility criteria that include economic impact, Emiratisation rate, and energy management efficiency.
9. What pricing options are available for accessing the report?
Pricing options include single-user, multi-user, and enterprise licenses priced at USD 4750, USD 5250, and USD 8750 respectively.
10. Is the market size provided in terms of value or volume?
The market size is provided in terms of value, measured in Million.
11. Are there any specific market keywords associated with the report?
Yes, the market keyword associated with the report is "MEA Demand Response Management Systems Industry," which aids in identifying and referencing the specific market segment covered.
12. How do I determine which pricing option suits my needs best?
The pricing options vary based on user requirements and access needs. Individual users may opt for single-user licenses, while businesses requiring broader access may choose multi-user or enterprise licenses for cost-effective access to the report.
13. Are there any additional resources or data provided in the MEA Demand Response Management Systems Industry report?
While the report offers comprehensive insights, it's advisable to review the specific contents or supplementary materials provided to ascertain if additional resources or data are available.
14. How can I stay updated on further developments or reports in the MEA Demand Response Management Systems Industry?
To stay informed about further developments, trends, and reports in the MEA Demand Response Management Systems Industry, consider subscribing to industry newsletters, following relevant companies and organizations, or regularly checking reputable industry news sources and publications.
Methodology
Step 1 - Identification of Relevant Samples Size from Population Database


Step 2 - Approaches for Defining Global Market Size (Value, Volume* & Price*)

Note*: In applicable scenarios
Step 3 - Data Sources
Primary Research
- Web Analytics
- Survey Reports
- Research Institute
- Latest Research Reports
- Opinion Leaders
Secondary Research
- Annual Reports
- White Paper
- Latest Press Release
- Industry Association
- Paid Database
- Investor Presentations

Step 4 - Data Triangulation
Involves using different sources of information in order to increase the validity of a study
These sources are likely to be stakeholders in a program - participants, other researchers, program staff, other community members, and so on.
Then we put all data in single framework & apply various statistical tools to find out the dynamic on the market.
During the analysis stage, feedback from the stakeholder groups would be compared to determine areas of agreement as well as areas of divergence


