
Key Insights
The MEA Compressed Natural Gas (CNG) Dispenser market, while currently smaller than other regions, exhibits significant growth potential fueled by increasing government initiatives promoting cleaner transportation fuels and the expanding commercial fleet sector across the Middle East and Africa. Governments in several MEA countries are actively investing in CNG infrastructure to reduce reliance on oil and mitigate carbon emissions. This investment is driving the construction of new CNG filling stations and consequently, increasing demand for CNG dispensers. The market is segmented by dispenser type (fast-fill and slow-fill), number of nozzles (single, dual, and four), and end-user (commercial fleets, public transportation, and retail). Fast-fill dispensers are expected to dominate due to their efficiency, enabling quicker refueling times and increased throughput. The commercial fleet segment represents a significant portion of the market, with logistics and transportation companies increasingly adopting CNG vehicles to reduce operating costs and meet environmental regulations. The market's growth is, however, tempered by the relatively higher initial investment required for CNG infrastructure compared to traditional fuels, as well as challenges associated with establishing a widespread and reliable CNG supply chain across the diverse geographical landscape of the MEA region.
Growth is projected to be driven by the expansion of CNG-powered public transportation in major cities, coupled with supportive government policies in key countries like the UAE and Saudi Arabia. The ongoing efforts to diversify energy sources and reduce carbon emissions will act as significant catalysts. Furthermore, the increasing adoption of CNG in industrial applications, such as material handling equipment in factories and warehouses, is anticipated to contribute to market expansion. While the initial investment cost remains a restraint, the long-term operational cost savings and environmental benefits associated with CNG are expected to incentivize further adoption, leading to a steady, albeit perhaps initially moderate, growth trajectory for the MEA CNG dispenser market in the coming years. Factors like geopolitical stability, economic conditions in individual countries, and technological advancements in dispenser design and efficiency will influence the market's performance.
MEA Compressed Natural Gas Dispenser Market: A Comprehensive Report (2019-2033)
This comprehensive report provides an in-depth analysis of the Middle East and Africa (MEA) Compressed Natural Gas (CNG) Dispenser market, encompassing market dynamics, growth trends, regional dominance, product landscape, and key players. The study covers the period from 2019 to 2033, with 2025 as the base year and a forecast period extending to 2033. The report is crucial for industry professionals, investors, and stakeholders seeking a detailed understanding of this dynamic market. The total market value in 2025 is estimated at xx Million Units.
MEA Compressed Natural Gas Dispenser Market Dynamics & Structure
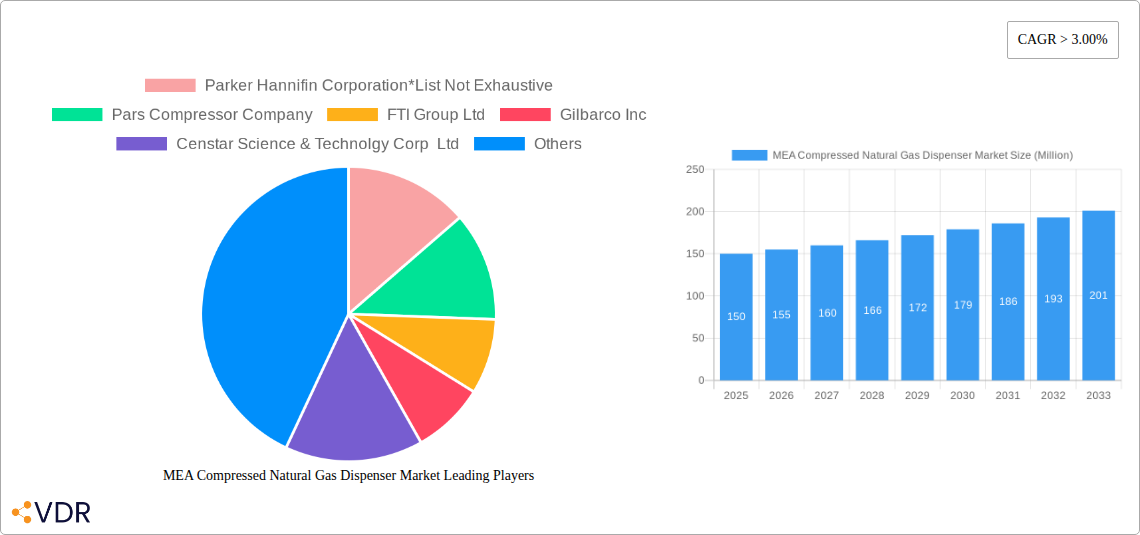
The MEA CNG dispenser market is characterized by a moderately fragmented landscape, with several key players competing alongside smaller regional companies. Market concentration is expected to remain relatively stable throughout the forecast period, although potential for consolidation through mergers and acquisitions (M&A) remains a possibility. Technological innovation, primarily driven by advancements in dispensing speed, nozzle technology, and safety features, is a key growth driver. Stringent regulatory frameworks concerning safety and environmental standards significantly impact market growth, while the availability of alternative fuels presents competitive pressure. The end-user demographics are diverse, encompassing commercial fleets, public transportation systems, and retail CNG stations. M&A activity within the MEA CNG dispenser sector is anticipated to increase as larger players seek to expand their market share and geographic reach.
- Market Concentration: Moderately fragmented, with xx% market share held by the top 5 players in 2025.
- Technological Innovation: Focus on increased dispensing speed (fast-fill vs slow-fill), advanced safety features, and remote monitoring capabilities.
- Regulatory Framework: Stringent safety and environmental regulations influence dispenser design and operation.
- Competitive Substitutes: Competition from other alternative fuels (e.g., LNG, electricity) impacts market growth.
- End-User Demographics: Commercial fleets (xx%), Public Transportation (xx%), Retail (xx%).
- M&A Trends: xx M&A deals projected between 2025 and 2033, primarily driven by expansion strategies.
MEA Compressed Natural Gas Dispenser Market Growth Trends & Insights
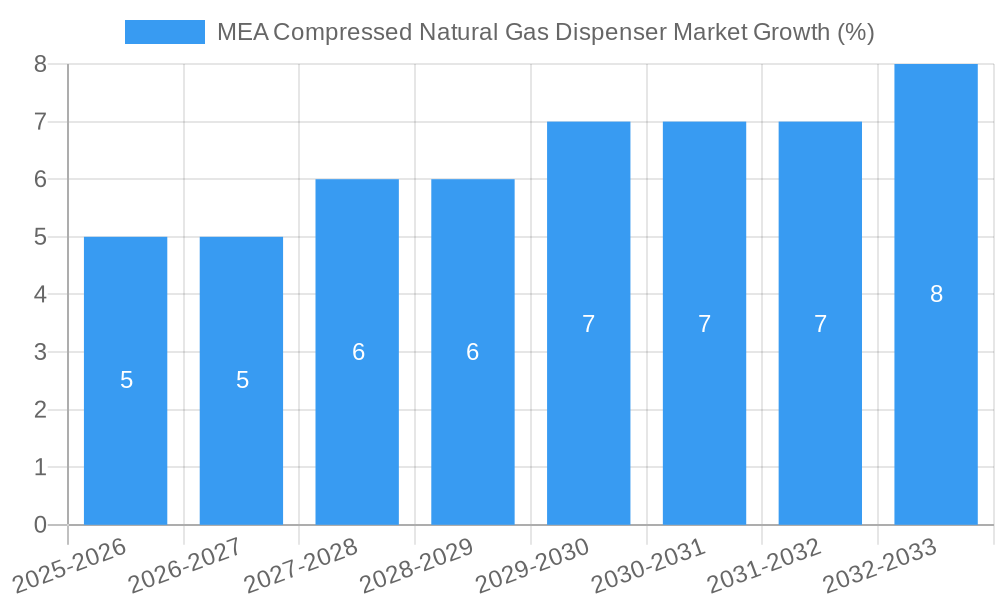
The MEA CNG dispenser market is experiencing robust growth, driven by increasing government support for CNG as a cleaner alternative fuel, expanding CNG infrastructure, and rising demand from commercial and public transportation sectors. The market exhibited a CAGR of xx% during the historical period (2019-2024) and is projected to maintain a CAGR of xx% during the forecast period (2025-2033), reaching an estimated market size of xx Million Units by 2033. Technological advancements in dispenser technology, such as the introduction of faster fill dispensers and improved safety mechanisms are contributing to higher adoption rates across various segments. Consumer behavior is shifting towards environmentally friendly transportation solutions, further boosting market growth.
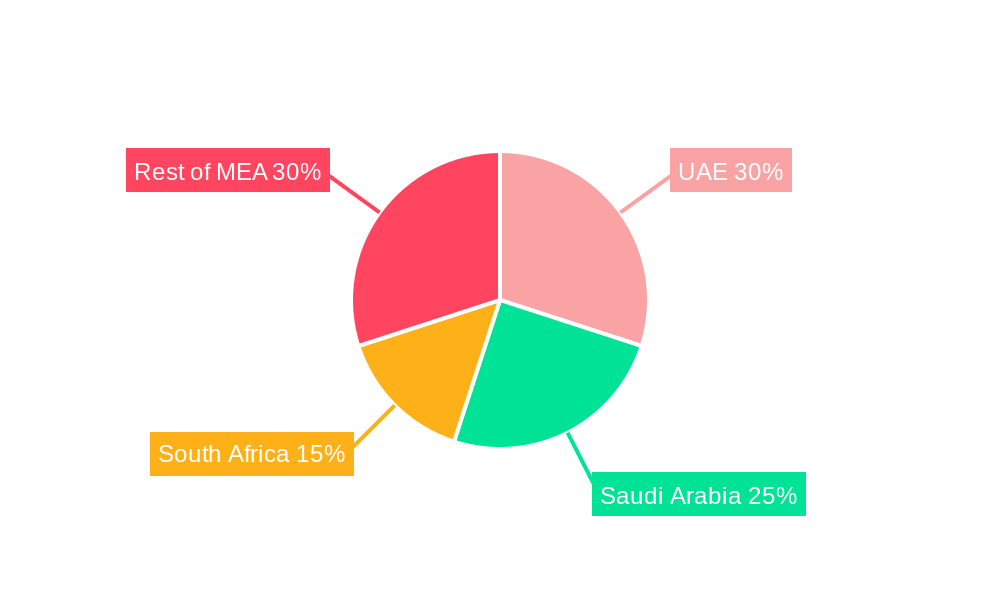
Dominant Regions, Countries, or Segments in MEA Compressed Natural Gas Dispenser Market
The [Specific Country/Region, e.g., United Arab Emirates or GCC countries] is currently the dominant region within the MEA CNG dispenser market, driven by supportive government policies promoting CNG adoption, substantial investments in CNG infrastructure development, and a large fleet of commercial vehicles. Fast-fill dispensers dominate the market by type due to their efficiency in reducing refueling time. The two-nozzle and four-nozzle dispensers are becoming increasingly prevalent owing to their capacity to cater to the needs of high-volume refueling sites. Commercial fleets represent a significant end-user segment in this region, demonstrating substantial growth potential.
- Key Drivers: Government incentives, expanding CNG infrastructure, rising commercial fleet size, and increased focus on reducing carbon emissions.
- Dominance Factors: Supportive government policies, robust CNG infrastructure investments, high demand from commercial and public transport sectors, and a favorable regulatory environment.
- Growth Potential: Significant untapped potential in less-developed regions within the MEA.
MEA Compressed Natural Gas Dispenser Market Product Landscape
The MEA CNG dispenser market features a range of products catering to diverse needs. Fast-fill dispensers offer significantly faster refueling times, while slow-fill dispensers are more cost-effective for low-volume applications. Dispensers are available with single, two, or four nozzles, depending on capacity requirements. Technological advancements include improved safety mechanisms, remote monitoring capabilities, and increased dispensing accuracy. Unique selling propositions (USPs) often focus on speed, reliability, and ease of maintenance.
Key Drivers, Barriers & Challenges in MEA Compressed Natural Gas Dispenser Market
Key Drivers: Increasing government regulations promoting CNG adoption, expanding CNG fueling infrastructure, growth in commercial and public transportation, and rising environmental concerns. For example, several governments in the MEA are actively investing in CNG infrastructure development and providing incentives for CNG vehicle adoption.
Challenges: High initial investment costs for CNG infrastructure, lack of awareness among consumers regarding CNG benefits, limited availability of CNG vehicles in certain regions, potential supply chain disruptions, and intense competition from alternative fuel dispensing technologies. The lack of a comprehensive and coordinated CNG infrastructure development plan across the region poses a considerable challenge.
Emerging Opportunities in MEA Compressed Natural Gas Dispenser Market
Emerging opportunities lie in untapped markets across the MEA region, particularly in countries with limited CNG infrastructure. The increasing adoption of CNG in non-transportation applications, such as industrial and commercial settings, presents a promising avenue for growth. Innovations in dispenser technology, such as the development of multi-fuel dispensers, also create significant opportunities for market expansion. Furthermore, the growing focus on sustainability and reducing carbon emissions provides a fertile ground for CNG dispenser adoption.
Growth Accelerators in the MEA Compressed Natural Gas Dispenser Market Industry
Several factors will propel the long-term growth of the MEA CNG dispenser market. Continuous technological innovations, such as improved dispensing speeds and enhanced safety features, will enhance market attractiveness. Strategic partnerships between CNG dispenser manufacturers and vehicle manufacturers will accelerate market penetration. Government initiatives to expand CNG infrastructure and provide incentives for CNG vehicle adoption will further contribute to market growth. Expansion into new markets and emerging applications within the MEA region will also stimulate long-term growth.
Key Players Shaping the MEA Compressed Natural Gas Dispenser Market Market
- Parker Hannifin Corporation
- Pars Compressor Company
- FTI Group Ltd
- Gilbarco Inc
- Censtar Science & Technolgy Corp Ltd
- Compressor Sazi Tabriz
- Galileo Technologies SA
- Dover Fuelling Solutions
Notable Milestones in MEA Compressed Natural Gas Dispenser Market Sector
- July 2022: Dover Fuelling Solutions (DFS) launched a new technologically advanced four-nozzle Wayne Helix CNG dispenser and hydrogen dispenser for the EMEA region. This launch signals a significant advancement in CNG dispenser technology and is expected to drive market growth in the MEA region.
In-Depth MEA Compressed Natural Gas Dispenser Market Market Outlook
The future of the MEA CNG dispenser market appears exceptionally promising, driven by strong growth drivers and supportive government policies. Strategic investments in CNG infrastructure, coupled with technological advancements, are poised to fuel sustained market expansion. The increasing adoption of CNG across various sectors presents substantial opportunities for market players. The market is expected to witness significant growth in the coming years, creating a favorable environment for both established and emerging players to capitalize on the considerable market potential.
MEA Compressed Natural Gas Dispenser Market Segmentation
-
1. Geography
- 1.1. United Arab Emirates
- 1.2. Saudi Arabia
- 1.3. Egypt
- 1.4. Tanzania
- 1.5. Rest of Middle-East and Africa
MEA Compressed Natural Gas Dispenser Market Segmentation By Geography
- 1. United Arab Emirates
- 2. Saudi Arabia
- 3. Egypt
- 4. Tanzania
- 5. Rest of Middle East and Africa
MEA Compressed Natural Gas Dispenser Market REPORT HIGHLIGHTS
| Aspects | Details |
|---|---|
| Study Period | 2019-2033 |
| Base Year | 2024 |
| Estimated Year | 2025 |
| Forecast Period | 2025-2033 |
| Historical Period | 2019-2024 |
| Growth Rate | CAGR of > 3.00% from 2019-2033 |
| Segmentation |
|
Table of Contents
- 1. Introduction
- 1.1. Research Scope
- 1.2. Market Segmentation
- 1.3. Research Methodology
- 1.4. Definitions and Assumptions
- 2. Executive Summary
- 2.1. Introduction
- 3. Market Dynamics
- 3.1. Introduction
- 3.2. Market Drivers
- 3.2.1. Increasing Offshore Oil and Gas Exploration and Production Activities4.; Growing Demand for Energy
- 3.3. Market Restrains
- 3.3.1. High Upfront Costs
- 3.4. Market Trends
- 3.4.1. Growing Demand of CNG vehicles Expected to Drive the Market
- 4. Market Factor Analysis
- 4.1. Porters Five Forces
- 4.2. Supply/Value Chain
- 4.3. PESTEL analysis
- 4.4. Market Entropy
- 4.5. Patent/Trademark Analysis
- 5. Global MEA Compressed Natural Gas Dispenser Market Analysis, Insights and Forecast, 2019-2031
- 5.1. Market Analysis, Insights and Forecast - by Geography
- 5.1.1. United Arab Emirates
- 5.1.2. Saudi Arabia
- 5.1.3. Egypt
- 5.1.4. Tanzania
- 5.1.5. Rest of Middle-East and Africa
- 5.2. Market Analysis, Insights and Forecast - by Region
- 5.2.1. United Arab Emirates
- 5.2.2. Saudi Arabia
- 5.2.3. Egypt
- 5.2.4. Tanzania
- 5.2.5. Rest of Middle East and Africa
- 5.1. Market Analysis, Insights and Forecast - by Geography
- 6. United Arab Emirates MEA Compressed Natural Gas Dispenser Market Analysis, Insights and Forecast, 2019-2031
- 6.1. Market Analysis, Insights and Forecast - by Geography
- 6.1.1. United Arab Emirates
- 6.1.2. Saudi Arabia
- 6.1.3. Egypt
- 6.1.4. Tanzania
- 6.1.5. Rest of Middle-East and Africa
- 6.1. Market Analysis, Insights and Forecast - by Geography
- 7. Saudi Arabia MEA Compressed Natural Gas Dispenser Market Analysis, Insights and Forecast, 2019-2031
- 7.1. Market Analysis, Insights and Forecast - by Geography
- 7.1.1. United Arab Emirates
- 7.1.2. Saudi Arabia
- 7.1.3. Egypt
- 7.1.4. Tanzania
- 7.1.5. Rest of Middle-East and Africa
- 7.1. Market Analysis, Insights and Forecast - by Geography
- 8. Egypt MEA Compressed Natural Gas Dispenser Market Analysis, Insights and Forecast, 2019-2031
- 8.1. Market Analysis, Insights and Forecast - by Geography
- 8.1.1. United Arab Emirates
- 8.1.2. Saudi Arabia
- 8.1.3. Egypt
- 8.1.4. Tanzania
- 8.1.5. Rest of Middle-East and Africa
- 8.1. Market Analysis, Insights and Forecast - by Geography
- 9. Tanzania MEA Compressed Natural Gas Dispenser Market Analysis, Insights and Forecast, 2019-2031
- 9.1. Market Analysis, Insights and Forecast - by Geography
- 9.1.1. United Arab Emirates
- 9.1.2. Saudi Arabia
- 9.1.3. Egypt
- 9.1.4. Tanzania
- 9.1.5. Rest of Middle-East and Africa
- 9.1. Market Analysis, Insights and Forecast - by Geography
- 10. Rest of Middle East and Africa MEA Compressed Natural Gas Dispenser Market Analysis, Insights and Forecast, 2019-2031
- 10.1. Market Analysis, Insights and Forecast - by Geography
- 10.1.1. United Arab Emirates
- 10.1.2. Saudi Arabia
- 10.1.3. Egypt
- 10.1.4. Tanzania
- 10.1.5. Rest of Middle-East and Africa
- 10.1. Market Analysis, Insights and Forecast - by Geography
- 11. North America MEA Compressed Natural Gas Dispenser Market Analysis, Insights and Forecast, 2019-2031
- 11.1. Market Analysis, Insights and Forecast - By Country/Sub-region
- 11.1.1 United States
- 11.1.2 Canada
- 11.1.3 Mexico
- 12. Europe MEA Compressed Natural Gas Dispenser Market Analysis, Insights and Forecast, 2019-2031
- 12.1. Market Analysis, Insights and Forecast - By Country/Sub-region
- 12.1.1 Germany
- 12.1.2 United Kingdom
- 12.1.3 France
- 12.1.4 Spain
- 12.1.5 Italy
- 12.1.6 Spain
- 12.1.7 Belgium
- 12.1.8 Netherland
- 12.1.9 Nordics
- 12.1.10 Rest of Europe
- 13. Asia Pacific MEA Compressed Natural Gas Dispenser Market Analysis, Insights and Forecast, 2019-2031
- 13.1. Market Analysis, Insights and Forecast - By Country/Sub-region
- 13.1.1 China
- 13.1.2 Japan
- 13.1.3 India
- 13.1.4 South Korea
- 13.1.5 Southeast Asia
- 13.1.6 Australia
- 13.1.7 Indonesia
- 13.1.8 Phillipes
- 13.1.9 Singapore
- 13.1.10 Thailandc
- 13.1.11 Rest of Asia Pacific
- 14. South America MEA Compressed Natural Gas Dispenser Market Analysis, Insights and Forecast, 2019-2031
- 14.1. Market Analysis, Insights and Forecast - By Country/Sub-region
- 14.1.1 Brazil
- 14.1.2 Argentina
- 14.1.3 Peru
- 14.1.4 Chile
- 14.1.5 Colombia
- 14.1.6 Ecuador
- 14.1.7 Venezuela
- 14.1.8 Rest of South America
- 15. MEA MEA Compressed Natural Gas Dispenser Market Analysis, Insights and Forecast, 2019-2031
- 15.1. Market Analysis, Insights and Forecast - By Country/Sub-region
- 15.1.1 United Arab Emirates
- 15.1.2 Saudi Arabia
- 15.1.3 South Africa
- 15.1.4 Rest of Middle East and Africa
- 16. Competitive Analysis
- 16.1. Global Market Share Analysis 2024
- 16.2. Company Profiles
- 16.2.1 Parker Hannifin Corporation*List Not Exhaustive
- 16.2.1.1. Overview
- 16.2.1.2. Products
- 16.2.1.3. SWOT Analysis
- 16.2.1.4. Recent Developments
- 16.2.1.5. Financials (Based on Availability)
- 16.2.2 Pars Compressor Company
- 16.2.2.1. Overview
- 16.2.2.2. Products
- 16.2.2.3. SWOT Analysis
- 16.2.2.4. Recent Developments
- 16.2.2.5. Financials (Based on Availability)
- 16.2.3 FTI Group Ltd
- 16.2.3.1. Overview
- 16.2.3.2. Products
- 16.2.3.3. SWOT Analysis
- 16.2.3.4. Recent Developments
- 16.2.3.5. Financials (Based on Availability)
- 16.2.4 Gilbarco Inc
- 16.2.4.1. Overview
- 16.2.4.2. Products
- 16.2.4.3. SWOT Analysis
- 16.2.4.4. Recent Developments
- 16.2.4.5. Financials (Based on Availability)
- 16.2.5 Censtar Science & Technolgy Corp Ltd
- 16.2.5.1. Overview
- 16.2.5.2. Products
- 16.2.5.3. SWOT Analysis
- 16.2.5.4. Recent Developments
- 16.2.5.5. Financials (Based on Availability)
- 16.2.6 Compressor Sazi Tabriz
- 16.2.6.1. Overview
- 16.2.6.2. Products
- 16.2.6.3. SWOT Analysis
- 16.2.6.4. Recent Developments
- 16.2.6.5. Financials (Based on Availability)
- 16.2.7 Galileo Technologies SA
- 16.2.7.1. Overview
- 16.2.7.2. Products
- 16.2.7.3. SWOT Analysis
- 16.2.7.4. Recent Developments
- 16.2.7.5. Financials (Based on Availability)
- 16.2.8 Dover Fuelling Solutions
- 16.2.8.1. Overview
- 16.2.8.2. Products
- 16.2.8.3. SWOT Analysis
- 16.2.8.4. Recent Developments
- 16.2.8.5. Financials (Based on Availability)
- 16.2.1 Parker Hannifin Corporation*List Not Exhaustive
List of Figures
- Figure 1: Global MEA Compressed Natural Gas Dispenser Market Revenue Breakdown (Million, %) by Region 2024 & 2032
- Figure 2: Global MEA Compressed Natural Gas Dispenser Market Volume Breakdown (K Unit, %) by Region 2024 & 2032
- Figure 3: North America MEA Compressed Natural Gas Dispenser Market Revenue (Million), by Country 2024 & 2032
- Figure 4: North America MEA Compressed Natural Gas Dispenser Market Volume (K Unit), by Country 2024 & 2032
- Figure 5: North America MEA Compressed Natural Gas Dispenser Market Revenue Share (%), by Country 2024 & 2032
- Figure 6: North America MEA Compressed Natural Gas Dispenser Market Volume Share (%), by Country 2024 & 2032
- Figure 7: Europe MEA Compressed Natural Gas Dispenser Market Revenue (Million), by Country 2024 & 2032
- Figure 8: Europe MEA Compressed Natural Gas Dispenser Market Volume (K Unit), by Country 2024 & 2032
- Figure 9: Europe MEA Compressed Natural Gas Dispenser Market Revenue Share (%), by Country 2024 & 2032
- Figure 10: Europe MEA Compressed Natural Gas Dispenser Market Volume Share (%), by Country 2024 & 2032
- Figure 11: Asia Pacific MEA Compressed Natural Gas Dispenser Market Revenue (Million), by Country 2024 & 2032
- Figure 12: Asia Pacific MEA Compressed Natural Gas Dispenser Market Volume (K Unit), by Country 2024 & 2032
- Figure 13: Asia Pacific MEA Compressed Natural Gas Dispenser Market Revenue Share (%), by Country 2024 & 2032
- Figure 14: Asia Pacific MEA Compressed Natural Gas Dispenser Market Volume Share (%), by Country 2024 & 2032
- Figure 15: South America MEA Compressed Natural Gas Dispenser Market Revenue (Million), by Country 2024 & 2032
- Figure 16: South America MEA Compressed Natural Gas Dispenser Market Volume (K Unit), by Country 2024 & 2032
- Figure 17: South America MEA Compressed Natural Gas Dispenser Market Revenue Share (%), by Country 2024 & 2032
- Figure 18: South America MEA Compressed Natural Gas Dispenser Market Volume Share (%), by Country 2024 & 2032
- Figure 19: MEA MEA Compressed Natural Gas Dispenser Market Revenue (Million), by Country 2024 & 2032
- Figure 20: MEA MEA Compressed Natural Gas Dispenser Market Volume (K Unit), by Country 2024 & 2032
- Figure 21: MEA MEA Compressed Natural Gas Dispenser Market Revenue Share (%), by Country 2024 & 2032
- Figure 22: MEA MEA Compressed Natural Gas Dispenser Market Volume Share (%), by Country 2024 & 2032
- Figure 23: United Arab Emirates MEA Compressed Natural Gas Dispenser Market Revenue (Million), by Geography 2024 & 2032
- Figure 24: United Arab Emirates MEA Compressed Natural Gas Dispenser Market Volume (K Unit), by Geography 2024 & 2032
- Figure 25: United Arab Emirates MEA Compressed Natural Gas Dispenser Market Revenue Share (%), by Geography 2024 & 2032
- Figure 26: United Arab Emirates MEA Compressed Natural Gas Dispenser Market Volume Share (%), by Geography 2024 & 2032
- Figure 27: United Arab Emirates MEA Compressed Natural Gas Dispenser Market Revenue (Million), by Country 2024 & 2032
- Figure 28: United Arab Emirates MEA Compressed Natural Gas Dispenser Market Volume (K Unit), by Country 2024 & 2032
- Figure 29: United Arab Emirates MEA Compressed Natural Gas Dispenser Market Revenue Share (%), by Country 2024 & 2032
- Figure 30: United Arab Emirates MEA Compressed Natural Gas Dispenser Market Volume Share (%), by Country 2024 & 2032
- Figure 31: Saudi Arabia MEA Compressed Natural Gas Dispenser Market Revenue (Million), by Geography 2024 & 2032
- Figure 32: Saudi Arabia MEA Compressed Natural Gas Dispenser Market Volume (K Unit), by Geography 2024 & 2032
- Figure 33: Saudi Arabia MEA Compressed Natural Gas Dispenser Market Revenue Share (%), by Geography 2024 & 2032
- Figure 34: Saudi Arabia MEA Compressed Natural Gas Dispenser Market Volume Share (%), by Geography 2024 & 2032
- Figure 35: Saudi Arabia MEA Compressed Natural Gas Dispenser Market Revenue (Million), by Country 2024 & 2032
- Figure 36: Saudi Arabia MEA Compressed Natural Gas Dispenser Market Volume (K Unit), by Country 2024 & 2032
- Figure 37: Saudi Arabia MEA Compressed Natural Gas Dispenser Market Revenue Share (%), by Country 2024 & 2032
- Figure 38: Saudi Arabia MEA Compressed Natural Gas Dispenser Market Volume Share (%), by Country 2024 & 2032
- Figure 39: Egypt MEA Compressed Natural Gas Dispenser Market Revenue (Million), by Geography 2024 & 2032
- Figure 40: Egypt MEA Compressed Natural Gas Dispenser Market Volume (K Unit), by Geography 2024 & 2032
- Figure 41: Egypt MEA Compressed Natural Gas Dispenser Market Revenue Share (%), by Geography 2024 & 2032
- Figure 42: Egypt MEA Compressed Natural Gas Dispenser Market Volume Share (%), by Geography 2024 & 2032
- Figure 43: Egypt MEA Compressed Natural Gas Dispenser Market Revenue (Million), by Country 2024 & 2032
- Figure 44: Egypt MEA Compressed Natural Gas Dispenser Market Volume (K Unit), by Country 2024 & 2032
- Figure 45: Egypt MEA Compressed Natural Gas Dispenser Market Revenue Share (%), by Country 2024 & 2032
- Figure 46: Egypt MEA Compressed Natural Gas Dispenser Market Volume Share (%), by Country 2024 & 2032
- Figure 47: Tanzania MEA Compressed Natural Gas Dispenser Market Revenue (Million), by Geography 2024 & 2032
- Figure 48: Tanzania MEA Compressed Natural Gas Dispenser Market Volume (K Unit), by Geography 2024 & 2032
- Figure 49: Tanzania MEA Compressed Natural Gas Dispenser Market Revenue Share (%), by Geography 2024 & 2032
- Figure 50: Tanzania MEA Compressed Natural Gas Dispenser Market Volume Share (%), by Geography 2024 & 2032
- Figure 51: Tanzania MEA Compressed Natural Gas Dispenser Market Revenue (Million), by Country 2024 & 2032
- Figure 52: Tanzania MEA Compressed Natural Gas Dispenser Market Volume (K Unit), by Country 2024 & 2032
- Figure 53: Tanzania MEA Compressed Natural Gas Dispenser Market Revenue Share (%), by Country 2024 & 2032
- Figure 54: Tanzania MEA Compressed Natural Gas Dispenser Market Volume Share (%), by Country 2024 & 2032
- Figure 55: Rest of Middle East and Africa MEA Compressed Natural Gas Dispenser Market Revenue (Million), by Geography 2024 & 2032
- Figure 56: Rest of Middle East and Africa MEA Compressed Natural Gas Dispenser Market Volume (K Unit), by Geography 2024 & 2032
- Figure 57: Rest of Middle East and Africa MEA Compressed Natural Gas Dispenser Market Revenue Share (%), by Geography 2024 & 2032
- Figure 58: Rest of Middle East and Africa MEA Compressed Natural Gas Dispenser Market Volume Share (%), by Geography 2024 & 2032
- Figure 59: Rest of Middle East and Africa MEA Compressed Natural Gas Dispenser Market Revenue (Million), by Country 2024 & 2032
- Figure 60: Rest of Middle East and Africa MEA Compressed Natural Gas Dispenser Market Volume (K Unit), by Country 2024 & 2032
- Figure 61: Rest of Middle East and Africa MEA Compressed Natural Gas Dispenser Market Revenue Share (%), by Country 2024 & 2032
- Figure 62: Rest of Middle East and Africa MEA Compressed Natural Gas Dispenser Market Volume Share (%), by Country 2024 & 2032
List of Tables
- Table 1: Global MEA Compressed Natural Gas Dispenser Market Revenue Million Forecast, by Region 2019 & 2032
- Table 2: Global MEA Compressed Natural Gas Dispenser Market Volume K Unit Forecast, by Region 2019 & 2032
- Table 3: Global MEA Compressed Natural Gas Dispenser Market Revenue Million Forecast, by Geography 2019 & 2032
- Table 4: Global MEA Compressed Natural Gas Dispenser Market Volume K Unit Forecast, by Geography 2019 & 2032
- Table 5: Global MEA Compressed Natural Gas Dispenser Market Revenue Million Forecast, by Region 2019 & 2032
- Table 6: Global MEA Compressed Natural Gas Dispenser Market Volume K Unit Forecast, by Region 2019 & 2032
- Table 7: Global MEA Compressed Natural Gas Dispenser Market Revenue Million Forecast, by Country 2019 & 2032
- Table 8: Global MEA Compressed Natural Gas Dispenser Market Volume K Unit Forecast, by Country 2019 & 2032
- Table 9: United States MEA Compressed Natural Gas Dispenser Market Revenue (Million) Forecast, by Application 2019 & 2032
- Table 10: United States MEA Compressed Natural Gas Dispenser Market Volume (K Unit) Forecast, by Application 2019 & 2032
- Table 11: Canada MEA Compressed Natural Gas Dispenser Market Revenue (Million) Forecast, by Application 2019 & 2032
- Table 12: Canada MEA Compressed Natural Gas Dispenser Market Volume (K Unit) Forecast, by Application 2019 & 2032
- Table 13: Mexico MEA Compressed Natural Gas Dispenser Market Revenue (Million) Forecast, by Application 2019 & 2032
- Table 14: Mexico MEA Compressed Natural Gas Dispenser Market Volume (K Unit) Forecast, by Application 2019 & 2032
- Table 15: Global MEA Compressed Natural Gas Dispenser Market Revenue Million Forecast, by Country 2019 & 2032
- Table 16: Global MEA Compressed Natural Gas Dispenser Market Volume K Unit Forecast, by Country 2019 & 2032
- Table 17: Germany MEA Compressed Natural Gas Dispenser Market Revenue (Million) Forecast, by Application 2019 & 2032
- Table 18: Germany MEA Compressed Natural Gas Dispenser Market Volume (K Unit) Forecast, by Application 2019 & 2032
- Table 19: United Kingdom MEA Compressed Natural Gas Dispenser Market Revenue (Million) Forecast, by Application 2019 & 2032
- Table 20: United Kingdom MEA Compressed Natural Gas Dispenser Market Volume (K Unit) Forecast, by Application 2019 & 2032
- Table 21: France MEA Compressed Natural Gas Dispenser Market Revenue (Million) Forecast, by Application 2019 & 2032
- Table 22: France MEA Compressed Natural Gas Dispenser Market Volume (K Unit) Forecast, by Application 2019 & 2032
- Table 23: Spain MEA Compressed Natural Gas Dispenser Market Revenue (Million) Forecast, by Application 2019 & 2032
- Table 24: Spain MEA Compressed Natural Gas Dispenser Market Volume (K Unit) Forecast, by Application 2019 & 2032
- Table 25: Italy MEA Compressed Natural Gas Dispenser Market Revenue (Million) Forecast, by Application 2019 & 2032
- Table 26: Italy MEA Compressed Natural Gas Dispenser Market Volume (K Unit) Forecast, by Application 2019 & 2032
- Table 27: Spain MEA Compressed Natural Gas Dispenser Market Revenue (Million) Forecast, by Application 2019 & 2032
- Table 28: Spain MEA Compressed Natural Gas Dispenser Market Volume (K Unit) Forecast, by Application 2019 & 2032
- Table 29: Belgium MEA Compressed Natural Gas Dispenser Market Revenue (Million) Forecast, by Application 2019 & 2032
- Table 30: Belgium MEA Compressed Natural Gas Dispenser Market Volume (K Unit) Forecast, by Application 2019 & 2032
- Table 31: Netherland MEA Compressed Natural Gas Dispenser Market Revenue (Million) Forecast, by Application 2019 & 2032
- Table 32: Netherland MEA Compressed Natural Gas Dispenser Market Volume (K Unit) Forecast, by Application 2019 & 2032
- Table 33: Nordics MEA Compressed Natural Gas Dispenser Market Revenue (Million) Forecast, by Application 2019 & 2032
- Table 34: Nordics MEA Compressed Natural Gas Dispenser Market Volume (K Unit) Forecast, by Application 2019 & 2032
- Table 35: Rest of Europe MEA Compressed Natural Gas Dispenser Market Revenue (Million) Forecast, by Application 2019 & 2032
- Table 36: Rest of Europe MEA Compressed Natural Gas Dispenser Market Volume (K Unit) Forecast, by Application 2019 & 2032
- Table 37: Global MEA Compressed Natural Gas Dispenser Market Revenue Million Forecast, by Country 2019 & 2032
- Table 38: Global MEA Compressed Natural Gas Dispenser Market Volume K Unit Forecast, by Country 2019 & 2032
- Table 39: China MEA Compressed Natural Gas Dispenser Market Revenue (Million) Forecast, by Application 2019 & 2032
- Table 40: China MEA Compressed Natural Gas Dispenser Market Volume (K Unit) Forecast, by Application 2019 & 2032
- Table 41: Japan MEA Compressed Natural Gas Dispenser Market Revenue (Million) Forecast, by Application 2019 & 2032
- Table 42: Japan MEA Compressed Natural Gas Dispenser Market Volume (K Unit) Forecast, by Application 2019 & 2032
- Table 43: India MEA Compressed Natural Gas Dispenser Market Revenue (Million) Forecast, by Application 2019 & 2032
- Table 44: India MEA Compressed Natural Gas Dispenser Market Volume (K Unit) Forecast, by Application 2019 & 2032
- Table 45: South Korea MEA Compressed Natural Gas Dispenser Market Revenue (Million) Forecast, by Application 2019 & 2032
- Table 46: South Korea MEA Compressed Natural Gas Dispenser Market Volume (K Unit) Forecast, by Application 2019 & 2032
- Table 47: Southeast Asia MEA Compressed Natural Gas Dispenser Market Revenue (Million) Forecast, by Application 2019 & 2032
- Table 48: Southeast Asia MEA Compressed Natural Gas Dispenser Market Volume (K Unit) Forecast, by Application 2019 & 2032
- Table 49: Australia MEA Compressed Natural Gas Dispenser Market Revenue (Million) Forecast, by Application 2019 & 2032
- Table 50: Australia MEA Compressed Natural Gas Dispenser Market Volume (K Unit) Forecast, by Application 2019 & 2032
- Table 51: Indonesia MEA Compressed Natural Gas Dispenser Market Revenue (Million) Forecast, by Application 2019 & 2032
- Table 52: Indonesia MEA Compressed Natural Gas Dispenser Market Volume (K Unit) Forecast, by Application 2019 & 2032
- Table 53: Phillipes MEA Compressed Natural Gas Dispenser Market Revenue (Million) Forecast, by Application 2019 & 2032
- Table 54: Phillipes MEA Compressed Natural Gas Dispenser Market Volume (K Unit) Forecast, by Application 2019 & 2032
- Table 55: Singapore MEA Compressed Natural Gas Dispenser Market Revenue (Million) Forecast, by Application 2019 & 2032
- Table 56: Singapore MEA Compressed Natural Gas Dispenser Market Volume (K Unit) Forecast, by Application 2019 & 2032
- Table 57: Thailandc MEA Compressed Natural Gas Dispenser Market Revenue (Million) Forecast, by Application 2019 & 2032
- Table 58: Thailandc MEA Compressed Natural Gas Dispenser Market Volume (K Unit) Forecast, by Application 2019 & 2032
- Table 59: Rest of Asia Pacific MEA Compressed Natural Gas Dispenser Market Revenue (Million) Forecast, by Application 2019 & 2032
- Table 60: Rest of Asia Pacific MEA Compressed Natural Gas Dispenser Market Volume (K Unit) Forecast, by Application 2019 & 2032
- Table 61: Global MEA Compressed Natural Gas Dispenser Market Revenue Million Forecast, by Country 2019 & 2032
- Table 62: Global MEA Compressed Natural Gas Dispenser Market Volume K Unit Forecast, by Country 2019 & 2032
- Table 63: Brazil MEA Compressed Natural Gas Dispenser Market Revenue (Million) Forecast, by Application 2019 & 2032
- Table 64: Brazil MEA Compressed Natural Gas Dispenser Market Volume (K Unit) Forecast, by Application 2019 & 2032
- Table 65: Argentina MEA Compressed Natural Gas Dispenser Market Revenue (Million) Forecast, by Application 2019 & 2032
- Table 66: Argentina MEA Compressed Natural Gas Dispenser Market Volume (K Unit) Forecast, by Application 2019 & 2032
- Table 67: Peru MEA Compressed Natural Gas Dispenser Market Revenue (Million) Forecast, by Application 2019 & 2032
- Table 68: Peru MEA Compressed Natural Gas Dispenser Market Volume (K Unit) Forecast, by Application 2019 & 2032
- Table 69: Chile MEA Compressed Natural Gas Dispenser Market Revenue (Million) Forecast, by Application 2019 & 2032
- Table 70: Chile MEA Compressed Natural Gas Dispenser Market Volume (K Unit) Forecast, by Application 2019 & 2032
- Table 71: Colombia MEA Compressed Natural Gas Dispenser Market Revenue (Million) Forecast, by Application 2019 & 2032
- Table 72: Colombia MEA Compressed Natural Gas Dispenser Market Volume (K Unit) Forecast, by Application 2019 & 2032
- Table 73: Ecuador MEA Compressed Natural Gas Dispenser Market Revenue (Million) Forecast, by Application 2019 & 2032
- Table 74: Ecuador MEA Compressed Natural Gas Dispenser Market Volume (K Unit) Forecast, by Application 2019 & 2032
- Table 75: Venezuela MEA Compressed Natural Gas Dispenser Market Revenue (Million) Forecast, by Application 2019 & 2032
- Table 76: Venezuela MEA Compressed Natural Gas Dispenser Market Volume (K Unit) Forecast, by Application 2019 & 2032
- Table 77: Rest of South America MEA Compressed Natural Gas Dispenser Market Revenue (Million) Forecast, by Application 2019 & 2032
- Table 78: Rest of South America MEA Compressed Natural Gas Dispenser Market Volume (K Unit) Forecast, by Application 2019 & 2032
- Table 79: Global MEA Compressed Natural Gas Dispenser Market Revenue Million Forecast, by Country 2019 & 2032
- Table 80: Global MEA Compressed Natural Gas Dispenser Market Volume K Unit Forecast, by Country 2019 & 2032
- Table 81: United Arab Emirates MEA Compressed Natural Gas Dispenser Market Revenue (Million) Forecast, by Application 2019 & 2032
- Table 82: United Arab Emirates MEA Compressed Natural Gas Dispenser Market Volume (K Unit) Forecast, by Application 2019 & 2032
- Table 83: Saudi Arabia MEA Compressed Natural Gas Dispenser Market Revenue (Million) Forecast, by Application 2019 & 2032
- Table 84: Saudi Arabia MEA Compressed Natural Gas Dispenser Market Volume (K Unit) Forecast, by Application 2019 & 2032
- Table 85: South Africa MEA Compressed Natural Gas Dispenser Market Revenue (Million) Forecast, by Application 2019 & 2032
- Table 86: South Africa MEA Compressed Natural Gas Dispenser Market Volume (K Unit) Forecast, by Application 2019 & 2032
- Table 87: Rest of Middle East and Africa MEA Compressed Natural Gas Dispenser Market Revenue (Million) Forecast, by Application 2019 & 2032
- Table 88: Rest of Middle East and Africa MEA Compressed Natural Gas Dispenser Market Volume (K Unit) Forecast, by Application 2019 & 2032
- Table 89: Global MEA Compressed Natural Gas Dispenser Market Revenue Million Forecast, by Geography 2019 & 2032
- Table 90: Global MEA Compressed Natural Gas Dispenser Market Volume K Unit Forecast, by Geography 2019 & 2032
- Table 91: Global MEA Compressed Natural Gas Dispenser Market Revenue Million Forecast, by Country 2019 & 2032
- Table 92: Global MEA Compressed Natural Gas Dispenser Market Volume K Unit Forecast, by Country 2019 & 2032
- Table 93: Global MEA Compressed Natural Gas Dispenser Market Revenue Million Forecast, by Geography 2019 & 2032
- Table 94: Global MEA Compressed Natural Gas Dispenser Market Volume K Unit Forecast, by Geography 2019 & 2032
- Table 95: Global MEA Compressed Natural Gas Dispenser Market Revenue Million Forecast, by Country 2019 & 2032
- Table 96: Global MEA Compressed Natural Gas Dispenser Market Volume K Unit Forecast, by Country 2019 & 2032
- Table 97: Global MEA Compressed Natural Gas Dispenser Market Revenue Million Forecast, by Geography 2019 & 2032
- Table 98: Global MEA Compressed Natural Gas Dispenser Market Volume K Unit Forecast, by Geography 2019 & 2032
- Table 99: Global MEA Compressed Natural Gas Dispenser Market Revenue Million Forecast, by Country 2019 & 2032
- Table 100: Global MEA Compressed Natural Gas Dispenser Market Volume K Unit Forecast, by Country 2019 & 2032
- Table 101: Global MEA Compressed Natural Gas Dispenser Market Revenue Million Forecast, by Geography 2019 & 2032
- Table 102: Global MEA Compressed Natural Gas Dispenser Market Volume K Unit Forecast, by Geography 2019 & 2032
- Table 103: Global MEA Compressed Natural Gas Dispenser Market Revenue Million Forecast, by Country 2019 & 2032
- Table 104: Global MEA Compressed Natural Gas Dispenser Market Volume K Unit Forecast, by Country 2019 & 2032
- Table 105: Global MEA Compressed Natural Gas Dispenser Market Revenue Million Forecast, by Geography 2019 & 2032
- Table 106: Global MEA Compressed Natural Gas Dispenser Market Volume K Unit Forecast, by Geography 2019 & 2032
- Table 107: Global MEA Compressed Natural Gas Dispenser Market Revenue Million Forecast, by Country 2019 & 2032
- Table 108: Global MEA Compressed Natural Gas Dispenser Market Volume K Unit Forecast, by Country 2019 & 2032
Frequently Asked Questions
1. What is the projected Compound Annual Growth Rate (CAGR) of the MEA Compressed Natural Gas Dispenser Market?
The projected CAGR is approximately > 3.00%.
2. Which companies are prominent players in the MEA Compressed Natural Gas Dispenser Market?
Key companies in the market include Parker Hannifin Corporation*List Not Exhaustive, Pars Compressor Company, FTI Group Ltd, Gilbarco Inc, Censtar Science & Technolgy Corp Ltd, Compressor Sazi Tabriz, Galileo Technologies SA, Dover Fuelling Solutions.
3. What are the main segments of the MEA Compressed Natural Gas Dispenser Market?
The market segments include Geography.
4. Can you provide details about the market size?
The market size is estimated to be USD XX Million as of 2022.
5. What are some drivers contributing to market growth?
Increasing Offshore Oil and Gas Exploration and Production Activities4.; Growing Demand for Energy.
6. What are the notable trends driving market growth?
Growing Demand of CNG vehicles Expected to Drive the Market.
7. Are there any restraints impacting market growth?
High Upfront Costs.
8. Can you provide examples of recent developments in the market?
July 2022: Dover Fuelling Solutions (DFS), the global provider of technologies and services for the fuel industry, announced the launch of a new technologically advanced four-nozzle Wayne Helix CNG dispenser and hydrogen dispenser for EMEA (Europe, Middle-East, and Africa) region.
9. What pricing options are available for accessing the report?
Pricing options include single-user, multi-user, and enterprise licenses priced at USD 4750, USD 5250, and USD 8750 respectively.
10. Is the market size provided in terms of value or volume?
The market size is provided in terms of value, measured in Million and volume, measured in K Unit.
11. Are there any specific market keywords associated with the report?
Yes, the market keyword associated with the report is "MEA Compressed Natural Gas Dispenser Market," which aids in identifying and referencing the specific market segment covered.
12. How do I determine which pricing option suits my needs best?
The pricing options vary based on user requirements and access needs. Individual users may opt for single-user licenses, while businesses requiring broader access may choose multi-user or enterprise licenses for cost-effective access to the report.
13. Are there any additional resources or data provided in the MEA Compressed Natural Gas Dispenser Market report?
While the report offers comprehensive insights, it's advisable to review the specific contents or supplementary materials provided to ascertain if additional resources or data are available.
14. How can I stay updated on further developments or reports in the MEA Compressed Natural Gas Dispenser Market?
To stay informed about further developments, trends, and reports in the MEA Compressed Natural Gas Dispenser Market, consider subscribing to industry newsletters, following relevant companies and organizations, or regularly checking reputable industry news sources and publications.
Methodology
Step 1 - Identification of Relevant Samples Size from Population Database


Step 2 - Approaches for Defining Global Market Size (Value, Volume* & Price*)

Note*: In applicable scenarios
Step 3 - Data Sources
Primary Research
- Web Analytics
- Survey Reports
- Research Institute
- Latest Research Reports
- Opinion Leaders
Secondary Research
- Annual Reports
- White Paper
- Latest Press Release
- Industry Association
- Paid Database
- Investor Presentations

Step 4 - Data Triangulation
Involves using different sources of information in order to increase the validity of a study
These sources are likely to be stakeholders in a program - participants, other researchers, program staff, other community members, and so on.
Then we put all data in single framework & apply various statistical tools to find out the dynamic on the market.
During the analysis stage, feedback from the stakeholder groups would be compared to determine areas of agreement as well as areas of divergence


